2019
Liver Iron Concentration determined by Gradient Echo MRI using Signal Intensity Ratios: Impact of Acquisition Parameters and Image QualityArthur Peter Wunderlich1,2, Holger Cario3, Isabelle Tomczak1, Meinrad Beer1, and Stefan Andreas Schmidt1
1Diagnostic and Interventional Radiology, Ulm University, Medical Center, Ulm, Germany, 2Section for Experimental Radiology, Ulm University, Medical Center, Ulm, Germany, 3Department of Pediatrics and Adolescent Medicine, Ulm University, Medical Center, Ulm, Germany
Synopsis
Tissue signal intensity ratio (SIR) has been used for a long time to determine liver iron concentration (LIC) based on gradient echo MRI. We studied the influence of acquisition parameters FA, RF spoiling and saturation regions, as well as image quality score, on the correlation of natural logarithm of SIR values to reference LIC obtained with spin echo. In our cohort of 85 patients, no significant influence on the slope of linear regression line was found, neither of acquisition protocol settings nor image quality, whereas the intercept was dependent on parameters influencing T1 sensitivity, namely FA and RF spoiling.
Purpose
This work was performed to test the influence of acquisition parameters on a) image quality of gradient echo (GRE) acquisitions and b) the correlation between liver-to-reference signal intensity ratio (SIR) values obtained with GRE and reference liver iron concentration (LIC) based on spin echo (SE). Correlation was then c) also tested for influence of image quality.Background
It has been shown previously that there is a linear correlation between natural logarithm of SIR values (ln SIR) and LIC (1). In brief, slope of ln (SIR) vs. LIC is associated to R2* differences of tissues, whereas intercept of this relation is the logarithm of scaling factor (S0) ratio, which depends on tissue T1 and MR acquisition parameters.Methods
85 patients (38 f, 47 m, age range 2.3 – 73 years, mean 24 ± 15.7 y) suspected for liver iron overload were scanned at 1.5 T (Siemens Avanto, Siemens Healthineers, Iselin, NJ) with two MRI protocols: a) the Ferriscan® protocol involving five SE sequences in free breathing, each of 3:15 min duration, and b) three transversal slices acquired using multi-echo GRE at TE/TR 4.7-9.5-14.2-19/120 ms, FA of 20° and 90°, both with and without RF spoiling (FLASH/T1-FFE/SPGR vs. FISP/FFE/GRASS), requiring a total of four breathholds. A saline bag was positioned on the left side adjacent to the patient body. In 31 investigations, saturation regions (SATs) were applied cranial and caudal of the transversal slices in order to destroy signal from mobile protons causing pulsation artefacts. Image quality was scored on a five-point scale (no/minor/moderate/severe artifacts, non-diagnostic). Three regions were manually placed in the liver, one each in left and right paraspinal muscle, and one in the saline bag. ROI median value was employed to calculate natural logarithm of liver-to-muscle and liver-to-saline SIR. Both were correlated to reference LIC obtained by Ferriscan®. Linear regression analysis of ln (SIR) vs. reference LIC was performed separately for different FA, RF spoiling condition, +/- SATs, and image quality score ranges, yielding values for slope and intercept of linear regression lines and their uncertainties, as well as coefficient of determination R2. Results of regression were compared between acquisition parameters and image quality scores. Differences, where present, were checked for significance.Results
With RF spoiling, image quality was scored 1 or 2 (no or minor artefacts) in 23/31 (74%) investigations performed with SATs and 25/54 (46%) scans without SATs. Overall, 48/85 (56%) examinations were scored 1 or 2. Without RF spoiling, only 19/31 (61%) cases with SATs, and 22/54 (41%) without SATs, overall 41/85 (48%) were scored 1 or 2. No case was scored non-diagnostic, neither with nor without RF spoiling. For mean and SD of scores for different conditions cf. Tab. 1. Slopes of ln (SIR) vs. reference LIC were equal between conditions, whereas intercept varied between acquisitions with and without RF spoiler at FA 90°. At FA 20°, there was no significant difference between RF spoiling conditions. When using saline reference, differences concerning RF spoiling at FA 90° were more pronounced than using paraspinal muscles as reference. Some examples of correlations between ln (SIR) and reference LIC are depicted in Fig. 1 for liver-to-NaCl SIR and in Fig. 2 for liver-to-muscle SIR. Correlations between reference LIC and ln (SIR) were good, with an R2 between 0.85 and 0.9 with saline reference, and 0.88 < R2 < 0.93 with paraspinal muscles as reference. Within their uncertainty, correlation parameters slope and intercept, as well as R2, were independent of image quality score, +/- SATs, and +/- RF spoiling. Uncertainty of correlation parameters was lower with muscle reference than saline.Discussion
Correlation of signal intensity ratios determined from GRE MRI to reference LIC values determined with SE turned out to be independent of GRE scan parameters. Although saturation regions and RF spoiling have a positive impact on image quality, it was shown that they do not influence correlation between ln (SIR) and reference LIC. Coefficients of determination and precision of correlation parameters benefit from using paraspinal muscles as signal reference compared to a saline bag.Acknowledgements
No acknowledgement found.References
1. Wunderlich AP, Cario H, Bommer M, Beer M, Schmidt SA, Juchems MS. MRI-Based Liver Iron Content Determination at 3T in Regularly Transfused Patients by Signal Intensity Ratio Using an Alternative Analysis Approach Based on R2* Theory. RoFo 2016. PubMed PMID: 27299667.Figures
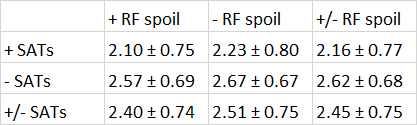
Tab.
1. Image quality for different protocol settings. ‘SATs’ means cranial and
caudal saturation regions parallel to the transversal slices. Given are mean
scores and standard deviation. Scores are rated as 1: no artefacts, 2: minor,
3: moderate, 4: severe artifacts, 5: non-diagnostic.
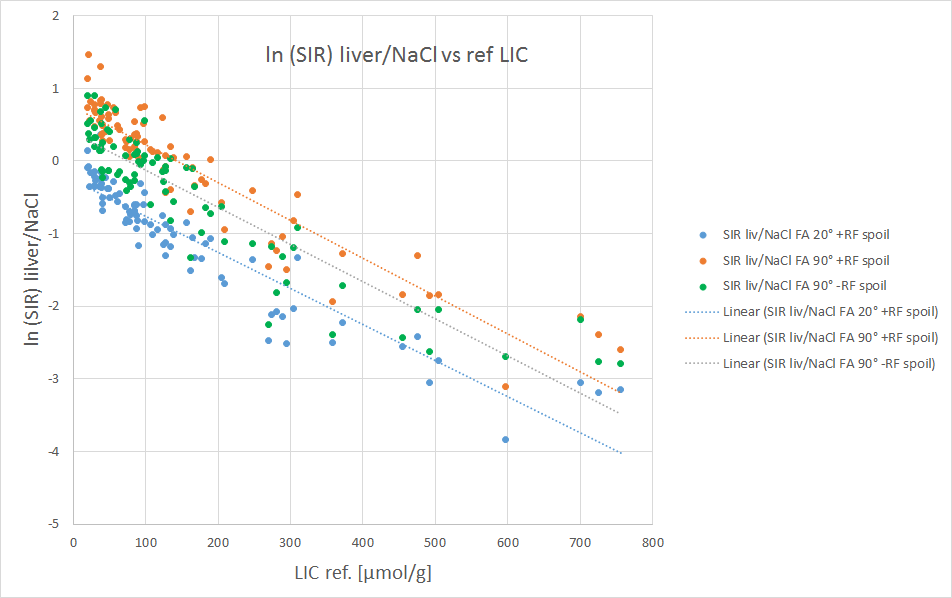
Fig.
1. Natural logarithm of liver-to-NaCl SIR vs. reference LIC. Acquisition
parameters were FA 20° with RF spoiling (T1-FFE/FLASH/SPGR), and FA 90 with and
without RF spoiling. Note differences in intercept of regression line due to
long T1 of NaCl, whereas slope is equal within confidence intervals.
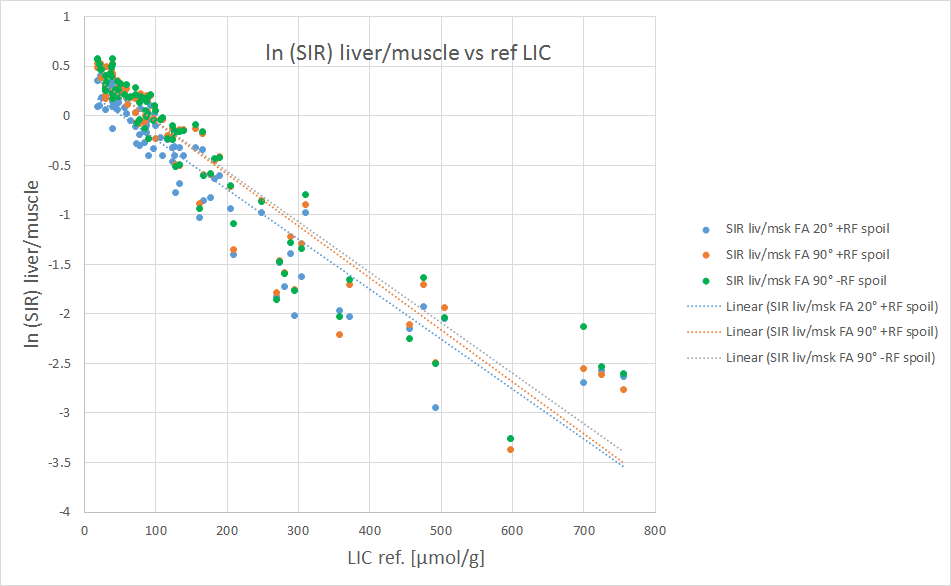
Fig.
2. Natural logarithm of liver-to-muscle SIR vs. reference LIC. Acquisition
parameters were FA 20° with RF spoiling, and FA 90 with and without RF
spoiling. Note smaller differences in intercept of regression line due to smaller
T1 of muscle compared to NaCl. Slope is equal, despite different acquisition
parameters, as it is in Fig. 1.