2018
Liver Iron Concentration determined with Gradient Echo MRI by Signal Intensity Ratio: Effects of Patient CharacteristicsArthur Peter Wunderlich1,2, Holger Cario3, Isabelle Tomczak1, Meinrad Beer1, and Stefan Andreas Schmidt1
1Diagnostic and Interventional Radiology, Ulm University, Medical Center, Ulm, Germany, 2Section for Experimental Radiology, Ulm University, Medical Center, Ulm, Germany, 3Department of Pediatrics and Adolescent Medicine, Ulm University, Medical Center, Ulm, Germany
Synopsis
To investigate the relation between signal intensity ratios gained from gradient echo (GRE) MRI and liver iron concentration (LIC), we studied the influence of patient characteristics. 168 patients (71 f, 97 m; 49 with Thalassemia major, 101 without Thalassemia) suspected for liver iron overload were scanned according to Ferriscan® with spin echo MRI to obtain reference LIC values, and GRE protocols suitable for LIC determination. GRE analysis by manually drawn liver and muscle ROIs yielded liver-to-muscle signal intensity ratios (SIR). Correlation analysis of ln (SIR) to reference LIC revealed differences between patient subgroups concerning disease, gender and age.
Purpose
This work was performed to study effects of patient characteristics, i.e. disease, age, and gender, on the relation between liver-to-muscle signal intensity ratio (SIR) values calculated using gradient echo (GRE) data, and reference liver iron concentration (LIC) values obtained by spin-echo (SE).Methods
168 patients (71 f, 97 m, age range 2.3 – 79.9 years, mean 33.6 ± 20.8 y) suspected for iron overload due to various diseases were investigated for liver iron concentration by MRI. Transversal slices of the liver were acquired with two different protocols. For reference, the Ferriscan® protocol was performed (Resonance Health, Claremont, WA, Australia), consisting of five SE series with TE of 6, 9, 12, 15 and 18 ms. Results of centralized analysis were used as reference LIC. Additionally, GRE data were acquired in a single breathhold at TE/TR/FA 4.7/120ms/90°. GRE images were analyzed by manually placing three ROIs in liver parenchyma free of vessels and artefacts, and two in paraspinal muscles, avoiding potential pulsation artefacts. Liver-to-muscle SIR was calculated from median ROI values, and its natural logarithm (ln) correlated to reference LIC. To investigate influence of disease, patients were divided into groups without Thalassemia, Thal. major and other forms of Thalassemia. Since age differed between groups (cf. tab. 1), correlation was performed in four steps: a) linear regression between ln (SIR) and reference LIC was performed in all patients together and separated by gender, b) divided by disease and gender regardless of age, c) in a subgroup including only patients of age between 10 and 40 years, separated by disease and gender, and d) in patients with no Thalassemia above age of 40 years. Coefficient of determination R2 of all correlations was determined as a measure of correlation quality. Parameters of linear regression (slope, intercept) and their uncertainties were checked for differences related to patient characteristics.Results
Correlation between ln (SIR) and reference LIC was good with R2 of 0.86 for all patients, 0.92 for Thal. maj. and 0.85 for patients with no Thalassemia. Slopes of regression lines did not differ significantly. Considering correlation separated by gender, R2 was 0.80 for female and 0.92 for male patients. Corresponding scatter plots and regression lines are depicted in fig. 1. Differences in slope, although more pronounced than for different diseases, were not significant. Separating the Thal. maj. group by gender, we got R2 of 0.97 for female and 0.95 for male Thal. maj. patients. Slope differences of regression lines were increased, cf. fig. 2, compared to gender differences considering all patients (fig. 1). Restricting analysis to age range of 10 to 40 years, which means a comparable age distribution in all subgroups, (for patient numbers in subcategories cf. Tab. 2), yielded further increased R2 in Thal. maj. patients (0.98 for female and 0.96 for male patients) and significant slope differences, cf. fig. 3. However, in this age range, R2 was reduced in patients with no Thalassemia. On the other hand, for patients without Thalassemia above 40 years of age (52 pts, 20 f, 32 m; diseases in this age group were predominantly different forms of anemia, leukemia, and MDS), we found R2 of 0.92 (0.86 for female, 0.95 for male), i.e. larger coefficients of determination than considering all ages. Fig. 4 gives a scatter plot of these data. Correlation parameters showed no gender dependence in patients above 40 years without Thalassemia.Discussion
Improved correlation in smaller subgroups indicate significant difference due to subgroup characteristic. Therefore, we conclude that disease, gender and age have to be taken into account when attempting to determine LIC from GRE data using the SIR method. Since Thalassemia was our largest patient subgroup, we studied this disease compared to others in a first step. It remains unclear due to small patient numbers whether there are also differing correlations of ln (SIR) to reference LIC between other diseases. Also, it is worthwhile to figure out whether different correlation between ln (SIR), derived from GRE data, and reference LIC, obtained from SE acquisitions, reflects solely effects of different acquisition strategies (GRE vs. SE) or has to do with underlying iron storage mechanisms, namely aggregated vs. dispersed iron (1).Conclusion
Patient characteristics like disease, gender and age have to be considered in SIR analysis of GRE MRI when attempting to determine LIC. Further studies are needed to check whether this also applies to R2* analysis of GRE data.Acknowledgements
We acknowledge Prof. G. Grön for help with statistics.References
1. Jensen JH, Tang H, Tosti CL, Swaminathan SV, Nunez A, Hultman K, et al. Separate MRI quantification of dispersed (ferritin-like) and aggregated (hemosiderin-like) storage iron. Mag Reson Med 2010; 63(5):1201-9. PubMed PMID: 20432291.Figures
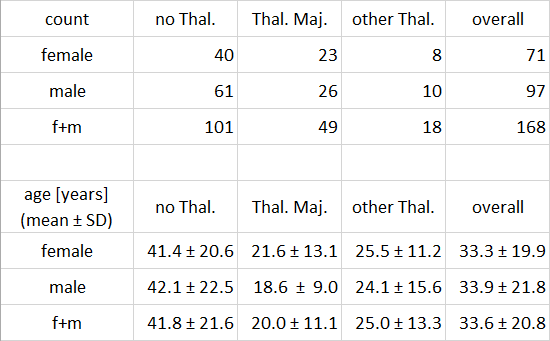
Tab.
1. Numbers of patient and mean age for subgroups by gender and disease. There
is no age difference between female and male patients. Age differences between
patients of both Thalassemia groups and patients with no Thalassemia are significant
(p < 0.001).
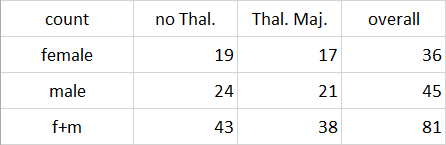
Tab.
2. Numbers of patients between 10 and 40 years of age, separated by disease.
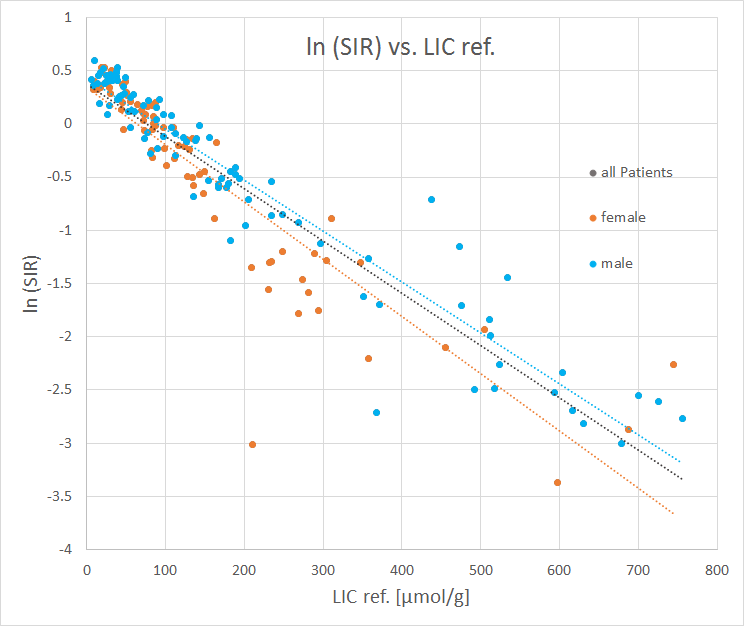
Fig.
1. Correlation between ln (SIR) and reference LIC for all patients, and
separated by gender. Note that symbols for ‘all patients’ are hidden by the
respective labels for female and male subgroups. Slope of regression lines (the
gray line refers to all patients) differ between male and female patients,
however, not significantly.
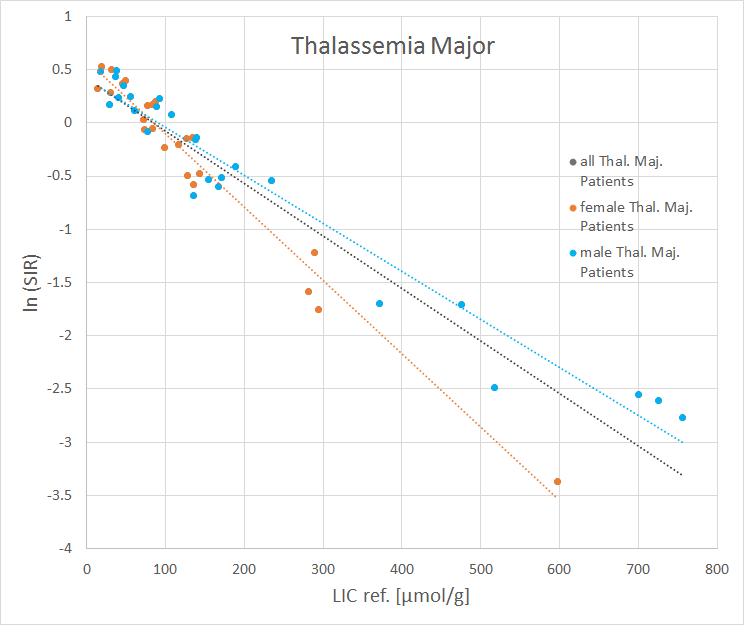
Fig.
2. Correlation between ln (SIR) and reference LIC for patients with Thalassemia
Major, separated by gender. Note the increased differences in slope of
regression lines compared to Fig. 1, where all diseases were considered.
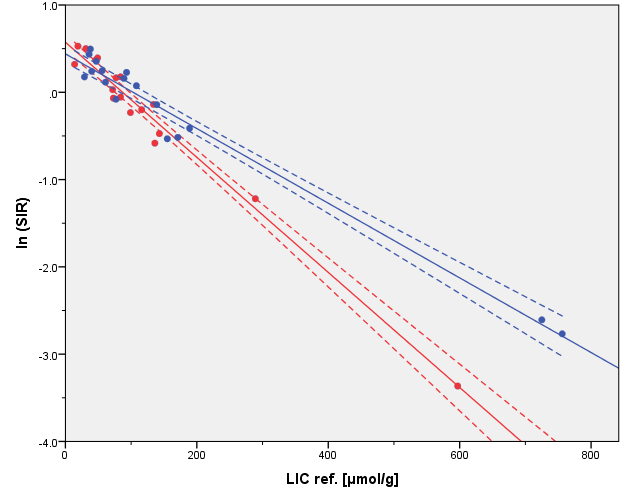
Fig.
3. Correlation between ln (SIR) and
reference LIC for patients between 10 and 40 years of age with Thalassemia Major,
separated by gender. Note significantly different slopes, indicated by
non-overlapping confidence intervals of regression lines.
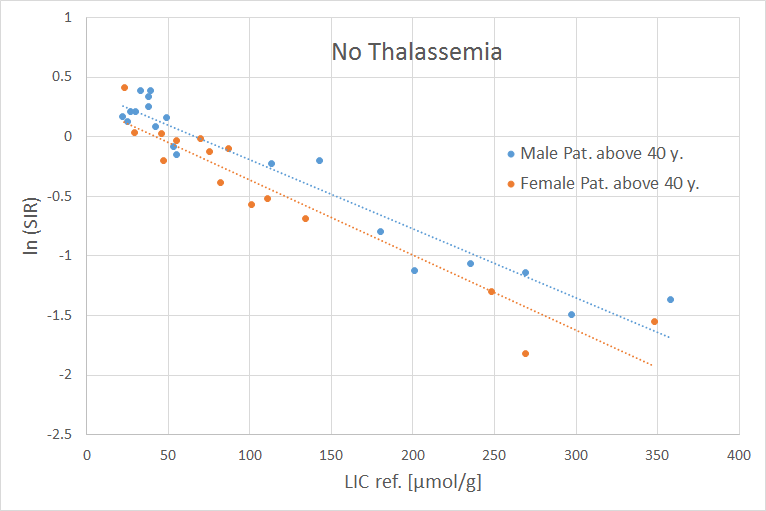
Fig.
4. Correlation between ln (SIR) and reference LIC for patients without
Thalassemia above 40 years of age, separated by gender. Note good correlation and
no significant differences in linear regression lines.