2017
A Preliminary Study of the Clinical Value of FM Model in Malignant Tumor of Liver1Department of Radiology, Beijing Chaoyang Hospital, Beijing, People's Republic of China
Synopsis
Several models have been proposed to explain the anomalous diffusion in biological tissues. Among them, the fractional motion (FM) model was considered more appropriate. In this study, the FM model was applied to assess its feasibility for diagnosing malignant tumors of liver. It was found that the FM model could improve the diagnostic accuracy in differentiation normal liver tissue and tumor lesion, indicating the potential of the FM model to facilitate future studies of pathological changes in clinical populations.
Purpose
Currently diagnosis of malignant tumor of liver depends on contrast-enhanced perfusion MR imaging. Many benign tumors had the similar imaging characteristics as malignant tumors1 . Diffusion MRI (dMRI) enables qualitative and quantitative assessment of malignant liver tumor without the use of gadolinium chelates, which makes it a highly attractive technique, particularly in patients with severe renal dysfunction at risk for nephrogenic systemic fibrosis2. Conventional dMRI is quantified using the mono-exponential model, which assumes a Brownian motion process. However, it has been shown that the diffusion-induced signal attenuation deviates from the mono-exponential form in biological tissues, particularly over an extended b-value range3. Several models, with parameters in addition to the conventional apparent diffusion coefficient (ADC)3, have been proposed to address this phenomenon. Among them, the fractional motion (FM) model was considered more appropriate to describe the diffusion processes in living cells4,5,6. The purpose of this study is to demonstrate the feasibility of the FM model for describing anomalous diffusion in diagnosing malignant tumor of liver.
Method
A total of 8 patients with malignant tumor of liver were included in this study. The MR data acquisition was performed on a 3T GE Discovery MR750 MRI scanner. Acquisition parameters were: TR/TE = 5200 ms/80 ms; FOV = 36 cm × 36 cm; matrix size = 128 × 128; slice thickness = 6 mm; and number of excitations = 2. The diffusion gradients were applied successively in three orthogonal directions (i.e. x, y, z). In each direction, after b0 image, 14 b-values ranging from 150 to 2200 s/mm2were produced by varying the diffusion gradient amplitudes, the gradient duration (δ) and the separation time (Δ) while keeping δ/Δ constant (0.6). In addition, an axial T2-weighted structural image was acquired providing whole liver coverage for each subject.
After correction for eddy current distortions and rigid motions using FSL tools, the dMRI images were analyzed under the FM-based framework and the FM-related parameters, the spatial related parameter α and the temporal related parameter β, were calculated. In addition, ADC maps were also obtained using the images acquired at b-values of 0 and 1000 s/mm2. Directionally averaged maps were then calculated to reduce the influence of anisotropy. Regions of interest (ROIs) for tumor areas, manually drawn by the author, were placed at the level of the tumor’s largest area which avoids the necrotic regions. For comparison, diffusion related parameters of normal liver tissue were extracted. Paired t-test was used to assess whether there are significant differences between tumor regions and normal liver tissues.
Results
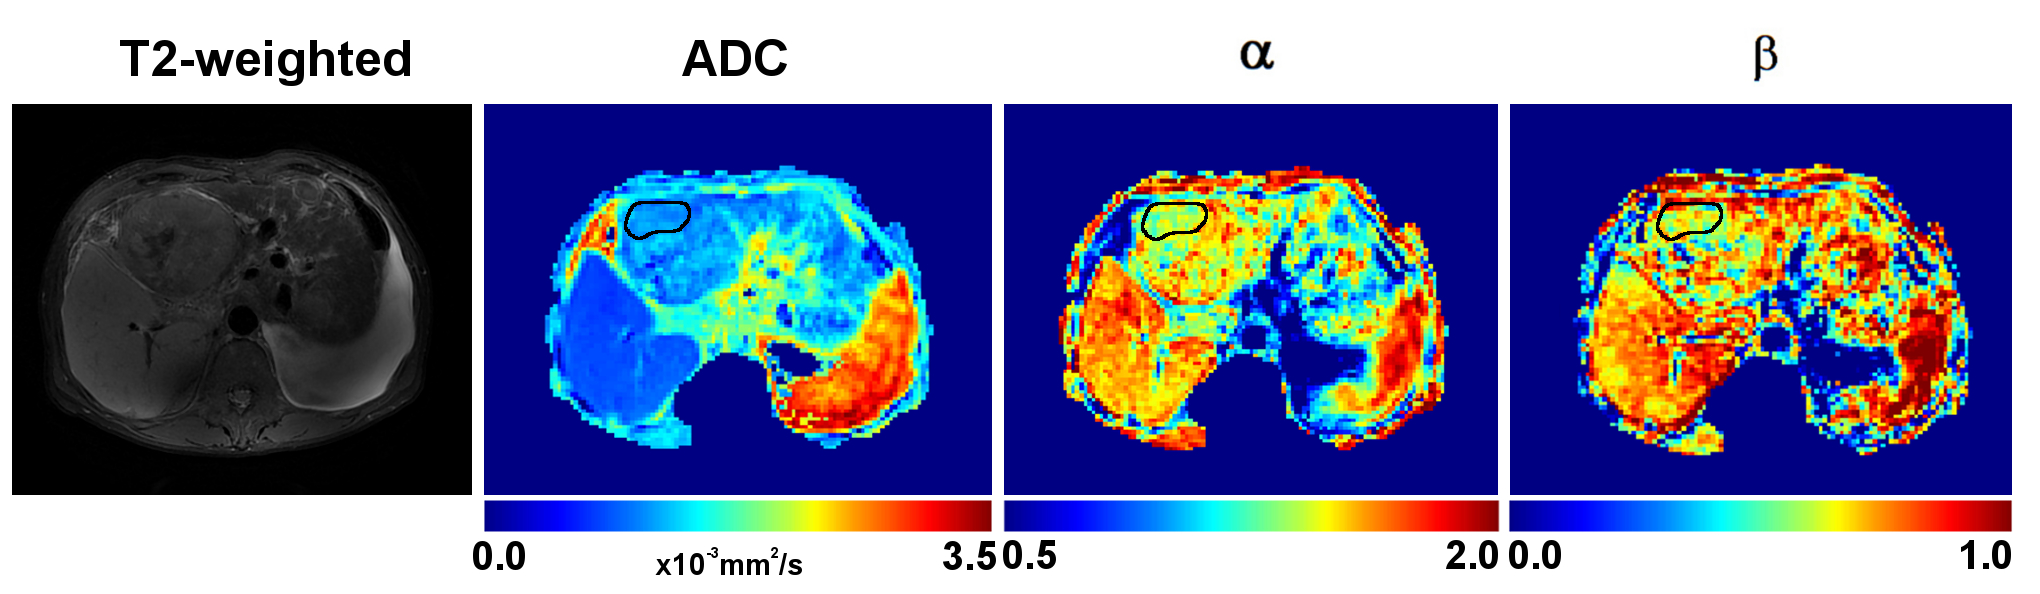
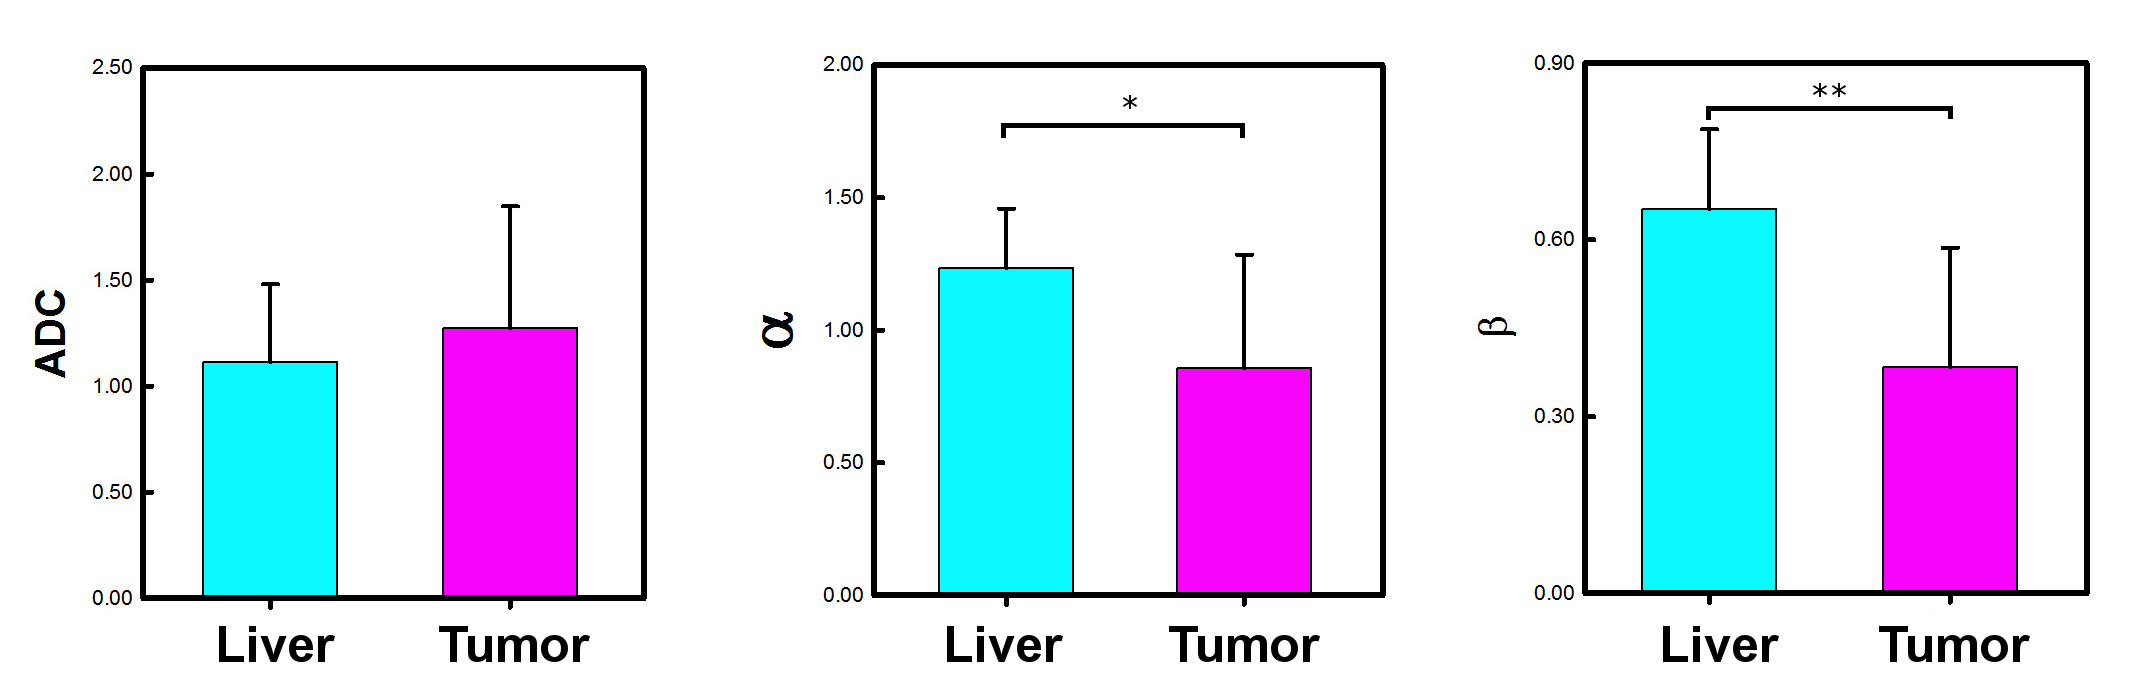
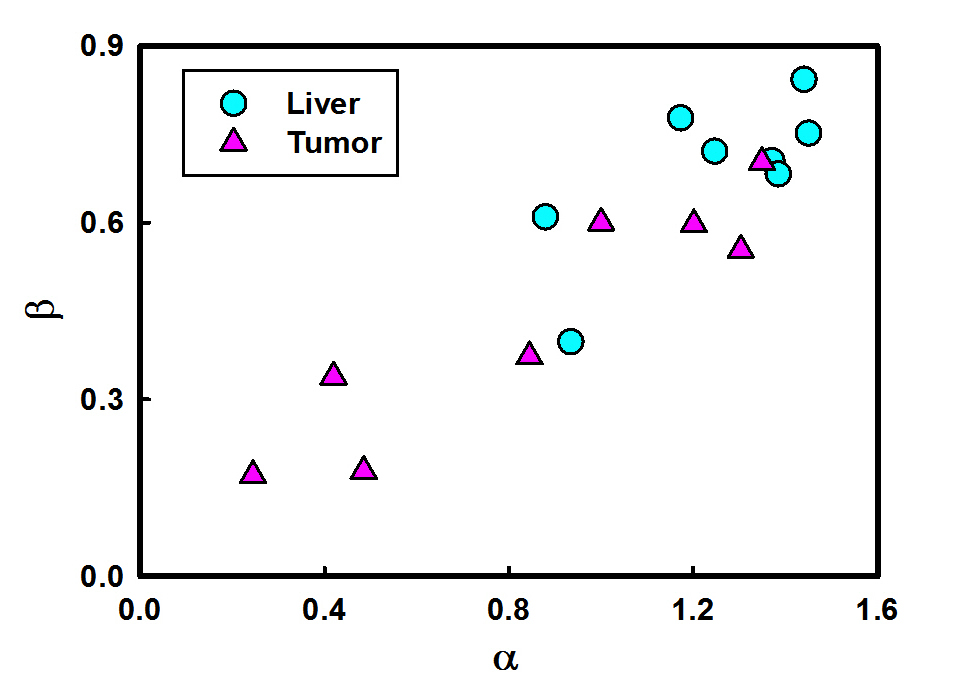
T2-weighted image, ADC, α and β maps of a typical subjects with malignant tumor of liver are shown in Fig. 1. The solid tumor ROI is outlined with black contours in the parameter maps. Visually, ADC value has no significant difference in the tumor region compared to the normal liver tissue. On the contrary, both α and β maps showed decreased value of tumor regions as compared to the normal liver tissues. Detailed group comparison results are shown in Fig. 2. It is seen that both α and β parameters had statistically significant decreased value in tumor regions compared to normal liver tissues (p = 0.037 and p = 0.009, respectively), while there was no significant difference for ADC values (p = 0.35). A scatter diagram of α versus β values for both tumor regions and normal liver tissues were shown in Fig. 3. It reveals differences between two types of tissues.Discussion and Conclusion
In this feasibility study, the use of FM model in detecting malignant tumors of liver was investigated. The FM model may be used for distinguish malignant tumor tissue from normal liver. On the contrary, the conventional ADC was unable to identify the tumor tissue. In FM model, the parameter α determines the spatial distribution of microscopic jump length, and the parameter β governs the temporal correlation of diffusion process. Based on the results, both spatial and temporal properties of diffusion process in tumor regions are derivate from those in normal liver tissues. Besides, further study with a larger cohort is needed in revealing the clinical value of FM model in malignant tumor of liver.Acknowledgements
No acknowledgement found.References
1. Hectors S J, Wagner M, Besa C, et al. Intravoxel incoherent motion diffusion-weighted imaging of hepatocellular carcinoma: Is there a correlation with flow and perfusion metrics obtained with dynamic contrast-enhanced MRI?[J]. Journal of Magnetic Resonance Imaging Jmri, 2016, 44.
2. Vilgrain, V., et al. Diffusion-weighted MR imaging of the liver.Journal de radiologie 91.3 Pt 2 (2010): 381-90.
3. De Santis S, Gabrielli A, Palombo M, et al. Non-Gaussian diffusion imaging: a brief practical review. Magn Reson Imaging 2011;29:1410–6.
4. Magdziarz M, Weron A, Burnecki K, et al. Fractional Brownian Motion Versus the Continuous-Time Random Walk: A Simple Test for Subdiffusive Dynamics. Phys Rev Lett 2009;103:180602.
5. Szymanski J, Weiss M. Elucidating the Origin of Anomalous Diffusion in Crowded Fluids. Phys Rev Lett 2009;103:38102.
6. Fan Y, Gao J-H. Fractional motion model for characterization of anomalous diffusion from NMR signals. Phys Rev E 2015;92:12707.
Figures