2016
Quantification of liver fat after Gd-EOB-DTPA injection: a IDEAL-IQ feasibility study1Department of MR, The First Affiliated Hospital of Harbin Medical University, Harbin, People's Republic of China, 2GE HealthCare, MR Research China, Beijing, People's Republic of China
Synopsis
This article is to explore the feasibility of liver fat quantification via dynamic liver enhancement scanning after injection of Gd-EOB-DTPA. IDEAL-IQ was used to quantify liver fat in 65 patients who were injected with contrast. IDEAL-IQ was performed four times to determine the fat fraction (FF) and R2*. One-way repeated-measures analysis was conducted to evaluate the difference between the four time points of the FF. The assessment of FF at four time points in liver, spleen and spine showed no significant differences. However, after injection of contrast agent, R2* was increased, and the IDEAL-IQ result was relatively stable.
Purpose
The purpose of this article is to explore the feasibility of liver fat quantification via dynamic liver enhancement scanning after injecting Gd-EOB-DTPA.Introduction
Fat fraction is a key parameter for the diagnosis and monitoring of non-alcoholic fatty liver disease (NAFLD). Rapid radiological detection and diagnosis is essential for prompt clinical intervention in NAFLD [1]. Quantitative and effective clinical evaluation of fatty liver has been recently studied [2]. Although IDEAL-IQ has been broadly used to obtain information of the diffused lesions for morphological analysis and quantitative evaluation of their metabolic changes, an efficient and optimized scanning protocol has not been setup. Moreover, some challenges associated with applying Gd-EOB-DTPA, a widely used liver-specific contrast media, need to be addressed. Application of IDEAL-IQ after an injection of Gd-EOB-DTPA and further evaluation of liver fat facilitate a comprehensive treatment.Materials and Methods
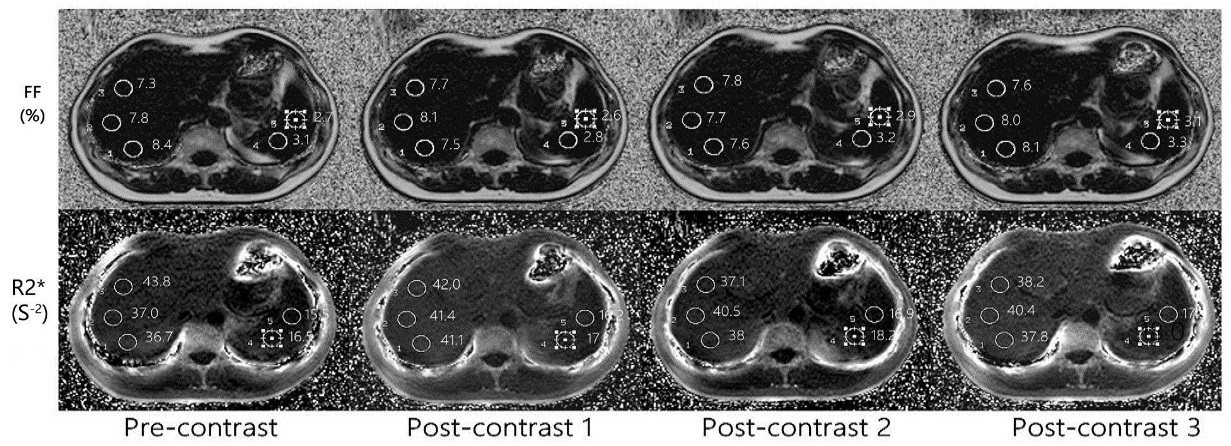
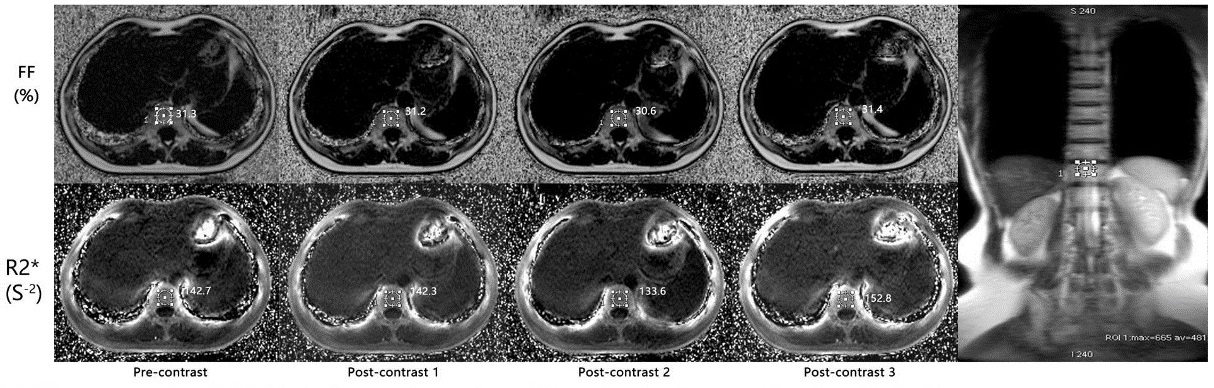
A total of 79 patients were enrolled in this study. The exclusion criteria were: 1) poor image quality caused by factors such as incompatible breath-hold; 2) patients with focal liver lesions exceeding 50%; 3) patients who had abdominal operation; and 4) patients suspected iron overload. IDEAL-IQ was used to quantify liver fat in 65 patients who were injected with Gd-EOB-DTPA. The dosage was 0.025 mmol/kg followed by 20 mL saline. The injection speed was 2.0~3.0 mL/s. After injection of contrast agent, LAVA-MASK was used to perform dynamic-enhanced scanning in arterial phase, portal phase and equilibrium phase. IDEAL-IQ was performed four times to determine the fat fraction (FF) and R2*: pre-contrast, between portal phase (70 s) and equilibrium phase (180 s), delayed phase (5 min) and hepatobiliary phase (20 min). All the images were evaluated by functiontool9.4 to obtain FF and R2* values. The detection method selected portahepatis layer with a diameter of 16 mm in the right liver lobe to calculate the mean values(Fig.1). The ROIs were selected by avoiding intrahepatic bile duct, blood vessel and focal liver lesion. The FF values detected by the image represented the fat content in the liver mass, which should not be greater than 5% in normal individuals. Using the same method, two more ROIs were drawn in spleen (Fig.1) and one more in spinal vertebral layer(Fig.2). Their FF and R2* values were recorded at the four time points. The data were then expressed as mean ± SD, and analyzed by ANOVA for repeated measurements. Furthermore, in each region and at each time point, the values before and after injecting the contrast agent were compared, and Bland-Altman was applied to analyze the difference.Results and Discussion
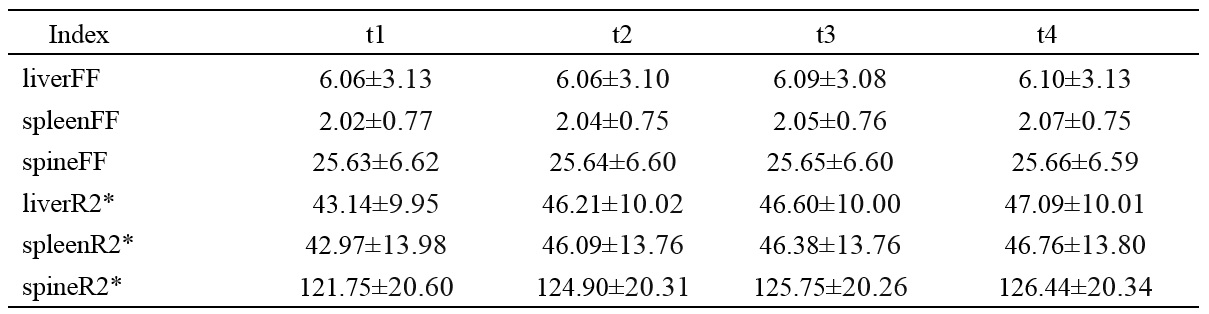
For the 65 patients, the final FF and R2* values of the liver, spleen and spine are shown in Table 1. The FF values of liver, spleen and spine were compared before (at t1) and after (at t2, t3, and t4) injecting the contrast agent. The results showed no significant difference. The R2* values of liver, spleen and spine increased significantly after injection, indicating T2* alterations caused by Gd-EOB-DTPA. The hepatic FF measurements at t1, t2, t3 and t4 were in good agreement (95 % confidence interval), demonstrated by the Bland-Altman plots. These findings suggested good stability and repeatability of IDEAL-IQ FF measurements under the impact of Gd-EOB-DTPA. Until today, investigations on IDEAL related R2* changes caused by Gd has not been seen. Gd-EOB-DTPA (generated by a lipophilic EOB based on Gd) was absorbed by nearly 50% of the hepatic cells via organic anion transporting polypeptide (OATP). With a portion of the contrast agent entered hepatic cells from intercellular space, the magnetic field environment and T2*, instead of the water or fat composition, were altered. As a widely used liver-specific contrast agent, Gd-EOB-DTPA has similar effect on T2* and T1 relaxation time compared with GD. IDEAL-IQ rectified the confounding factors that interfered with fat quantification such as T2* decay, multi-fat spectrum peak distribution, and generated water and fat images as well as FF and R2* maps.Conclusion
With the injection of Gd-EOB-DTPA, IDEAL-IQ yielded consistent imaging results. Therefore, IDEAL-IQ performed measurements after different time points enhancement, increased MR efficiency and optimized the MR scanning protocol. It provides a comprehensive evaluation of liver fat distribution.Acknowledgements
No acknowledgement found.References
[1] Idilman I S,et al. A comparison of liver fat content as determined by magnetic resonance imaging-proton density fat fraction and MRS versus liver histology in non-alcoholic fatty liver disease[J]. Acta Radiologica, 2015, 98(12):1921-9.
[2] Wieland A C, et al. Low awareness of nonalcoholic fatty liver disease among patients at high metabolic risk.[J]. Journal of Clinical Gastroenterology, 2015, 49(1):e6-e10.
Figures