2015
Apparent Diffusion Coefficient of Hepatocellular Carcinomas on Diffusion-Weighted Imaging: Correlation with Histopathologic Tumor Grade versus Arterial Vascularity during the Dynamic MRI1Department of Radiology, Yonsei University Gangnam Severance Hospital, Seoul, Korea, Republic of
Synopsis
Depending on the difference of cellular densities related to the histopathologic grades of HCCs, some investigators have recently suggested apparent diffusion coefficient (ADC) on diffusion-weighted imaging (DWI) as an effective biomarker for the prediction of the patients’ prognosis before the treatment of HCC. In the present study, ADCs of well- or poorly differentiated HCCs were lower than moderately differentiated HCCs; meanwhile the degree of arterial phase enhancement during the dynamic imaging rather well stratified the ADCs of the lesions. We concluded that ADC could not be independently used to estimate the histopathologic grades of HCCs.
Introduction
Due to the worse prognosis of poorly differentiated hepatocellular carcinomas (HCCs) compared with well- or moderately differentiated HCCs, prediction of the histopathologic grades before the treatment of HCC would be crucial for the patients’ management.1,2 Recently, some investigators have proposed the apparent diffusion coefficient (ADC) on diffusion-weighted imaging (DWI) as a biomarker which reflects the histopathologic grades of HCC.3-6 The basic concept of ADCs for stratification depended on the relationship between the cellular densities and the histopathologic grades, and water diffusion would be more restricted in poorly differentiated HCCs than well-differentiated lesions because of its higher cellular densities. However, debates still persist with whether the difference of cellular densities can apparently influence on the diffusion of extracellular water molecules.7 Moreover, ADC inherently contains perfusion fraction which could be affected by different tumor vascularity. The aim of this study was to find out which is more related to the ADC on DWI out of the histopathologic grades or the arterial vascularity during the dynamic MRI.Materials and Methods
Subjects
This retrospective study was approved by the institutional review board, and the requirement of informed consent was waived. A total of 141 surgically and histopathologically confirmed HCCs (16 well-, 83 moderately-, and 42 poorly-differentiated) from 131 consecutive patients during a 5-year period in a single institution were subjected.
MRI Protocol
All MRI examinations were performed with a 1.5 T system (Magnetom Avanto, Siemens, Erlangen, Germany). For dynamic MRI, gadoxetic acid (Primovist, Bayer Schering; 0.025 mmol/kg) was injected through a power injector with a speed of 1 mL/s and immediately followed by a 30 mL saline flush at a same rate. A dynamic series consisted of one pre-contrast series followed by three successive post-contrast series including early arterial, late arterial, and portal venous phase imaging with 34 s intervals (20 s for image acquisition with breath-holding and 14 s for re-breathing) for the start of each imaging phase. After the dynamic imaging, respiratory triggered DWI sequences were performed with the single-shot echo planar imaging (SS EPI) with motion probing gradients in three directions. These sequences used two b factors, 50 and 800 s/mm2, TR 3900 ms, TE75 ms, matrix 156×192, average 6, 54-60 slices (27-30 for each b factor), slice thickness 6 mm with 20% interslice gap. For each DWI, corresponding ADC map was displayed after automatic calculation process in the MRI system.
Data Analysis
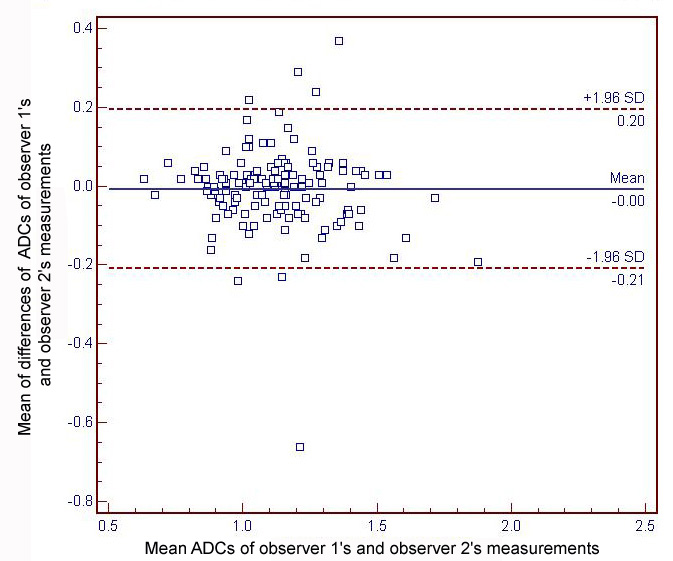
The relative contrast enhancement of each lesion was subjectively determined using a three-point scale (1, hypo-; 2, iso-; 3, hyper-) comparing to the background liver parenchyma on the arterial phase images during the dynamic imaging by two radiologists independently. For measurement of ADC in each lesion, two radiologists independently placed a largest region of interest (ROI) on the ADC map for the non-necrotic solid portion corresponding to the area of determining the contrast enhancement. Kappa statistics was performed for interobserver variability in determining the tumor vascularity, and Bland–Altman test was performed for the reproducibility of ADC measurement between the two observers. Student’s t-test was used to stratify the mean ADCs according to the histopathologic tumor grades or the degree of arterial enhancement. P values less than 0.05 were regarded as statistically significant.
Results
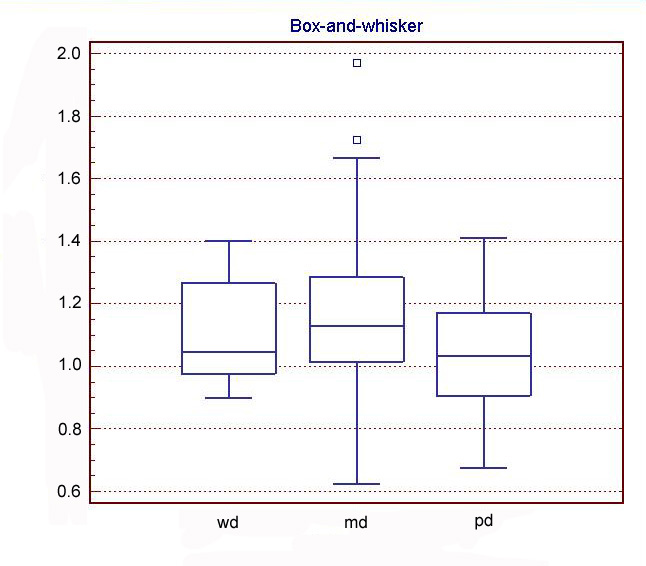
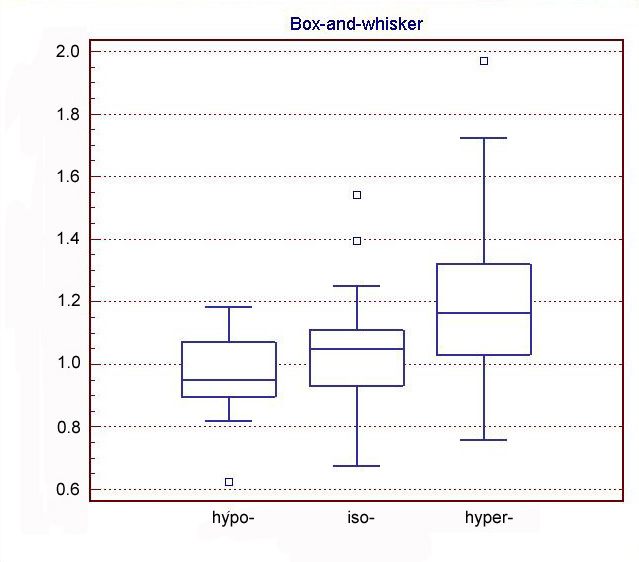
The mean absolute difference in ADC measurement between the two observers was 0.004 x 10⁻³mm2/s (limit of agreement, 0.20–0.66) (Fig. 1). Average ADC of moderately-differentiated HCCs (1.16±0.23×10⁻³mm2/s) was higher than well- (1.10±0.17×10⁻³mm2/s; P=0.295) or poorly-differentiated HCCs (1.04±0.16×10⁻³mm2/s; P=0.002) (Fig. 2); while there was no significant difference between those of well- and poorly-differentiated lesions (P=0.208). Linear-weighted kappa value in determining the tumor vascularity was 0.802 between two observers. For the mean degree of arterial phase enhancement determined by two observers, average ADC of hyper-enhancing lesions (1.20±0.21×10⁻³mm2/s) was significantly higher than hypo- (0.96±0.14×10⁻³mm2/s; P<0.001) and iso-enhancing lesions (1.04±0.16×10⁻³mm2/s; P<0.001) (Fig. 3).Conclusion
Depending on the results of present study, ADC values calculated on DWI could not reflect the histopathologic grades, and ADC alone cannot be used to predict the patients’ prognosis before the treatment. Meanwhile, subjectively determined the degree of arterial phase enhancement during the dynamic imaging showed rather positive relationship with the ADC values, and perfusion fraction might essentially influence the ADC of HCCs on current DWI of the liver.Acknowledgements
No acknowledgement found.References
1. Jonas S, Bechstein WO, Steinmuller T, et al. Vascular invasion and histopathologic grading determine outcome after liver transplantation for hepatocellular carcinoma in cirrhosis. Hepatology. 2001;33(5):1080-1086.
2. Haratake J, Takeda S, Kasai T, et al. Predictable factors for estimating prognosis of patients after resection of hepatocellular carcinoma. Cancer. 1993;72(4):1178-1183.
3. Tang Y, Wang H, Ma L, et al. Diffusion-weighted imaging of hepatocellular carcinomas: a retrospective analysis of correlation between apparent diffusion coefficients and histological grade. Abdom Radiol (NY). 2016;41(8):1539-1545.
4. Li X, Zhang K, Shi Y, et al. Correlations between the minimum and mean apparent diffusion coefficient values of hepatocellular carcinoma and tumor grade. J Magn Reson Imaging. May 06, 2016.
5. Nishie A, Tajima T, Asayama Y, et al. Diagnostic performance of apparent diffusion coefficient for predicting histological grade of hepatocellular carcinoma. Eur J Radiol. 2011;80(2):e29-33.
6. Guo W, Zhao S, Yang Y, et al. Histological grade of hepatocellular carcinoma predicted by quantitative diffusion-weighted imaging. Int J Clin Exp Med. 2015;8(3):4164-4169.
7. Nasu K, Kuroki Y, Tsukamoto T, et al. Diffusion-weighted imaging of surgically resected hepatocellular carcinoma: imaging characteristics and relationship among signal intensity, apparent diffusion coefficient, and histopathologic grade. AJR. 2009;193(2):438-444.
Figures