2014
Gadoxetic acid disodium-enhanced magnetic resonance imaging for staging of liver fibrosis: a meta-analysis1The First Hospital of Medical School, Xi’an Jiaotong University, Xi'an, People's Republic of China, 2The First Hospital of Medical School, Xi’an Jiaoto, Xi'an, People's Republic of China
Synopsis
To collect and summarize parameters used by gadoxetic acid-enhanced MR imaging (GD-EOB-DTPA-enhanced MRI) for staging of liver fibrosis (LF) and evaluate diagnostic performance. A systematic literature search was performed in PubMed, Web of science, Embase and Medline database. Studies used frequently-used parameter were included. Pooled weighted mean difference (WMD) was applied to determine the clinical significance. Pooled sensitivity, specificity, and summary receiver operating characteristics (SROC) curve were calculated to evaluate diagnostic performance. Finally, 5 studies were included, and contrast enhancement index (CEI) was the most frequently-used parameter, which was considered to be an efficient biomarker in the staging of LF.
Introduction
Early HF can be controlled by appropriate intervention and treatment, while the advanced LF can be difficult to reverse[1]. So early accurate diagnosis and staging of LF in patients with chronic hepatic disease is significant and necessary. However, the parameters used by gadoxetic acid disodium-enhanced magnetic resonance imaging (GD-EOB-DTPA-enhanced MRI) were various [2, 3], which limits its application. So we performed a meta-analysis to collect and summarize the parameters used by it and evaluate the diagnostic performance of the most frequently-used parameter.Methods
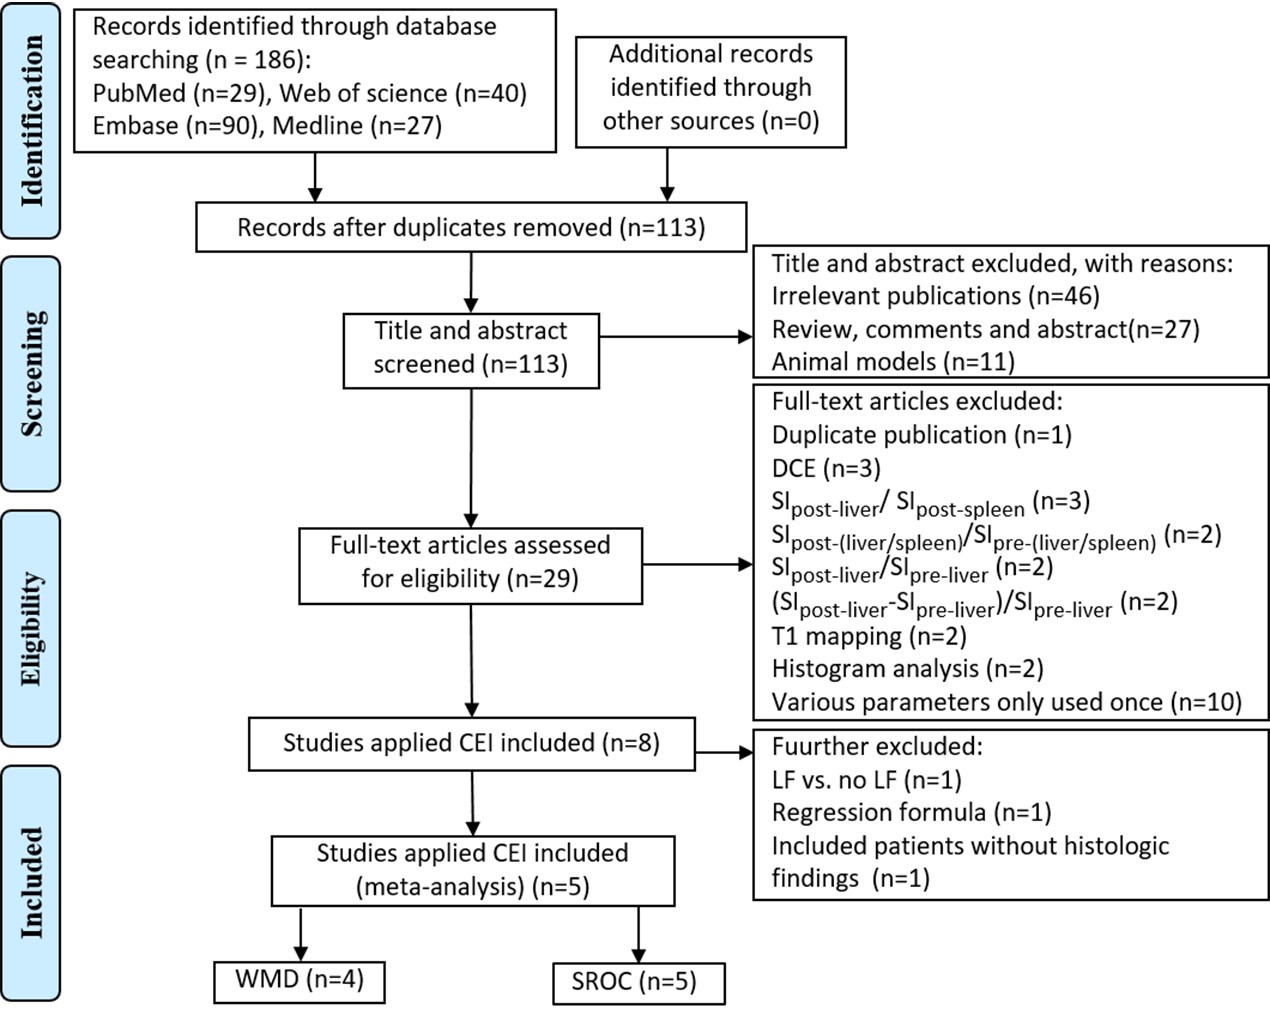
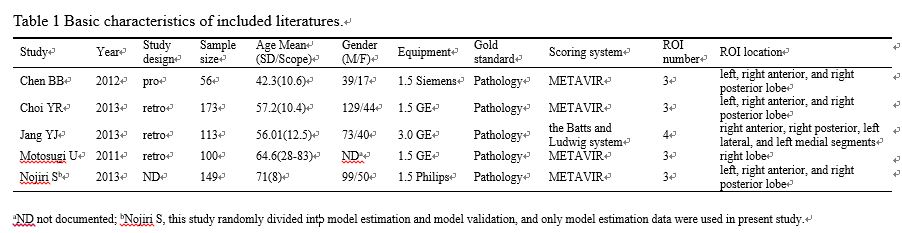
A systematic literature search was performed in PubMed, Web of science, Embase and Medline database from January 2004 to April 2016 to select studies reporting GD-EOB-DTPA-enhanced MRI and LF staging. Collecting and summarizing parameters applied by relevant literature, and the studies used the frequently-used one were included, the revised tool for the Quality Assessment of Diagnostic Accuracy Studies (QUADAS-2) was used to evaluate the quality of studies. Pooled weighted mean difference (WMD) was applied to determine the clinical significance of the frequently-used parameter for the staging of LF. Then pooled sensitivity, specificity, and summary receiver operating characteristics (SROC) curve were calculated to evaluate the diagnostic performance of GD-EOB-DTPA-enhanced MRI.Results
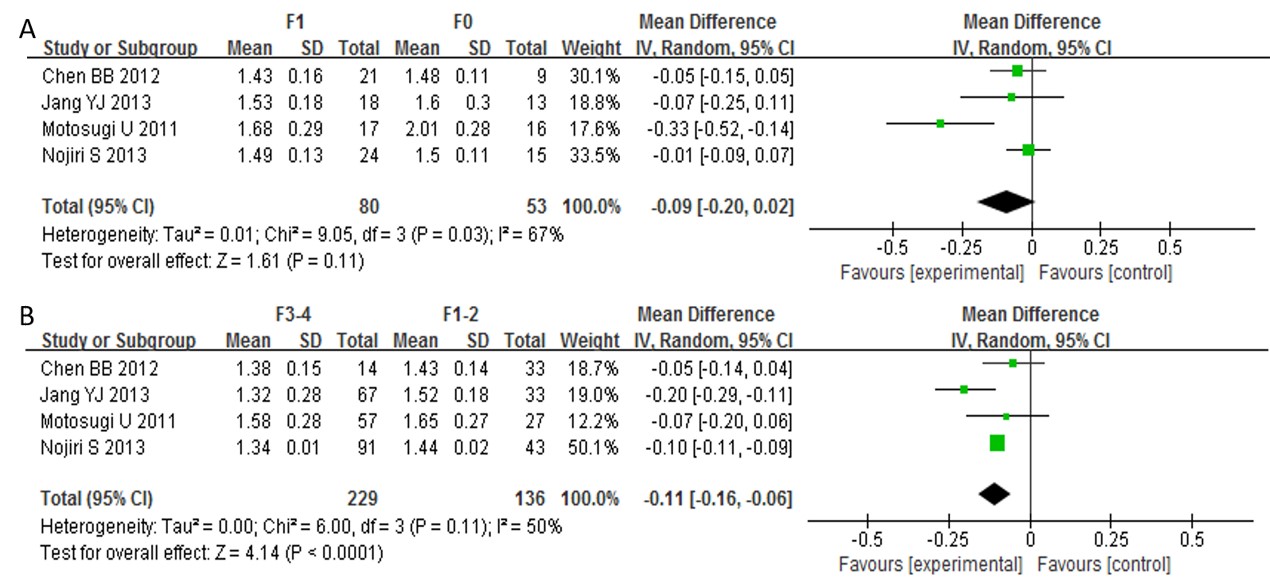
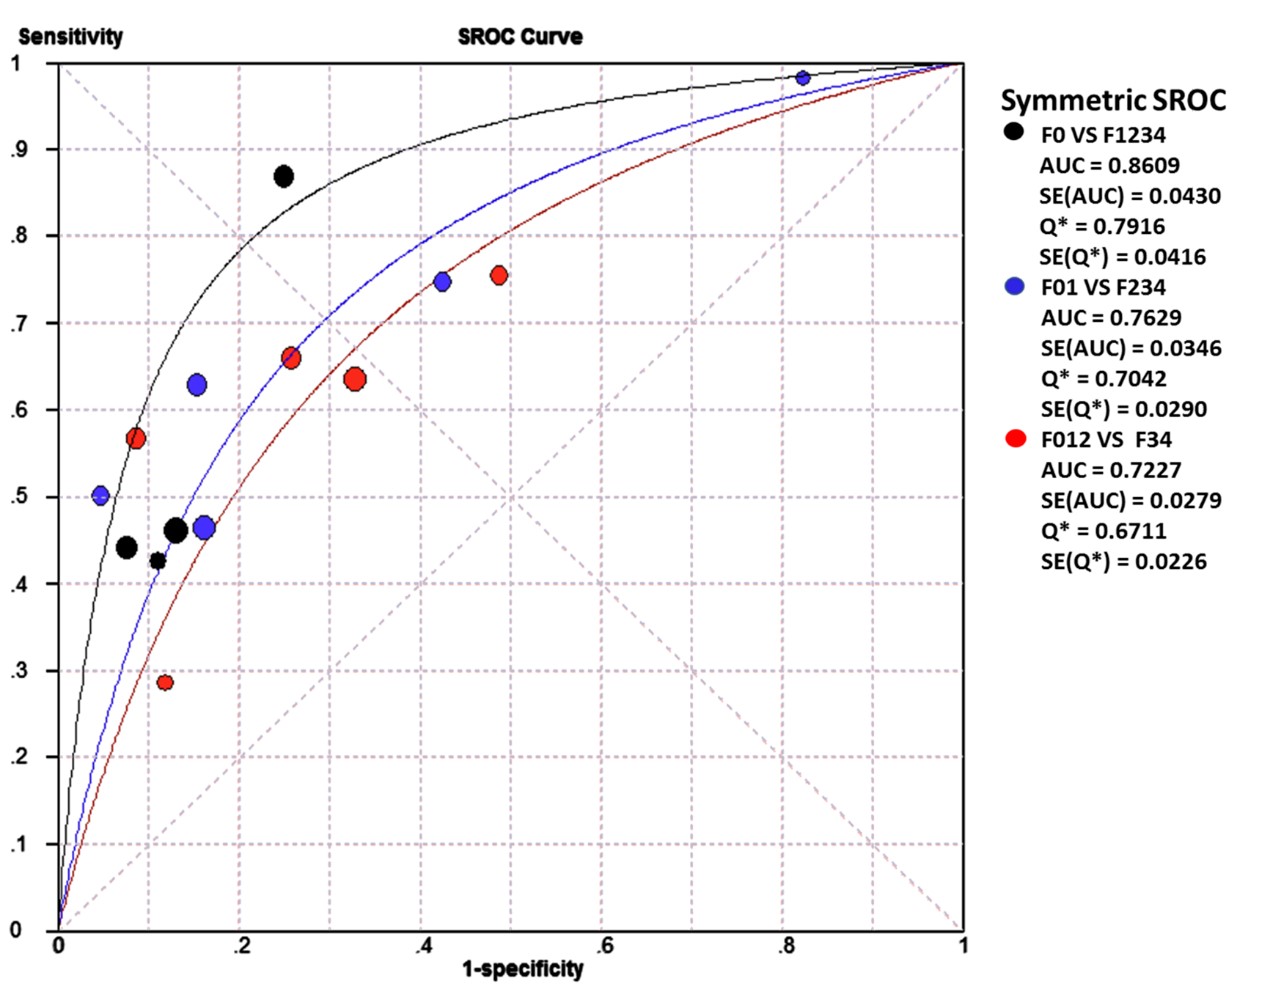
A systematic review of relevant researches shown contrast enhancement index (CEI) was the most frequently-used parameter. Finally, 5 studies were included in present research (WMD, n=4; SROC, n=5). The WMD revealed statistically significant differences between F12 and F34 (WMD -0.11, 95% CI -0.16– -0.06, P < 0.0001), but there was no statistically differences between F0 and F1 (WMD -0.09, 95% CI -0.20– 0.02, P = 0.11). For F0 vs. F1234, F01 vs. F234, and F012 vs. F34, the pooled sensitivity, specificity and AUC were 0.54 (95% CI 0.49-0.59), 0.85 (95% CI 0.74-0.98), and 0.8609; 0.59 (95% CI 0.54-0.64), 0.63 (95% CI 0.60-0.75), and 0.7629; 0.63 (95% CI 0.58-0.69), 0.74 (95% CI 0.68-0.79), and 0.7227 respectively.Discussion and Conclusion
A systematic review of relevant researches shown the parameter used for evaluating the staging of LF was multiple, which limited the application of GD-EOB-DTPA-enhanced MRI. The CEI was the most frequently-used parameter and had a good diagnostic performance in distinguishing fibrotic liver from normal liver, moderate LF from very early LF, and advanced LF from moderate LF. This may due to LF is associated with a progressive increase in the accumulation of extracellular matrix that may influence liver perfusion, vascular permeability, and extracellular diffusion, and the hepatocyte uptake of GD-EOB-DTPA [4]. The CEI with Gd-EOB-DTPA enhanced MRI was the most frequently-used parameter, and it was considered to be an efficient biomarker in the staging of LF.Acknowledgements
No acknowledgement found.References
1. Afdhal, N.H., Diagnosing fibrosis in hepatitis C: is the pendulum swinging from biopsy to blood tests? Hepatology, 2003. 37(5): p. 972-4.
2. Feier, D., et al., Liver Fibrosis: Histopathologic and Biochemical Influences on Diagnostic Efficacy of Hepatobiliary Contrast-enhanced MR Imaging in Staging. Radiology, 2013. 269(2): p. 459-467.
3. Motosugi, U., et al., Staging liver fibrosis by using liver-enhancement ratio of gadoxetic acid-enhanced MR imaging: comparison with aspartate aminotransferase-to-platelet ratio index. Magnetic Resonance Imaging, 2011. 29(8): p. 1047-1052.
4. Chen, C., et al., Initial study of biexponential model of intravoxel incoherent motion magnetic resonance imaging in evaluation of the liver fibrosis. Chin Med J (Engl), 2014. 127(17): p. 3082-7.
Figures