2012
Hepatic fat quantification using automated six-point Dixon methods: comparison with conventional chemical shift based gradient-echo sequences and computed tomography.1Diagnostic Radiology, Kumamoto University, Kumamoto, Japan
Synopsis
To compare automated six-point-Dixon(6-p-Dixon) with dual-echo GRE chemical shift imaging(CSI) for quantification of hepatic fat fraction(FF) with CT. In a phantom study, various FF vials were performed to validate the accuracy. In clinical study, fifty-nine patients were examined both 3.0T MRI and CT. Quantitative measurements were calculated SI-index of CSI and imaging-FF of 3D-6-p-Dixon. In phantom study, linear regression between FF and imaging-FF/SI-index showed good agreement(imaging-FF R2=0.992:0-100%FF;SI-index R2=0.978:0-34.7%FF). In clinical study, linear regression between imaging-FF and SI-index showed good agreement(R2=0.890). CT attenuation value was strongly correlated with imaging-FF(R2=0.852) and SI-index(R2=0.812). Imaging-FF of 6-p-Dixon has potential for automated hepatic fat quantification.
PURPOSE:
Among the magnetic resonance (MR) imaging methods to date, chemical shift-based multipoint water-fat separation methods have been most widely used, the two-point Dixon methods utilizing only magnitude data are insensitive to phase errors, but they are limited in water-fat ambiguity and lack of T2* relaxation correction.1, 2 Recently, a 3D T1-weighted gradient-echo (GRE) acquisition with six-point Dixon (6-p Dixon) is developed with automatically reconstruction of fat-only, water-only, % fat fraction (FF), R2* and T2*images at one breath-hold.3 The main idea behind this 6-p Dixon technique thereby is to have a fast liver classification method which can be used to quickly screen for hepatic iron overload or fatty liver disease. In some of the previous studies, a significant correlation between proton density fat fraction (PDFF) MR imaging and MRS determined hepatic fat fraction was observed.4-6 However in these previous studies, the reference technique for quantification of liver fat was MRS or biopsy, and the correlation of PDFF techniques with liver CT attenuation value was not well evaluated .7-10 The purpose of this study was to evaluate the automated 6-p Dixon fat quantification method screening for the detection of hepatic FF on a 3.0-T MR imaging. We compared this method with conventional dual-echo GRE chemical shift imaging (CSI) methods in a phantom validation study and in clinical study with CT as the reference technique.
METHODS:
MR protocol The liver 3.0T MR imaging protocol included the following sequences: 3D 6-p Dixon GRE (TR 120 ms; TE 1.1, 1.9, 2.7, 3.5, 4.3 and 5.1 ms, flip angle 3°) and 2D dual-echo CSI (TR 144 ms, TE 1.2/2.3 ms, flip angle 55°). In 6-p Dixon, the imaging FF (%) were used. In dual-echo GRE, the in-phase and opposed-phase signals (SII and SIO) were used to calculate the fat fraction as SI index = (SII – SIO)/SII x 100 (%). Lipid emulsion-based phantom study A phantom consisted of nine vials (0.0%, 14.7%, 24.0%, 34.7%, 57.3%, 66.7%, 74.7%, 80.7% and 100.0% of FF) study was performed to validate the accuracy of the MR imaging for fat fraction measurement. Quantitative measurements were calculated as SI index with dual-echo CSI and imaging FF of 6-p Dixon. Clinical Study Fifty-nine patients were examined both MR imaging and CT in the same day. Quantitative measurements were calculated as SI index with dual-echo CSI and imaging FF of 6-p Dixon in this study. Unenhanced CT was performed by using a 64-detector row helical CT. All 59 patients were compared quantitatively between dual-echo CSI and 6-p Dixon. Then, we compared quantitatively between CT attenuation value and SI index, imaging FF. We calculated the correlation using Pearson’s correlation analysis.RESULTS:
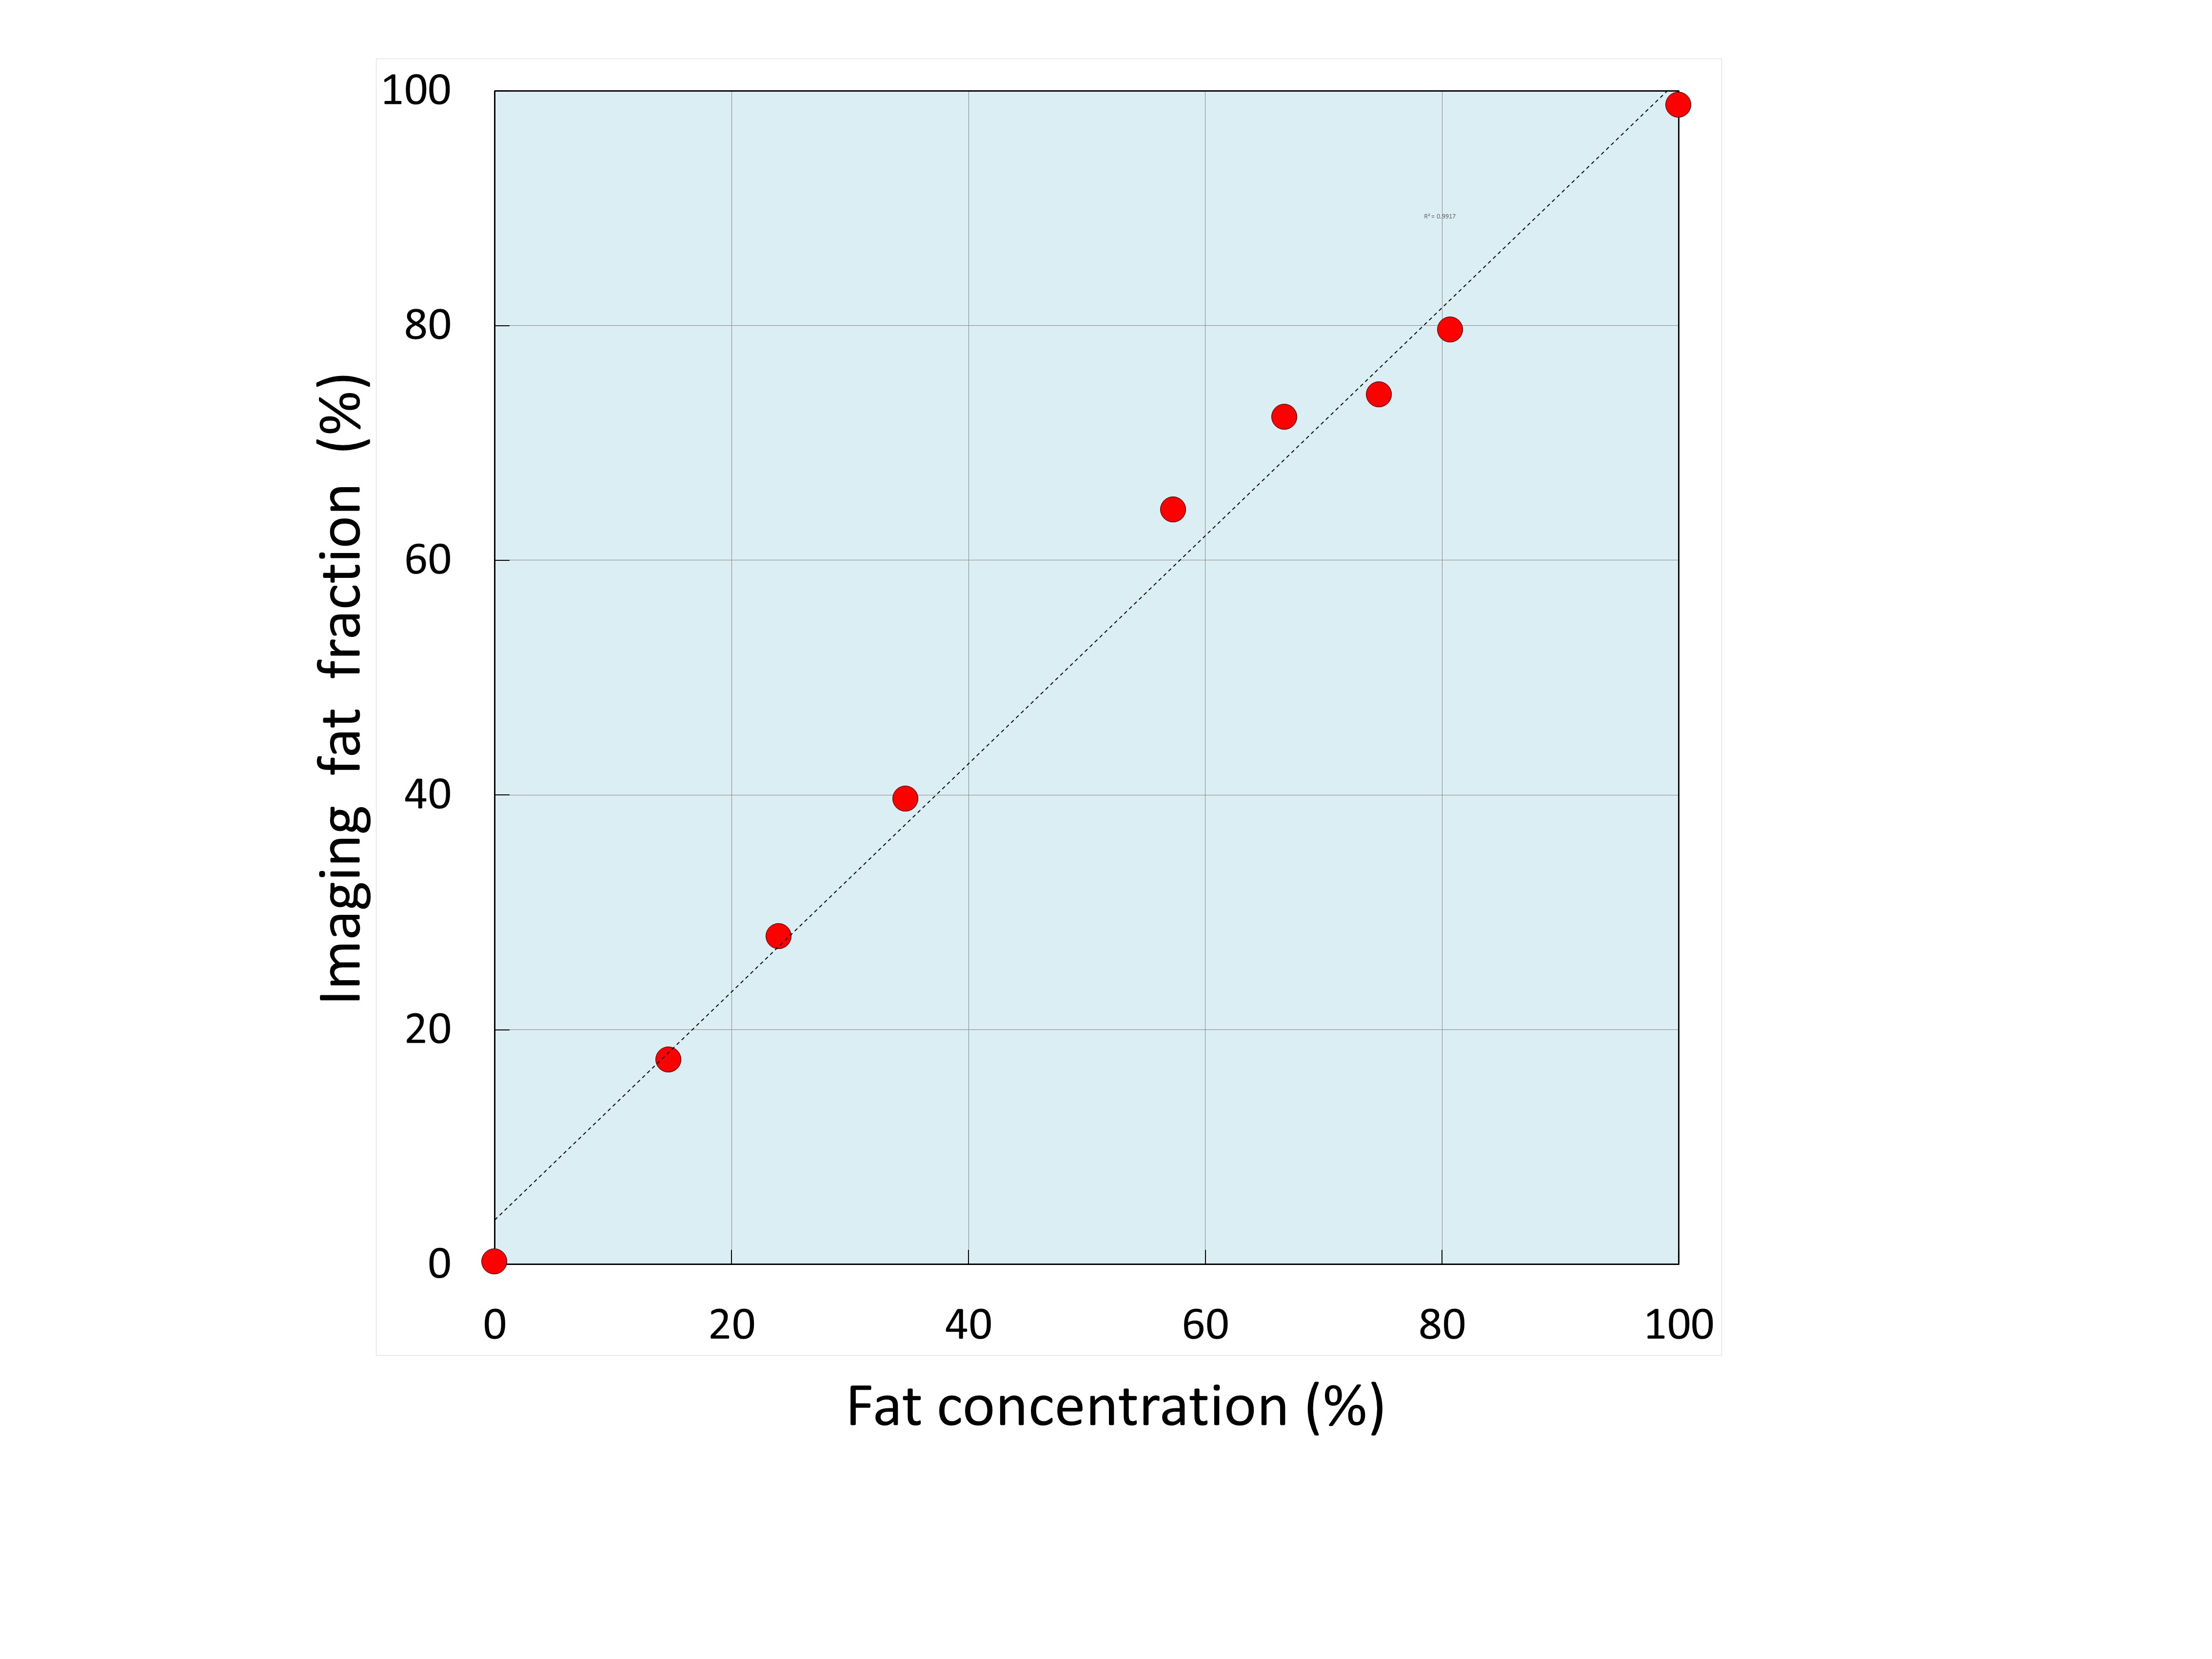
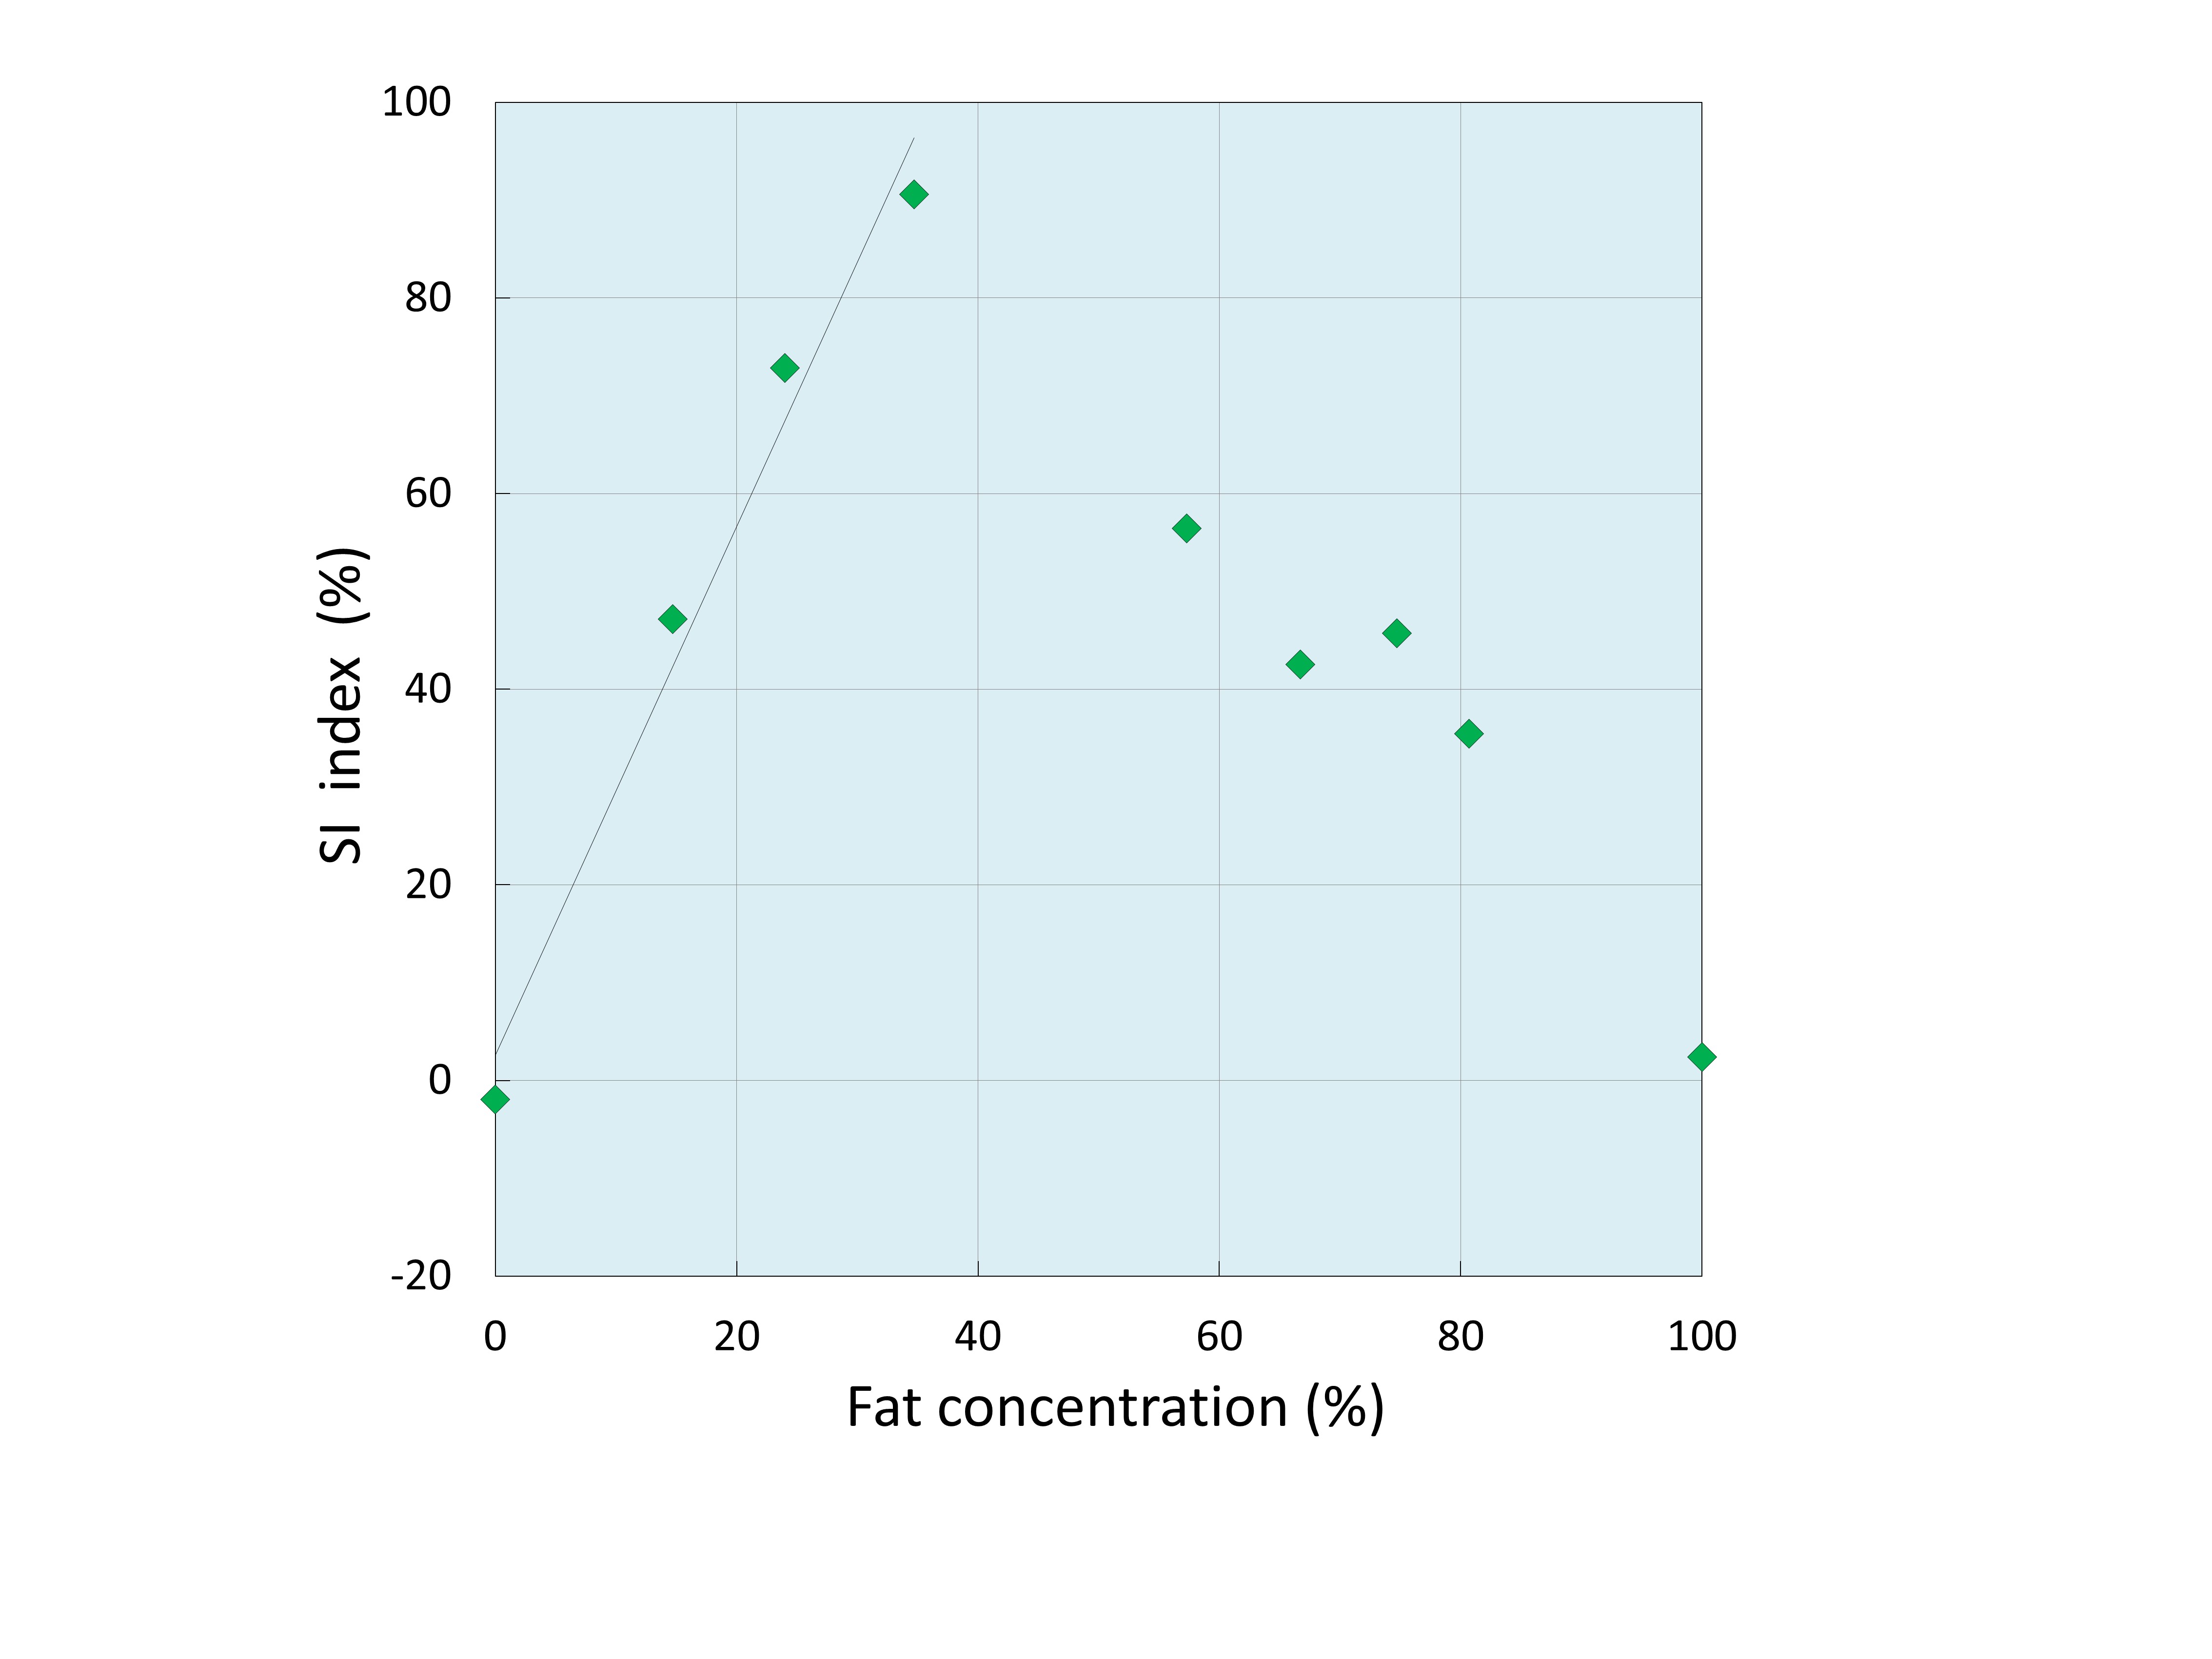
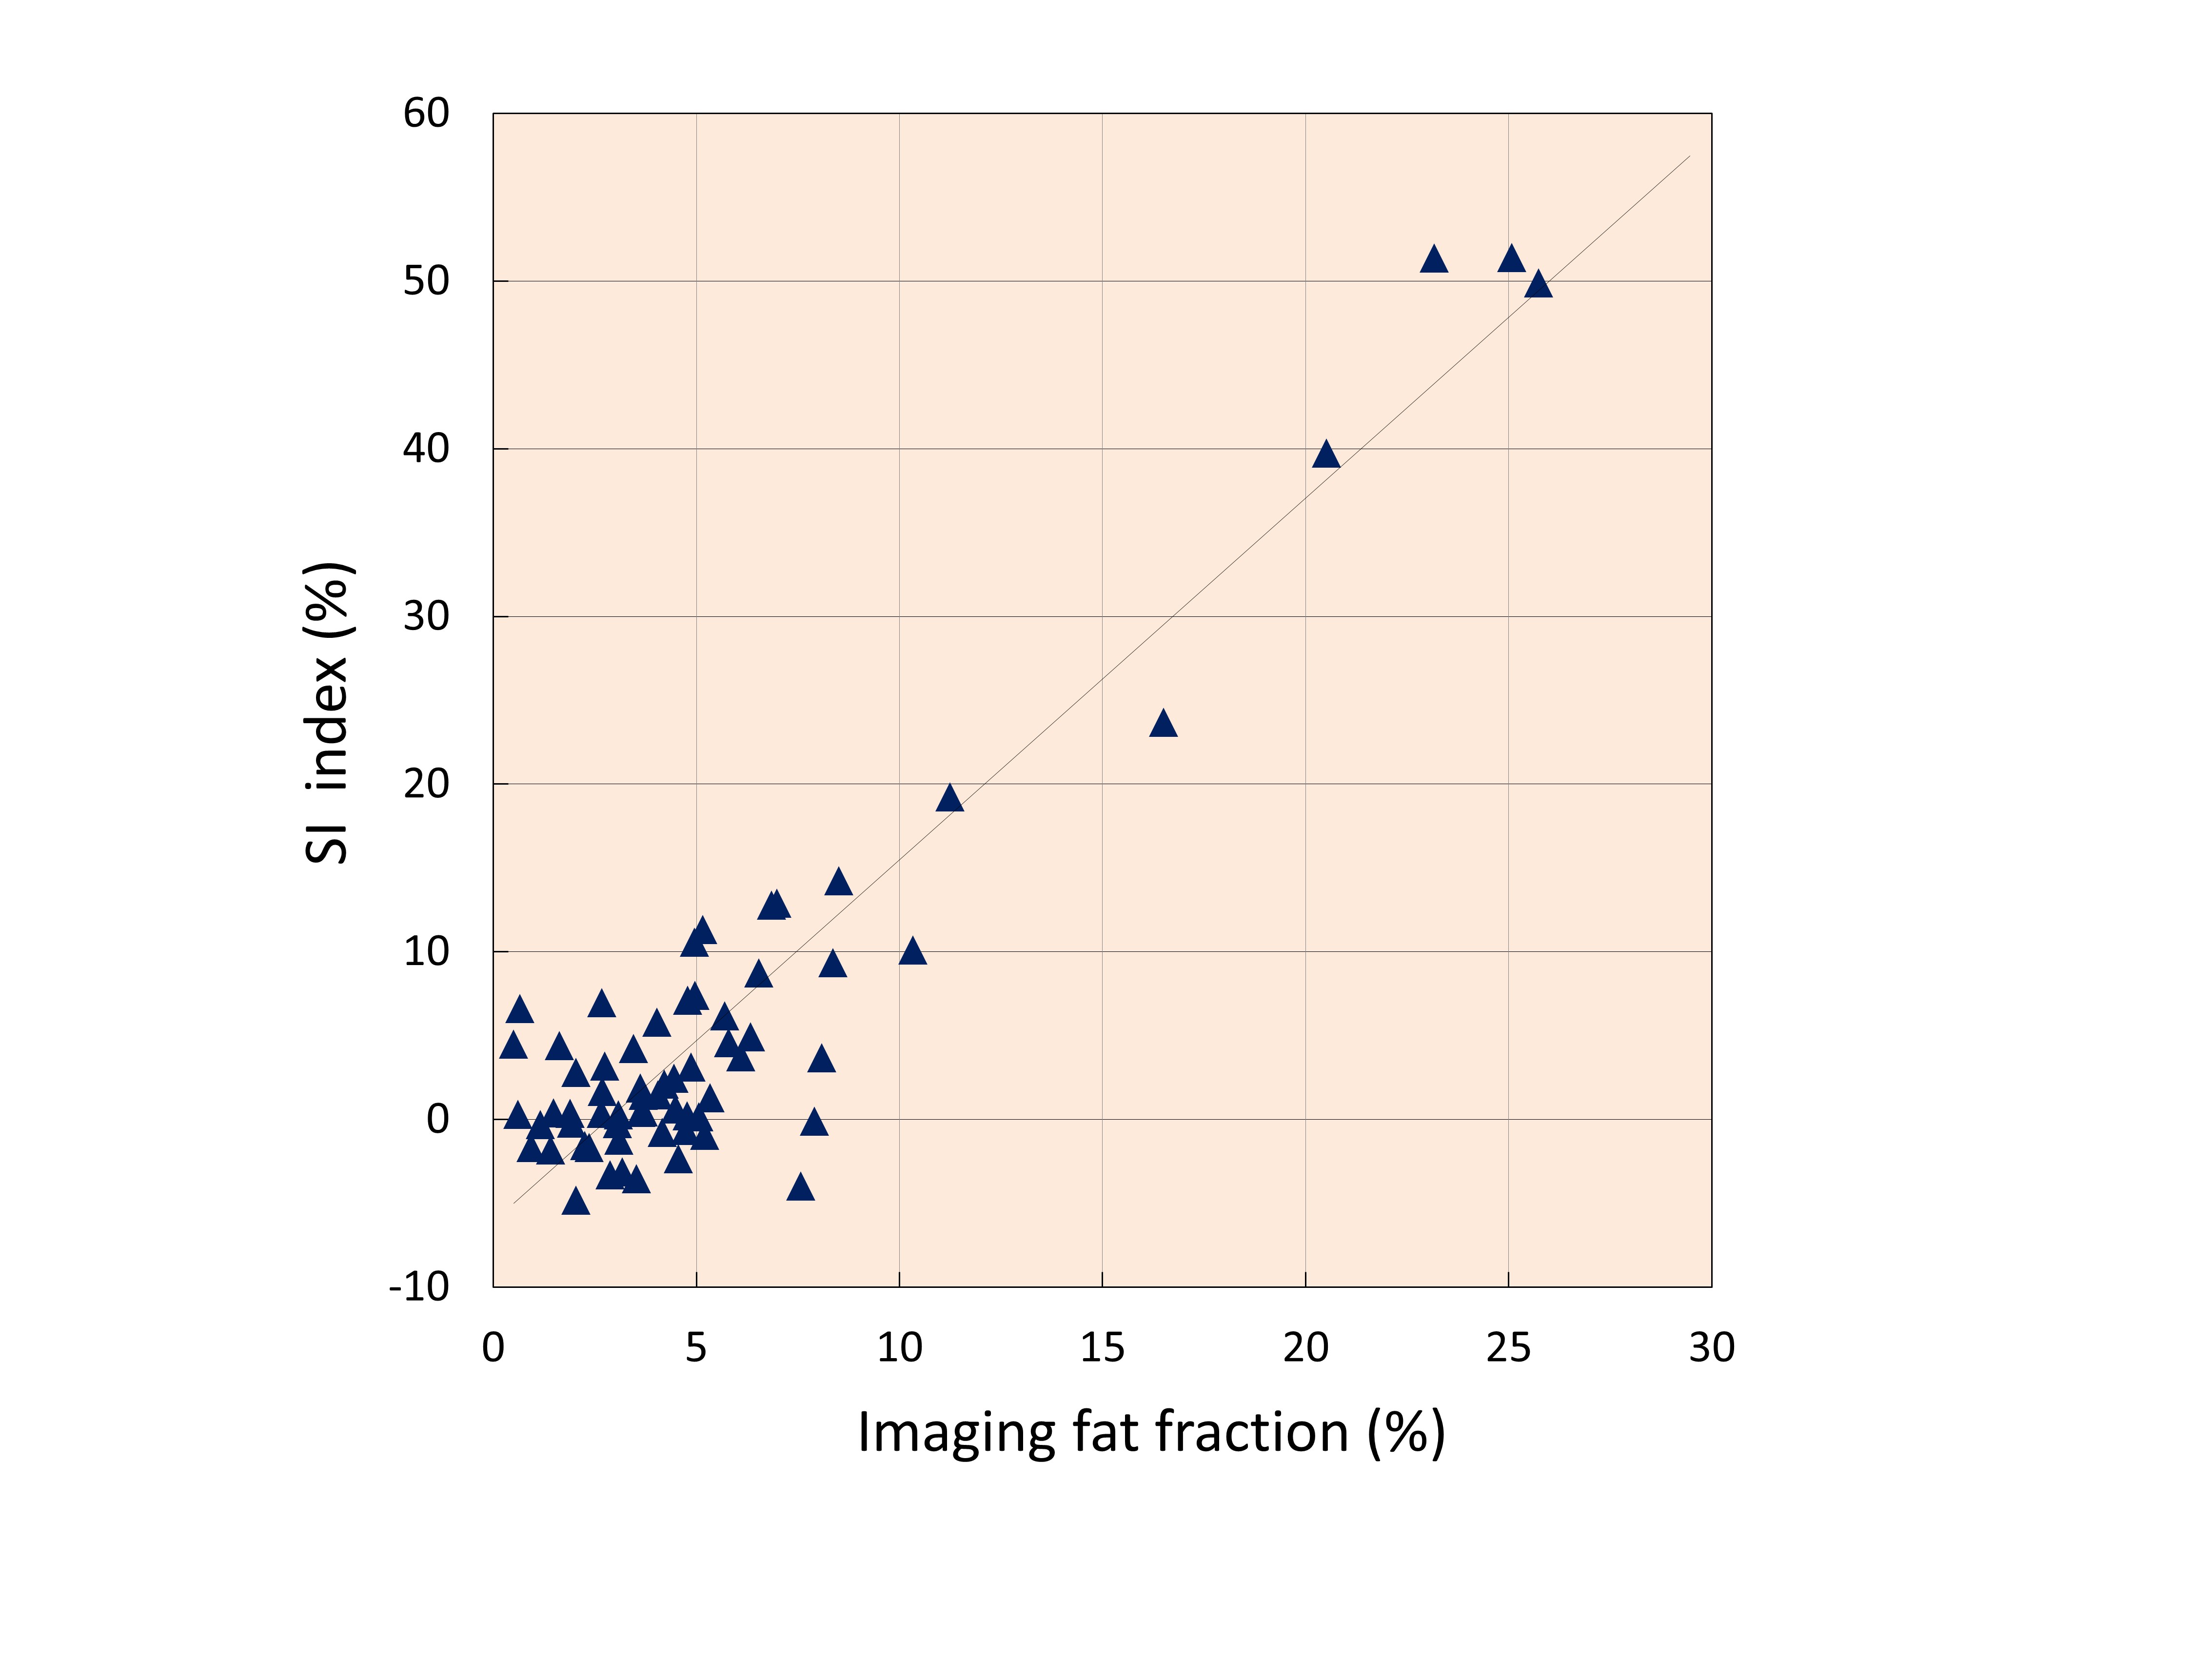
Phantom Study Linear regression from 0% to 100% FF between fat concentration and imaging FF measured by 6-p Dixon showed good agreement (R2=0.992) [Fig. 1]. The SI index measured by dual-echo CSI was strongly correlated with fat fraction (R2=0.978) from 0% to 34.7% FF [Fig. 2]. Clinical Study The SI index measured by dual-echo CSI was strongly correlated with that measured by imaging FF (R2=0.890) [Fig. 3]. CT attenuation value was strongly correlated with the calculated imaging FF on 6-p Dixon (R2=0.852) [Fig. 4] and SI index of dual-echo CSI (R2=0.812) [Fig. 5]. The imaging FF was slightly better correlation with CT attenuation value than SI index. However, there was no statistical significance between imaging FF and SI index.DISCUSSIONS:
Few articles evaluated both CT and MR within the same population.7-9 Furthermore, to our knowledge, the correlation of PDFF techniques with liver CT attenuation value was not evaluated. In the present study, we evaluated the efficiency dual-echo CSI and imaging FF of MR imaging and CT determined liver fat content in patients with liver disease. For quantification of hepatic steatosis, a close correlation was observed between CT attenuation value and imaging FF (R2=0.852)/ dual-echo CSI (R2=0.812). The results of the 6-p Dixon and dual-echo CSI sequence showed comparable results in the quantitative assessment of liver fat content. However, 6-p Dixon has the advantage of estimating FF across the entire biological dynamic range of 0-100% and offer a more comprehensive and direct approach for tissue FF estimation.CONCLUSION:
Imaging FF of automated 6-p Dixon method and SI index of dual-echo CSI were accurate correlation with CT attenuation value of liver parenchyma. No superiority between these two imaging methods was observed, but imaging FF of automated 6-p Dixon method has the potential for automated total liver fat quantification in straightforward.Acknowledgements
No acknowledgement found.References
1. Yokoo T, Bydder M, Hamilton G, et al. Nonalcoholic fatty liver disease: diagnostic and fat-grading accuracy of low-flip-angle multiecho gradient-recalled-echo MR imaging at 1.5 T. Radiology 2009;251:67-76.
2. Boll DT, Marin D, Redmon GM, Zink SI, Merkle EM. Pilot study assessing differentiation of steatosis hepatis, hepatic iron over- load, and combined disease using two-point dixon MRI at 3 T: in vitro and in vivo results of a 2D decomposition technique. Am J Roentgenol 2010 194:964-971
3. Deng J, Fishbein MH, Rigsby CK, Zhang G, Schoeneman SE, Donaldson JS. Quantitative MRI for hepatic fat fraction and T2* measurement in pediatric patients with non-alcoholic fatty liver disease. Pediatric radiology. 2014;44(11):1379-87.
4. Reeder SB, Cruite I, Hamilton G, Sirlin CB. Quantitative assessment of liver fat with magnetic resonance imaging and spectroscopy. J Magn Reson Imaging 2011;34:729-749.
5. Meisamy S, Hines CD, Hamilton G, et al. Quantification of hepatic steatosis with T1-independent, T2-corrected MR imaging with spectral modeling of fat: blinded comparison with MR spectroscopy. Radiology 2011;256:767-775.
6. Reeder SB, Cruite I, Hamilton G, Sirlin CB. Quantitative assessment of liver fat with magnetic resonance imaging and spectroscopy. J Magn Reson Imaging 2011;34(4):729-49.
7. Zhong L, Chen JJ, Chen J, et al. Nonalcoholic fatty liver disease: quantitative assessment of liver fat content by computed tomography, magnetic resonance imaging and proton magnetic resonance spectroscopy. Journal of digestive diseases. 2009;10(4):315-20.
8. Maruzzelli L, Parr AJ, Miraglia R, Tuzzolino F, Luca A. Quantification of hepatic steatosis: a comparison of computed tomography and magnetic resonance indices in candidates for living liver donation. Acad Radiol 2014;21(4):507-13.
9. Yoshimitsu K, Kuroda Y, Nakamuta M, et al. Noninvasive estimation of hepatic steatosis using plain CT vs. chemical-shift MR imaging: significance for living donors. J Magn Reson Imaging 2008; 28:678–684.
10. Schwenzer NF, Springer F, Schraml C, Stefan N, Machann J, Schick F. Non-invasive assessment and quantification of liver steatosis by ultrasound, computed tomography and magnetic resonance. Journal of hepatology. 2009;51(3):433-45.
Figures