2008
Liver T1rho Distribution across Eight Functionally Independent SegmentsWeibo Chen1, Xin Chen2, Li Yang3, Shanshan Wang2, Queenie Chan4, and Guangbin Wang2
1Philips Healthcare, Shanghai, People's Republic of China, 2Shandong Medical Imaging Research Institute Affiliated to Shandong University, Shandong University, Ji Nan, People's Republic of China, 3Department of Radiology, Shanghai Institute of Medical Imaging, Zhongshan Hospital, Fudan University, Shanghai, People's Republic of China, 4Philips Healthcare, Hong Kong, People's Republic of China
Synopsis
ROI-based analysis may suffer from sampling errors due to the user-defined placement of the ROI and the choice of slice location. The aim of our study was to find an approach that allow the detection and measurement of the T1rho values of the hepatic segments.
PURPOSE
Liver cirrhosis is an abnormal condition in which liver experiences irreversible scarring. Whole-liver T1rho MR imaging is feasible to detect and assess human liver cirrhosis [1]. T1rho values in the liver may be heterogeneous. ROI-based analysis may suffer from sampling errors due to the user-defined placement of the ROI and the choice of slice location. The aim of our study was to find an approach that allow the detection and measurement of the T1rho values of the hepatic segments.METHODS
MR Experiment Fifteen healthy volunteers (mean age 38 years. range 23–63 years, 7F/8M) without a history of liver diseases were recruited for the study conducted. The MRI experiment was conducted using a Philips 3.0T clinical scanner (Achieva TX, Best, the Netherlands). A 16-channel SENSE XL Torso coil was used for signal reception, using a 3D whole-liver coverage sequence. Pulse Sequence and Imaging Parameters The basic sequence consisted of a self-compensated spin-locking T1rho preparation pulse and was subsequently phase and frequency encoded for image acquisition using a standard alternating phase turbo field echo (TFE) acquisition. The principle of selective excitation technique was used for fat suppression. The other specific parameters for the whole-liver T1rho sequence were as our previous study [2]. Image Analysis ROI was positioned in each of the eight functionally independent segments divided according to Couinaud. T1rho of each segment were described as mean ± standard deviation (SD). Statistical Analysis in the reproducibility analysis, for each segment, as well as for the mean value, the variability between two different analyses was evaluated by calculating the inter-class correlation coefficient (ICC). One-way repeated measures analysis of variance (ANOVA) was used to evaluate whether there was a significant difference between T1rho values in different hepatic segments.RESULTS
An excellent ICC (0.937) was obtained. The mean hepatic T1rho of all the healthy volunteers is 40.46 ± 4.55ms. Each segment T1rho distribution was shown in figure 1. The ANOVA test showed no significant differences in the segmental T1rho value (P>0.05). Table 1 showed the percentage of deviation of the hepatic segments from the mean T1rho ranged from -4.55% (segment VI) to 3.04% (segment IV). Coefficient correlations, the correspondent P values were also shown in Table 1.DISCUSSION
Hepatic macro-molecules accumulation in the extracellular matrix can be heterogeneous across the liver [3]. The bias of T1rho across all hepatic segments should be studied for the further explore the heterogeneity of liver cirrhosis patients. No find of the segmental variability of the T1rho in our healthy volunteers study indicated that it might be potential bio-marker for the evaluation of heterogeneity deposition in liver cirrhosis patients.CONCLUSION
In conclusion, there is no significant segmental variability of the hepatic T1rho across eight functionally independent segments.Acknowledgements
References
1. Allkemper T, Sagmeister F, Cicinnati V, et al. Evaluation of fibrotic liver disease with whole-liver T1rho MR imaging: a feasibility study at 1.5 T. Radiology 2014;271(2):408-415.
2. Proc. Intl. Soc. Mag. Reson. Med. 23, 124 (2015)
3. Faria, Silvana C., et al. "MR Imaging of Liver Fibrosis: Current State of the Art 1." Radiographics 29.6 (2009): 1615-1635.
Figures
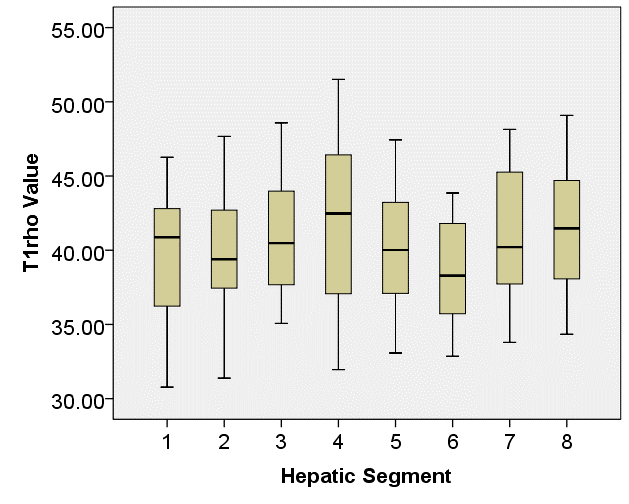
Figure
1. Segmental T1rho distribution across all the eight functionally independent
segments. Each box shows the median (black line), quartiles, and extreme values
within a segment. No significant differences was found in segmental T1rho
values.
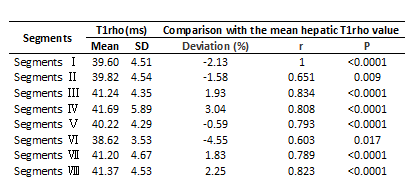
Table 1.
Mean T1rho values in the ROIs defined in each hepatic segment of all volunteers
and their correlation between the mean hepatic T1rho value.