2006
Inter- and intra-reviewer agreement of region-of-interest-based quantification of liver R2* in patients with iron overload1Radiology, University of Wisconsin-Madison, Madison, WI, United States, 2Medical Physics, University of Wisconsin-Madison, Madison, WI, United States, 3Biomedical Engineering, University of Wisconsin-Madison, Madison, WI, United States, 4Medicine, University of Wisconsin-Madison, Madison, WI, United States, 5Emergency Medicine, University of Wisconsin-Madison, Madison, WI, United States
Synopsis
This study evaluated the inter- and intra-reviewer agreement of different region-of-interest (ROI) sampling methods for the quantification of liver R2* (1/T2*) in patients with iron overload. 37 MRI datasets from patients suspected of having liver iron overload were retrospectively analyzed using ROI sampling methods that have been previously reported. Our results demonstrate that the inter- and intra-reviewer agreement of liver R2* quantification improve when using ROIs that are large in size and number. We conclude that researchers and clinicians should strive to sample as much area of the liver by using multiple large ROIs.
Introduction
Emerging MRI-based R2* (1/T2*) quantification in the liver has shown great promise as a quantitative imaging biomarker for the non-invasive detection, quantitative staging, and treatment monitoring of liver iron overload1. These techniques allow for the non-invasive assessment of diseases that result in liver iron overload, including hereditary hemochromatosis2 and blood transfusion-dependent conditions such as thalassemia2–4, sickle cell disease3,4, and bone marrow failure4.
Typically, these measurements are made from R2* maps by drawing regions-of-interest (ROIs) to obtain quantitative estimates of liver iron content2. Despite the growing clinical and research interest in these techniques, a standardized approach for ROI-based liver R2* quantification has not been established. Recent studies have evaluated the inter-reviewer agreement of ROI-based R2* quantification in the liver5,6. However, evaluation of both inter- and intra-reviewer agreement of the wide range of ROI sampling methods in the literature2,5–7 is still needed in patients with liver iron overload. Therefore, the purpose of this study was to evaluate the inter- and intra-reviewer agreement of different combinations of ROI size, location, and number for liver R2* quantification in patients with iron overload.
Methods
37 patient liver MRI datasets were retrospectively analyzed for R2* using ROI sampling methods that have been previously reported2,5–7. All datasets were collected as part of IRB-approved protocols and are HIPAA-compliant. The patients (mean [range] age of 43.6 [10–78] years; 24M/13F) were suspected of having liver iron overload.
All imaging was performed at 1.5T (Signa HDxt or Optima MR 450w, GE Healthcare, Waukesha, WI) using an 8- or 12-channel phased array cardiac or torso coil. Imaging parameters included: TR=13.5–3.7ms, TE1=1.2–1.3ms, ΔTE=1.98–2.0ms, echoes=6, FOV=35x35–44x44cm, slice thickness=8–10mm, slices=24–32, receiver bandwidth=±83–125kHz.
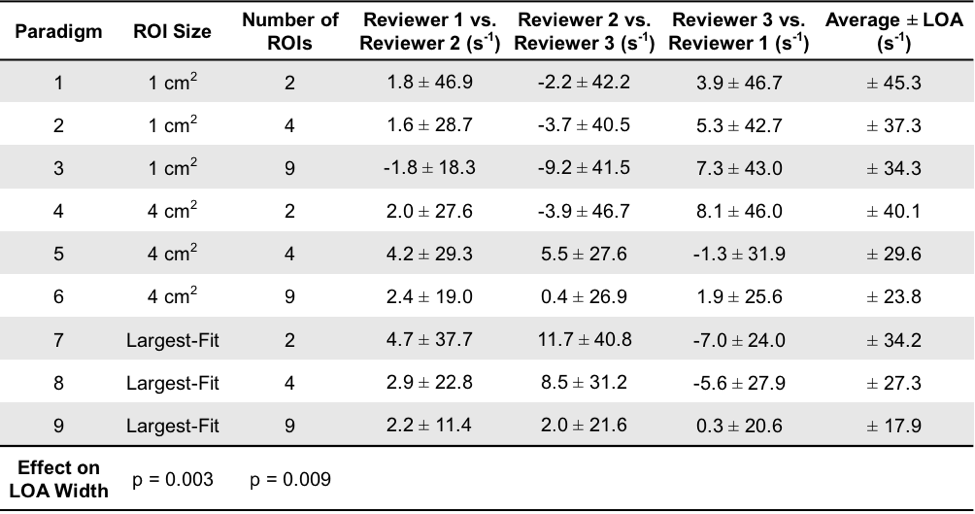
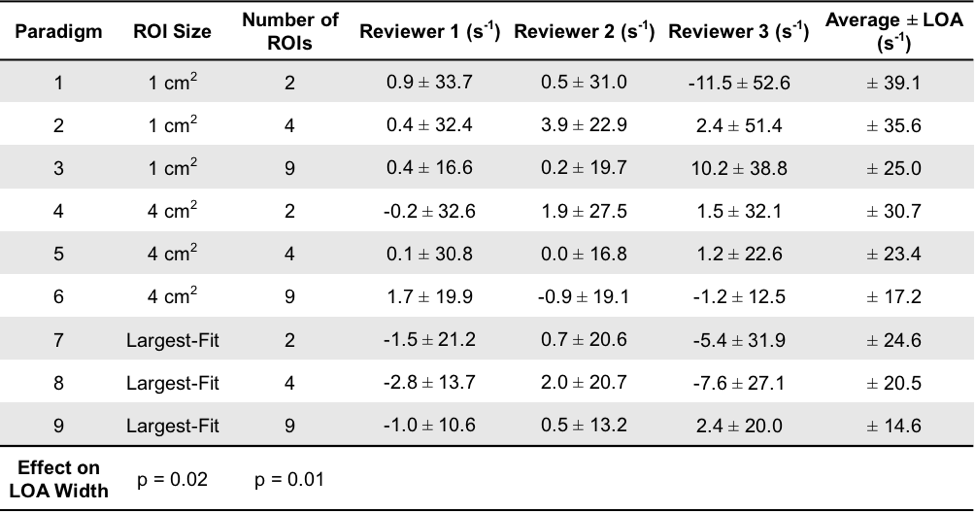
Three reviewers analyzed R2* maps using nine circular ROI sampling paradigms that each used different combinations of ROI size, location, and number. ROI sizes included: 1) 1 cm2, 2) 4 cm2, and 3) the largest area that fit inside each placement designation, while avoiding large vessels, bile ducts, and obvious image artifacts. ROI locations included: 1) left and right liver lobes, 2) anterior, posterior, medial, and lateral segments of the liver, and 3) nine Couinaud segments of the liver. The number of ROIs included: 1) two ROIs (one per left and right liver lobe), 2) four ROIs (one per anterior, posterior, medial, and lateral segment), and 3) nine ROIs (one per Couinaud segment). Table 1 summarizes these paradigms.
For each paradigm, inter- and intra-reviewer agreement for all three reviewers was assessed using Bland-Altman analysis.
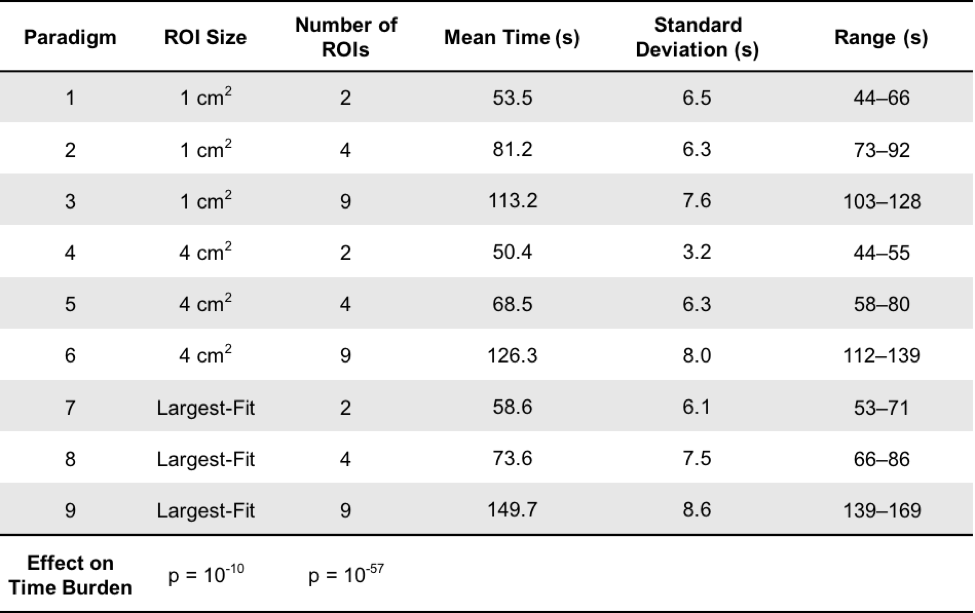
Finally, the time required for one reviewer to perform each paradigm was recorded.
Results
All 37 patients were included in our analysis. R2* measurements (s-1) had a mean ± SD [range] of 230.5±155.5[16.8–704.6]. Our analysis demonstrates that averaging largest-fit ROIs over each of the nine Couinaud segments (Paradigm 9) results in the narrowest limits of agreement (LOA) for inter- and intra-reviewer agreement for all three reviewers. The three Bland-Altman analyses of inter-reviewer agreement using Paradigm 9 had a mean difference ± LOA (s-1) of 2.2±11.4, 2.0±21.6, and 0.3±20.6 (Table 2). The three analyses of intra-reviewer agreement using Paradigm 9 had a mean difference ± LOA (s-1) of -1.0±10.6, 0.5±13.2, and 2.4±20.0 (Table 3). These results indicate a trend that the inter- and intra-reviewer agreement of R2* quantification in the liver improves as the size and number of ROIs increases.
Finally, our analysis also shows that increasing the size and number of ROIs increases the time burden on the reviewer to perform R2* measurements (Table 4).
Discussion and Conclusions
This study evaluated the inter- and intra-reviewer agreement of different ROI sampling methods for the quantification of liver R2* in patients with iron overload. Our results demonstrate that increasing the liver sampling area, by using multiple large ROIs, improves inter- and intra-reviewer agreement of R2* in the liver. Our results also show that the time burden to perform R2* measurements increases as the size and number of ROIs increases. Depending on the specific application and requirements of a study, Paradigms 5 and 8 may provide a good compromise between time burden and inter- and intra-reviewer agreement. To conclude, our study demonstrates improved inter- and intra-reviewer agreement of liver R2* quantification in patients with iron overload when using ROIs that are large in size and number. Therefore, clinicians and researchers performing ROI-based measurements of liver R2* in patients with iron overload should strive to sample as much area of the liver as possible by using multiple large ROIs.Acknowledgements
The authors wish to acknowledge support from the Wisconsin Alumni Research Foundation Accelerator Program, and the NIH (R01DK083380, R01DK088925, K24DK102595, R01DK100651, UL1TR00427, UL1RR025011). We also wish to acknowledge GE Healthcare, who provides research support to the University of Wisconsin.References
1) Wood JC. Diagnosis and management of transfusion iron overload: The role of imaging. Am J Hematol 2007; 82(12): 1132–1135.
2) Gianesin B, Zefiro D, Musso M, et al. Measurement of liver iron overload: Noninvasive calibration of MRI-R2* by magnetic iron detector susceptometer. Magn Reson Med 2012; 67(6): 1782–1786.
3) Wood JC, Enriquez C, Ghugre N, et al. MRI R2 and R2* mapping accurately estimates hepatic iron concentration in transfusion-dependent thalassemia and sickle cell disease patients. Blood 2005; 106(4): 1460–1465.
4) Hankins JS, McCarville MB, Loeffler RB, et al. R2* magnetic resonance imaging of the liver in patients with iron overload. Blood 2009; 113(20): 4853–4855.
5) McCarville MB, Hillenbrand CM, Loeffler RB, et al. Comparison of whole liver and small region-of-interest measurements of MRI liver R2* in children with iron overload. Pediatr Radiol 2010; 40(8): 1360–1367.
6) Sofue K, Mileto A, Dale BM, Zhong X, Bashir MR. Interexamination repeatability and spatial heterogeneity of liver iron and fat quantification using MRI-based multistep adaptive fitting algorithm. J Magn Reson Imaging 2015; 42(5): 1281–1290.
7) Hernando D, Wells SA, Vigen KK, Reeder SB. Effect of hepatocyte-specific gadolinium-based contrast agents on hepatic fat-fraction and R2*. Magn Reson Imaging 2015; 33(1): 43–50.
Figures