2003
Quantitative Assessment of Hepatic function with Hepatocyte Fraction1Department of Medical Imaging Center, Nanfang Hospital, Southern Medical University, Guangzhou, People's Republic of China, 2Guangdong Provincial Key Laboratory of Medical Image Processing,School of Biomedical Engineering,Southern Medical University, Guangzhou, People's Republic of China, 3Philips Healthcare, Guangzhou, China., 4MR Clinical Science, Philips Healthtech, Tokyo, Japan, 5MR Clinical Science, Philips Healthcare, Seoul, Korea
Synopsis
Gadoxetic acid has been shown to evaluate liver function as it is known to be actively taken up by hepatocytes via organic anion transporters (OATPs). The measurement of hepatic parenchymal enhancement during the hepatobiliary phase (HBP) may accurately reflect liver function. This study evaluated the liver function of the subject in the Child-Pugh classification method which is still the most commonly applied method for evaluating liver function in clinical. The hepatocyte fractions were significantly different among groups classified according to Child–Pugh scores between A and C, B and C. The hepatocyte fraction could be considered as a promising method for the quantitative assessment of liver function.
Abstract
Introduction Gadoxetic acid, a hepatocyte-specific magnetic resonance (MR) contrast agent, has been shown to evaluate liver function as it is known to be actively taken up by hepatocytes via organic anion transporters (OATPs). The measurement of hepatic parenchymal enhancement during the hepatobiliary phase (HBP) may accurately reflect liver function[1]. Most of these studies used the measurement of liver-spleen contrast ratio[2], T1 relaxation times of the liver parenchyma[3], the volume of the liver[4], and calculation of changes between the pre and post-contrast T1 value[5, 6] as markers. Therefore, The purpose of this study is to assess quantification of the hepatocyte fraction based on simple pharmacokinetics[8] using Gd-EOB-DTPA evaluate liver function. This study evaluated the liver function of the subject in the Child-Pugh classification method which is still the most commonly applied method for evaluating liver function in clinical.Material & Methods
The severity of liver cirrhosis was classified according to the Child Pugh Score and thus, twelve patients were subdivided into Child–Pugh class A (n = 6), B (n = 2) and C (n = 4), respectively. The patients were enrolled in our study according to the diagnosis of cirrhosis with hepatitis B was based on laboratory investigations, physical findings, laboratory investigations, imaging findings and histopathological findings. The patients with numerous focal liver lesions (FLLs) which may hinder liver parenchymal evaluation were excluded.
All the patients were scanned with a 3T clinical scanner (Achieva TX, Philips, the Netherlands). Lock-Locker sequence was performed pre and 15-20 minutes post-contrast administration with following imaging parameters: 19 inversion delay time points from 78ms to 2200ms, TE/TR=2/7ms, FOV = 350x250mm2, acquired matrix = 100x110, FA=7, single-slice, SENSE factor=2 and scan duration =20 sec with breath holding. T1 maps and subsequent hepatocyte fraction map were calculated with the model proposed by Okuaki.
ROIs were placed by radiologist who was blind to the Child-Pugh (CP) scores and endoscopy findings in three different regions of the left lobe and the right lobe of the liver parenchyma, respectively. FLLs and major branches of the hepatic vessels were carefully avoided. The mean values of the left lobe and the right lobe were calculated as the hepatocyte fraction of the liver. Statistics analysis: The hepatocyte fraction values of Child–Pugh class A,B and C patients were compared statistically using the one-way ANOVA. p-value < 0.05 was considered significant.
Results
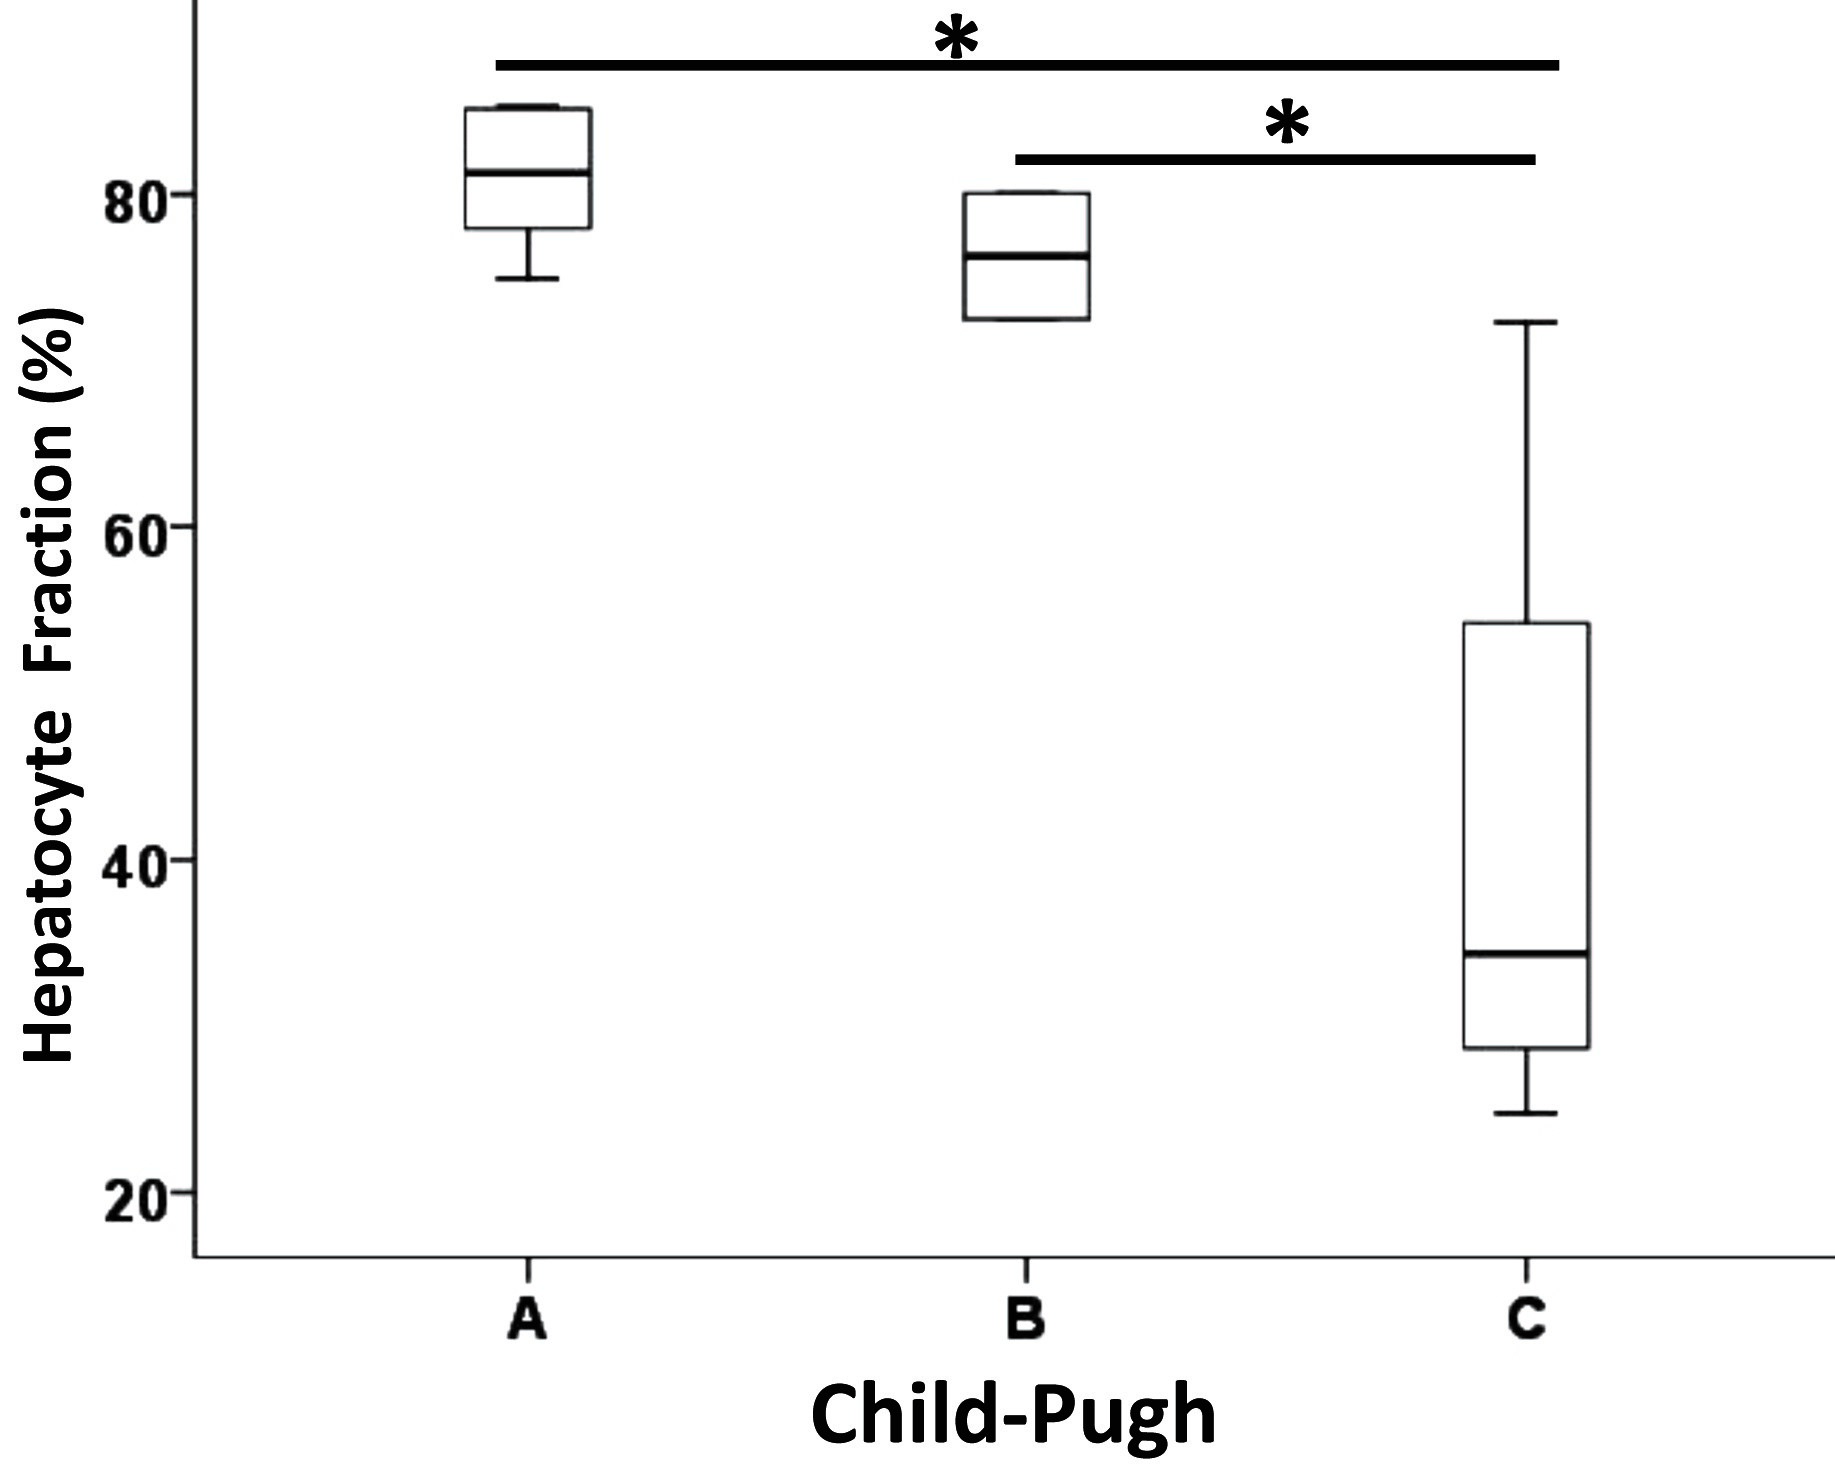
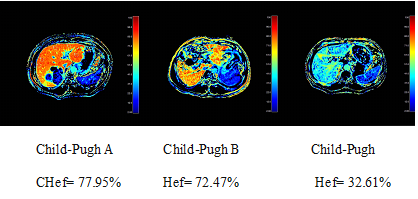
The mean values of hepatocyte fraction of Child–Pugh class A,B and C were(80.95±4.08)%, (76.25±5.34)%, (41.45±21.09)% respectively. The hepatocyte fractions were significantly different among groups classified according to Child–Pugh scores between A and C, B and C (One-way ANOVA, p value < 0.01)(Fig.1).The hepatocyte fraction decreased with deteriorated liver function (Fig.2).Disscusion and Conclusion
The results of our study demonstrated the feasibility of quantification of the liver function with hepatocyte fraction calculated using the T1 values pre and post- Gd-EOB-DTPA administration. The hepatocyte fraction method reflected the intracellular signal change and hepatocyte uptake function, because the blood and extracellular extravascular space (EES) signal were normalized by the measurement of the ΔR1 in the spleen. On the other hand, the hepatocyte fraction was not affected by the vascularity, instead, It was based on simple pharmacokinetics and hepatic cellular uptake. Showing its utility in the differentiation or classification of liver lesions. Therefore, the hepatocyte fraction could be considered as a promising method for the Quantitative assessment of liver function.Acknowledgements
No acknowledgement found.References
1.Yoon, J.H., et al., Quantitative assessment of hepatic function: modified look-locker inversion recovery (MOLLI) sequence for T1 mapping on Gd-EOB-DTPA-enhanced liver MR imaging. European Radiology, 2015. 26(6): p. 1775-1782.
2.Motosugi, U., et al., Liver parenchymal enhancement of hepatocyte-phase images in Gd-EOB-DTPA-enhanced MR imaging: Which biological markers of the liver function affect the enhancement? Journal of Magnetic Resonance Imaging, 2009. 30(5): p. 1042-1046.
3. Heye, T., et al., MR relaxometry of the liver: significant elevation of T1 relaxation time in patients with liver cirrhosis. European Radiology, 2012. 22(6): p. 1224-1232.
4. Yoneyama, T., et al., Efficacy of liver parenchymal enhancement and liver volume to standard liver volume ratio on Gd-EOB-DTPA-enhanced MRI for estimation of liver function. European Radiology, 2013. 24(4): p. 857-865.
5. Kamimura, K., et al., Quantitative evaluation of liver function with T1 relaxation time index on Gd-EOB-DTPA-enhanced MRI: Comparison with signal intensity-based indices. Journal of Magnetic Resonance Imaging, 2014. 40(4): p. 884-889.
6. Katsube T, Okada M.Estimation of Liver Function Using T1 Mapping on Gd-EOB-DTPA-Enhanced Magnetic Resonance Imaging.pdf. Invest Radiol, 2011, 46(4):277-283.
7. Dahlqvist Leinhard, O., et al., Quantifying differences in hepatic uptake of the liver specific contrast agents Gd-EOB-DTPA and Gd-BOPTA: a pilot study. European Radiology, 2011. 22(3): p. 642-653.
8. T. Okuaki et al. ISMRM, 2015 proc.
9. T. Okuaki et al. ISMRM, 2016 proc.
Figures