2002
Quantitative T1 and T2 measurements of pancreas at 7 Tesla using a multi-transmit system1Radiology, Leiden University Medical Center, Leiden, Netherlands, 2Imaging Division, University Medical Center Utrecht, Utrecht, Netherlands, 3Radiology, University Medical Center Utrecht, Utrecht, Netherlands
Synopsis
Inversion recovery and echo time series were obtained at 7T with a multi-transmit system to determine the T1 and T2 relaxation times of the healthy pancreas. These parameters are crucial when optimizing MR protocols. The T1 and T2 values found were in average 921+/-98 ms and 57+/-12 ms respectively. Excellent T2 contrast is obtained for the pancreas at TE/TR=80ms/17s.
Introduction
The overall quality of MR images of the pancreas is dependent on many factors including signal-to-noise ratio (SNR), contrast-to-noise ratio (CNR), spatial resolution, and artifact level. At higher magnetic field strengths higher SNR, CNR, and resolution or shorter imaging times can be reached, yet artifact levels can be substantial particularly in abdomen. Currently in the clinic, 3T MR is used by physicians to evaluate, help diagnose, or monitor treatment of pancreatic tumors. More accurate and efficient imaging for earlier pancreatic tumor detection and characterization and improvement of cancer treatment is still needed. The advantages of 7T could be exploited to this end. In addition, the change in relaxation times at 7T might also contribute to enhance the contrast between normal and diseased tissue. Optimization of body, particularly pancreas, imaging protocols at 7T requires knowing these tissue relaxation parameters. Relaxation times (T1 and T2) values have been well established for many tissues, including pancreatic tissue at 1.5T and 3 T but have not been established for 7T yet. The purpose of this study is to determine the mean T1 and T2 values for pancreas at 7T in order to develop a method for optimizing abdominal imaging at this magnetic field strength.Methods
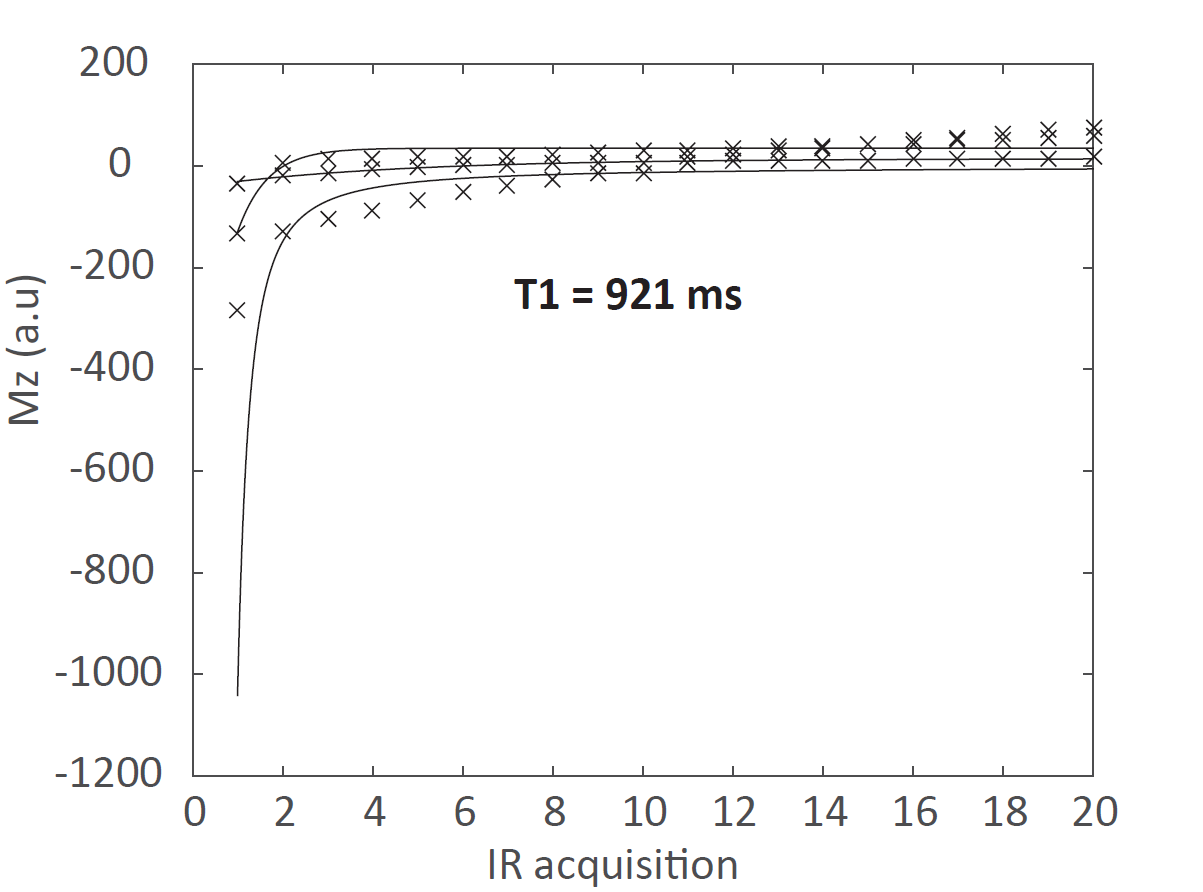
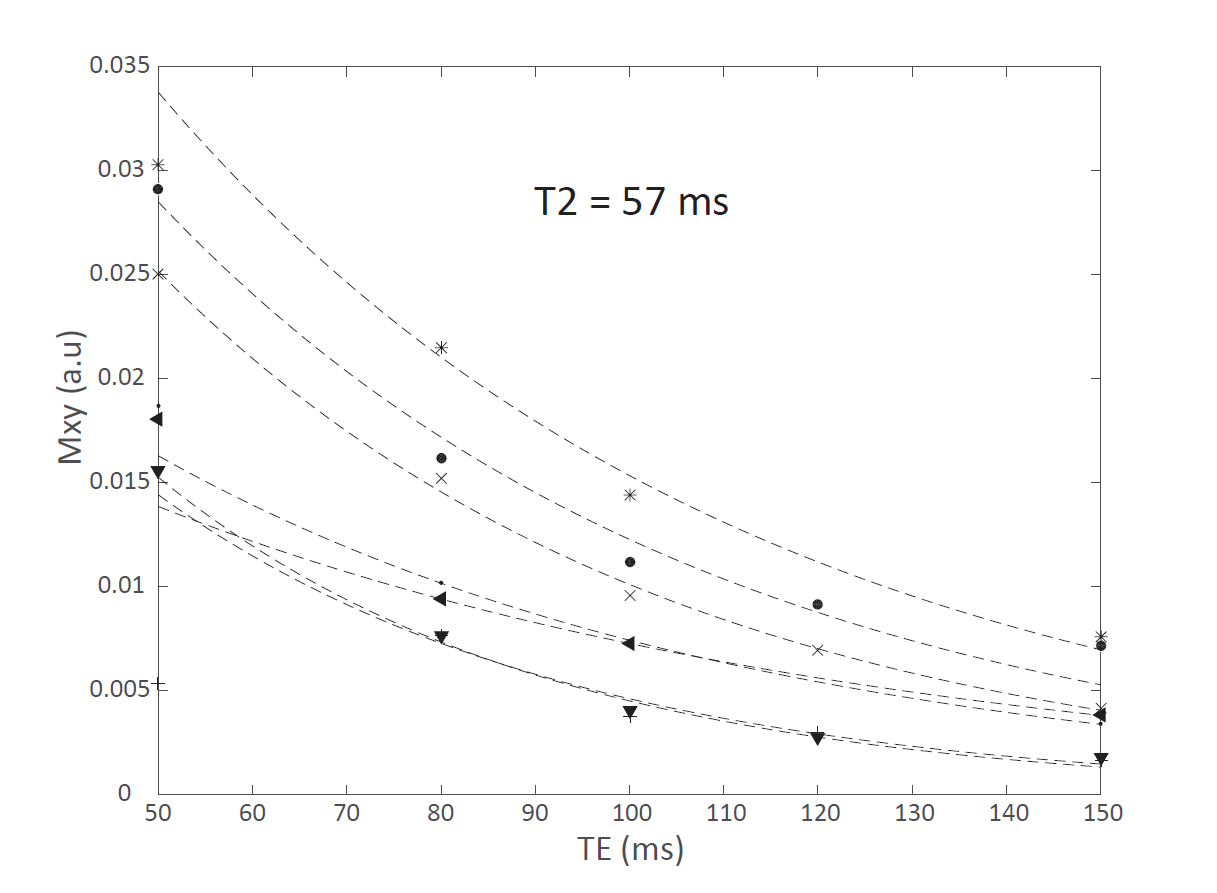
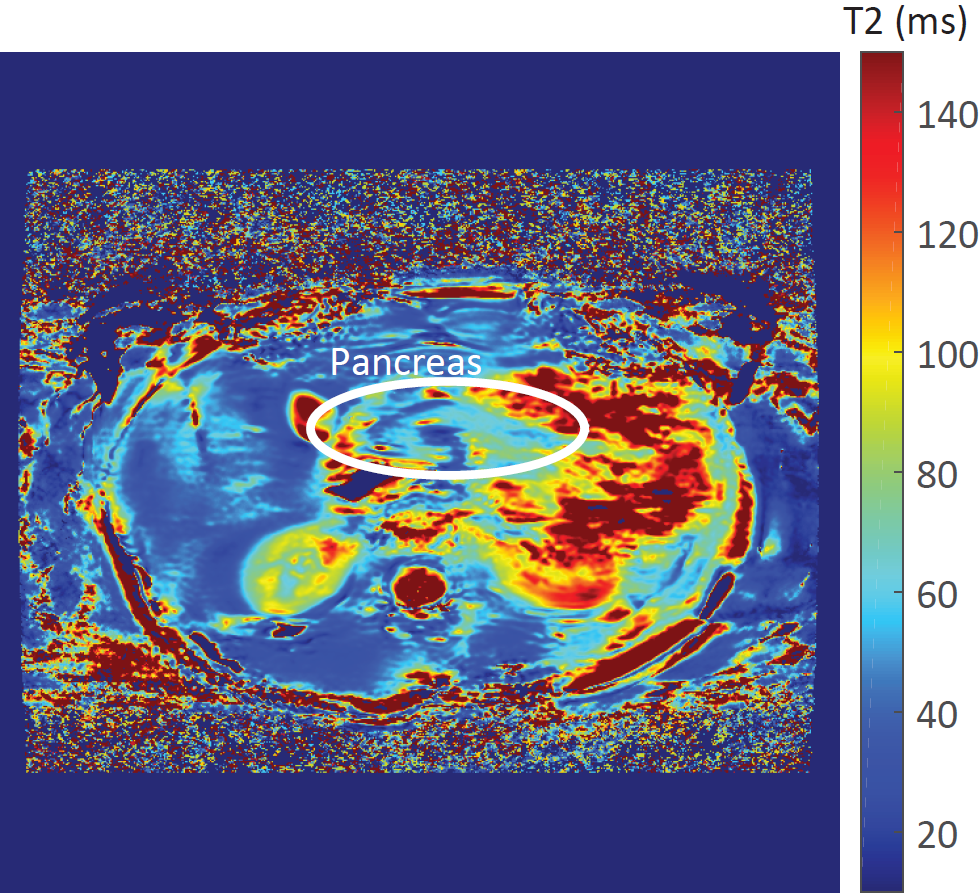
Six healthy volunteers were scanned with a 7T MR system (Philips, Best, The Netherlands) using eight transmit-receive fractionated dipole antennas[1] (MR Coils BV, Drunen, The Netherlands) with 16 additional receive loops integrated in the antennas that were positioned symmetrically around the abdomen. The antennas were steered by a multi-transmit system. RF phase shimming was done to maximize the B1+ field in the pancreas. After B1 shimming, gradient-echo images were obtained for anatomy localization. To decrease motion artifact, the study was carried out with an approximately 5 second breath hold. An inversion-recovery (IR) look-locker sequence was acquired for T1 determination (Turbo field echo (TFE), FA=3, TR/TE=9000/1.68ms, 20 IR times, 8:33 min total acquisition time, 4x4x10mm voxels, FOV=222x340mm). An echo time series sequence was obtained in one slice containing the pancreas to determine T2 (2D single shot turbo spin echo (TSE), TE/TR = 50;80;100;120;150ms/ 17s, SENSE factor = 2, 1.3x1.6x5mm voxels, FOV=250x350mm). Matlab scripts (R2014b, The Mathworks, Inc. ©) were made to process the acquired images and apply a mono-exponential decay or a 1-exp(-b/x) decay in a least squares fit[2] to the magnitude signal from a healthy pancreas region (ROI) to determine the T2 and T1 relaxations. In addition, T2 maps were also obtained per voxel.Results and discussion
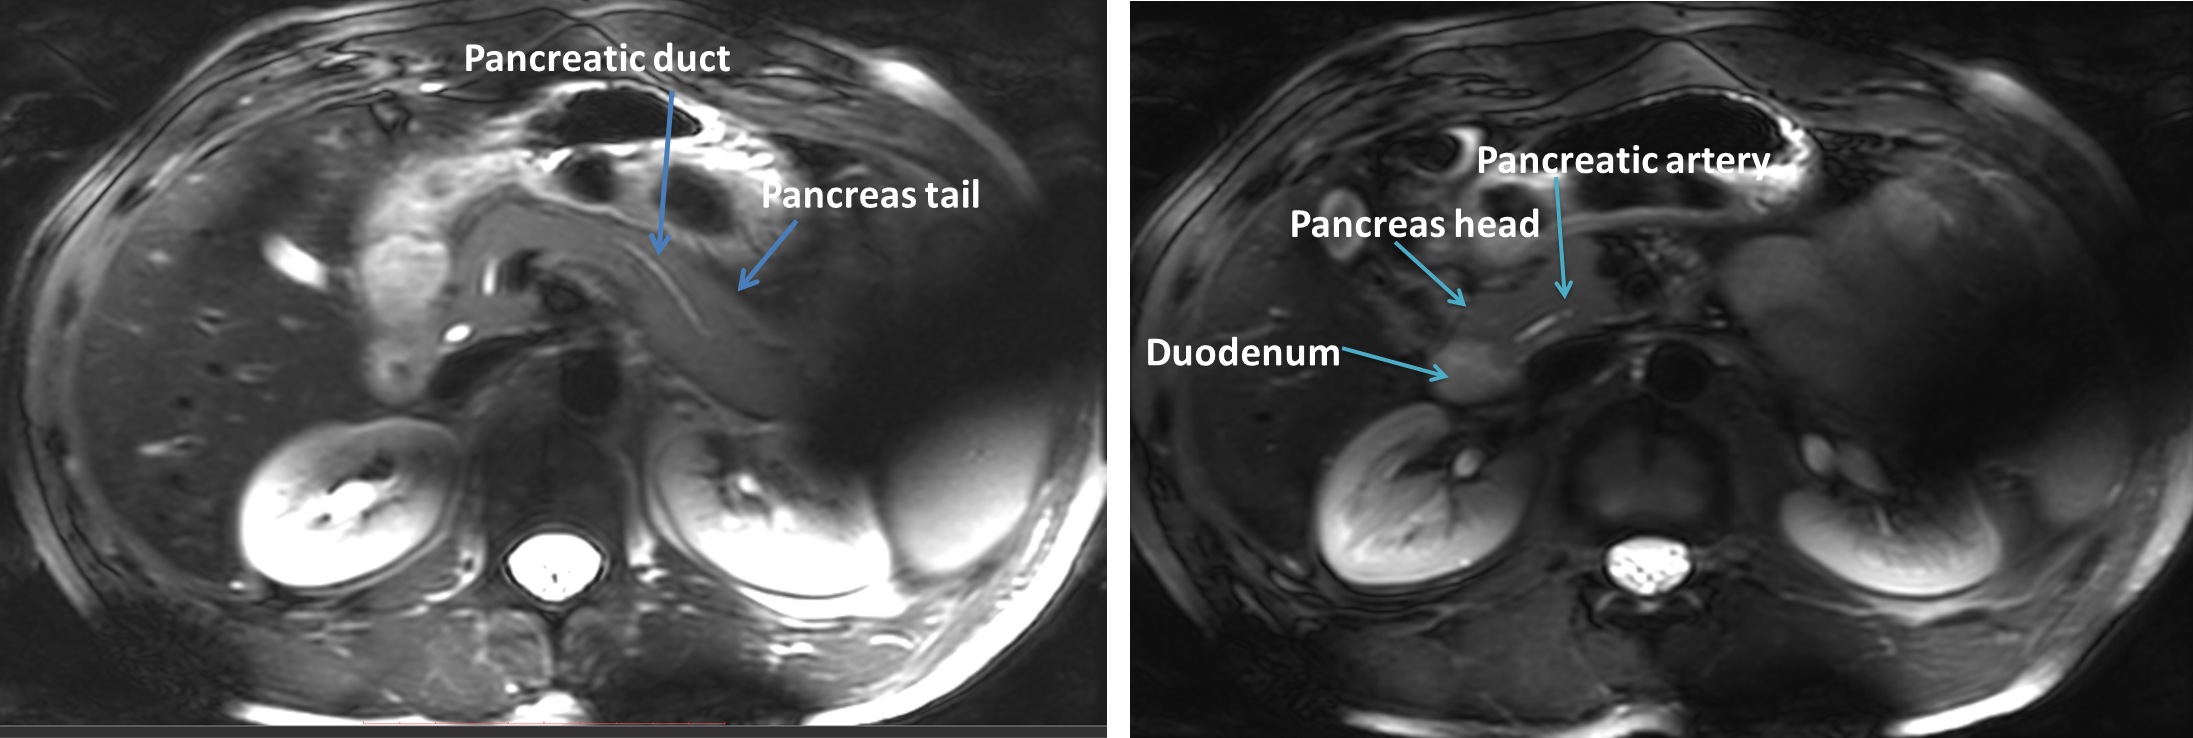
Look-locker was obtained for 3 of the volunteers. TE series were successfully obtained for all healthy volunteers. The mean signal within the ROIs for the inversion recovery series including the fits are shown in figure 1, the T1 value at 7T in healthy pancreas averaged for 3 volunteers was 921+/-98 ms (783-998 ms). The mean signals within the ROIs for the TE series including their fits are plotted in figure 2. The mean T2 value at 7T in healthy pancreas was in average 57+/-12 ms (41-77ms). Figure 3 shows a T2 map of the healthy pancreas, which has values within the range of the average T2 relaxation time found. In line with the 1.5T and 3T values in the literature[3][4]5], the T1 value is increasing and T2 value is roughly unaffected by the increasing field strength. Figure 4 shows a transverse T2w MRI of the pancreas with a chosen TE=80/TR=12000 ms, showing clearly the pancreatic duct, pancreatic artery and the enhanced contrast with its surroundings. The use of multi-transmit and breath-holding during imaging acquisition showed absence of artifacts in the TE-series and excellent image contrast in the T2w MRI.Conclusion
We have successfully measured, using multi-transmit system, the T1 and T2 values for the healthy pancreas at 7T. This resulted in an averaged T1 of 921 ms and a T2 of 57 ms.Acknowledgements
No acknowledgement found.References
1. Raaijmakers, A.J.E., et al., The fractionated dipole antenna: A new antenna for body imaging at 7 Tesla. Magnetic Resonance in Medicine, 2015.
2. MacFall, J.R., et al., An analysis of noise propagation in computed T2, pseudodensity, and sunthetic spin-echo images. Medical Physics, 1986.
3. Johnson G.A., et al., Tissue Relaxation Time: In Vivo Field Dependence. Radiation Physics, 1985.
4. Bottomley, P.A., et al., A review of normal tissue hydrogen NMR relaxation times and relaxation mechanisms from 1-100 MHz: Dependence on tissue type, NMR frequency, temperature, species, excision, and age. Medical Physics, 1984.
5. Chhori, C., et al., Quantitative Measurements of T1 and T2 for the Abdomen in a 3 Tesla Whole-Body Imager. Proc. Intl. Soc. Mag. Reson. Med. 11, 2003.
Figures