2001
Assessment of the Hepatocyte Fraction for Estimation of Liver Function Based on a Simple Pharmacokinetic Model1Radiology, Ruijin hospital of Shanghai Jiaotong University, Shanghai, People's Republic of China, 2Ruijin hospital of Shanghai Jiaotong University, 3Jinshan hospital of Fudan Univeristy
Synopsis
There were 16 consecutive patients (12 men, 5 women; mean age, 45.7 years; range, 33–65 years). Imaging was performed on clinical 3T scanner (Philips Ingenia) using 32ch body/cardiac coil. A hepatocyte fraction (HF) map and K map were derived. The HF and K values for Gd-EOB-DTPA were correlated with Child-Pugh scores. Patients with Child-Pugh class B disease showed significantly lower liver FA value and K value. HF value and K value were positively correlated with the Child–Pugh scores (r=0.752 to 0.855, p<0.05). HF value and K value had the largest AUC of 0.975 and 0.78 for distinguishing the Child–Pugh class A of cirrhosis from class B. K value had the most area under receiver operating characteristic curve (AUC) of 0.99 for identifying the presence of liver cirrhosis.The study suggested that hepatocyte fraction and hepatic uptake derived from Gd-EOB-DTPA-enhanced MRI can quantify liver function.
Introduction & Purpose
Quantitative evaluation of liver function is important not only for monitoring of that function, but also for preoperative assessment of the liver reserve. However, a reliable method for the quantitative anatomically based on evaluation of liver function has not been established to date. Gd-EOB-DTPA is a paramagnetic hepatobiliary contrast agent that can combine the features of extracellular agents with those of a hepatocellular contrast agent. Previous reports suggested that Gd-EOB-DTPA-enhanced MR imaging could be a useful method for quantitative evaluation of liver function. The aim of the present work was to develop a procedure for quantifying liver function using Gd-EOB-DTPA.
Methods
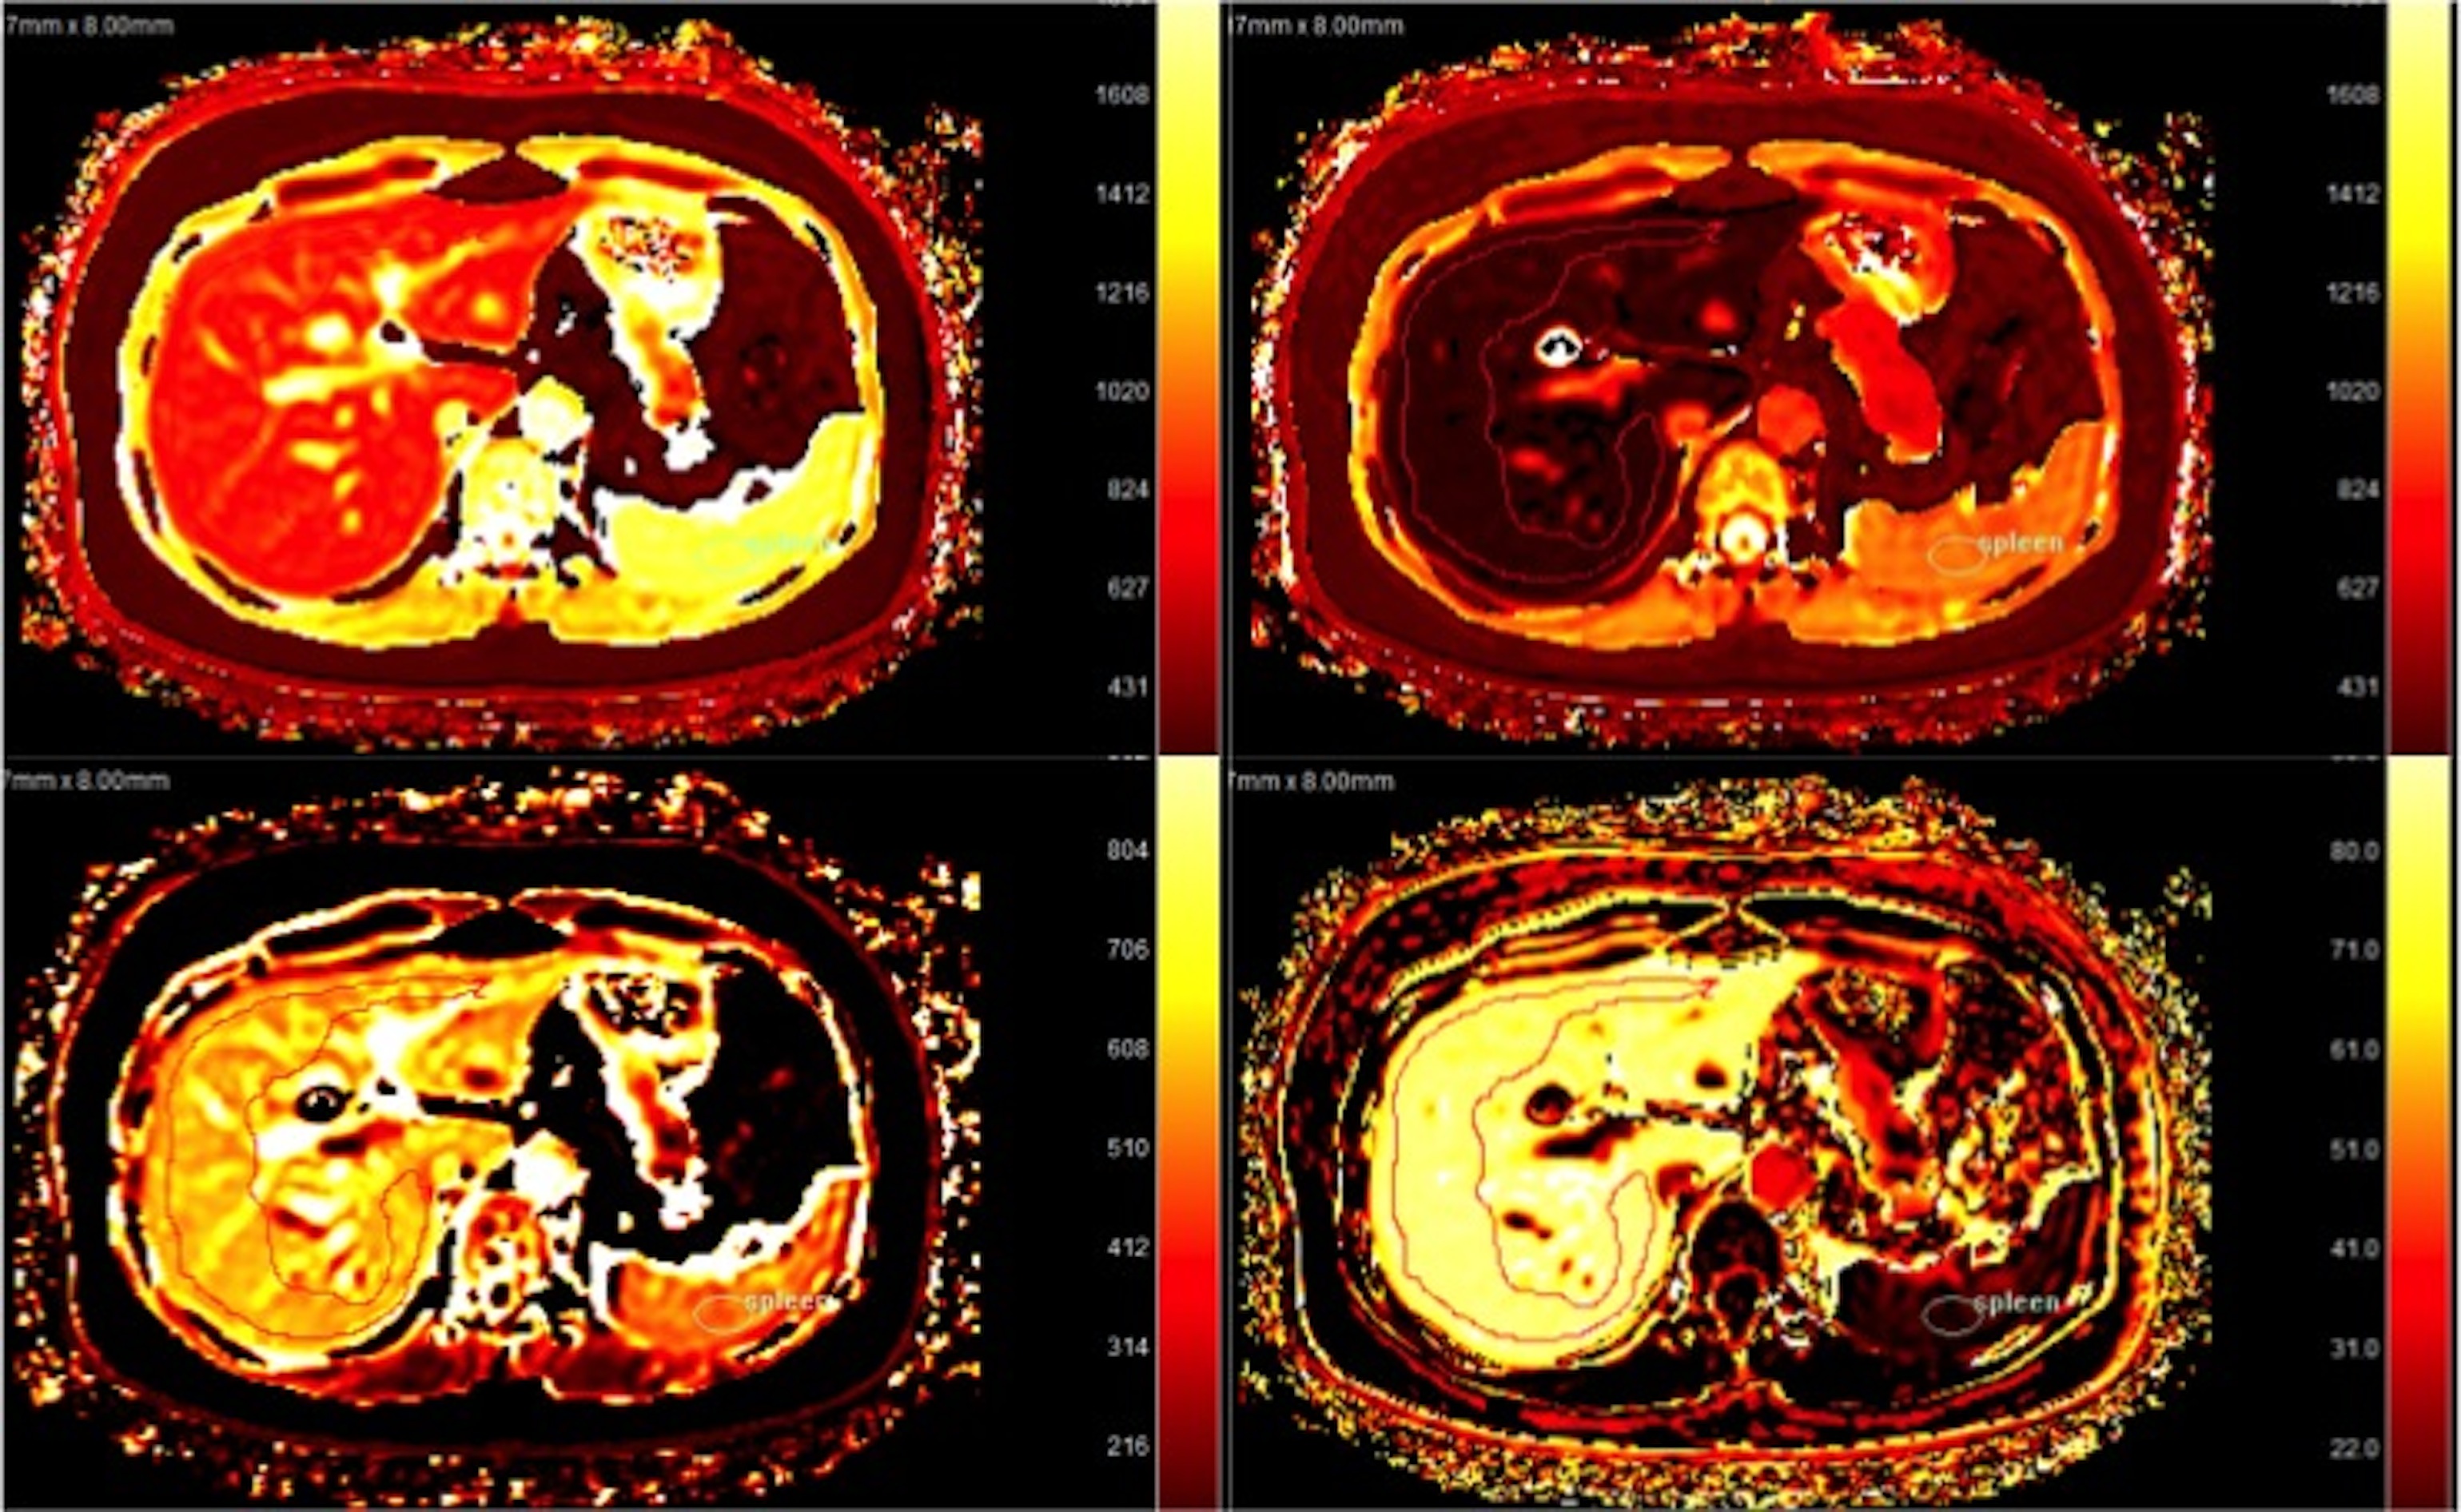
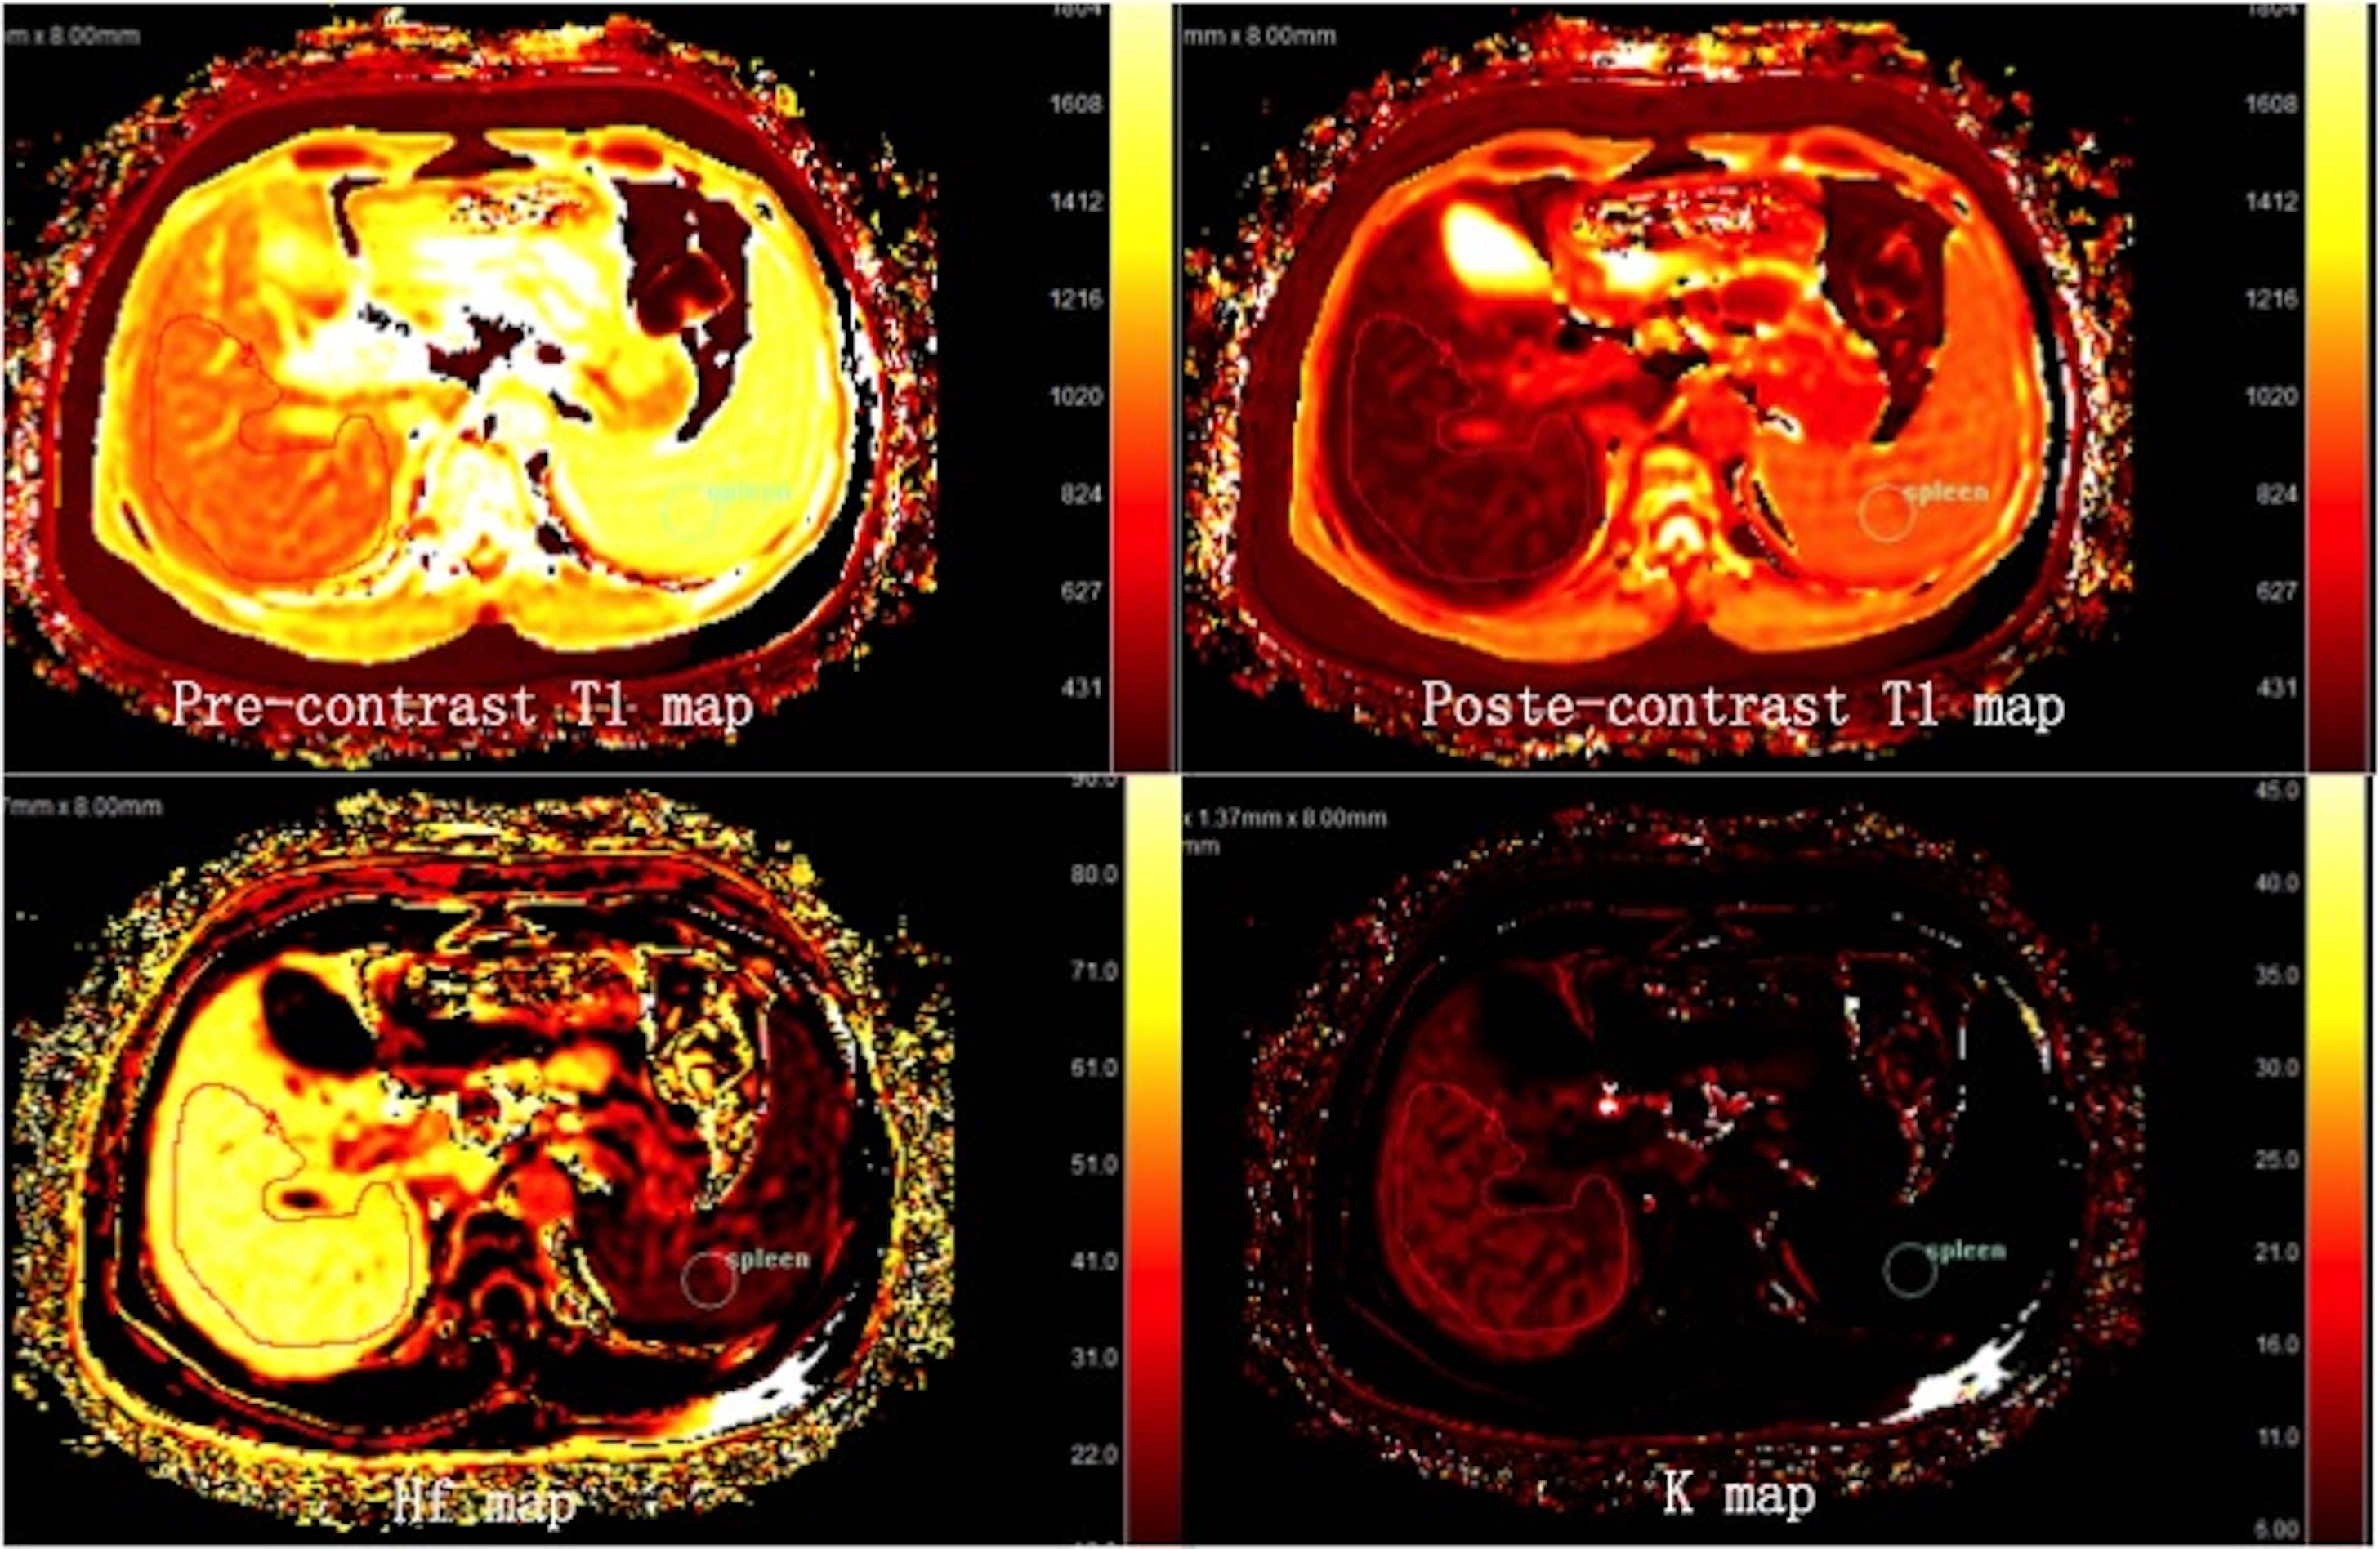
There were 16 consecutive patients (12 men, 5 women; mean age, 45.7 years; range, 33–65 years) who underwent Gd-EOB-DTPA MR imaging from August 2016 to October 2016. Imaging was performed on clinical 3T scanner (Philips Ingenia) using 32ch body/cardiac coil. Scan parameters were as follows: 2D Look-Locker sequence, T1-TFE, TE/TR=1.7 / 6ms, 1.37×1.37×8mm, FA=7, single-slice, shot interval=5sec, SENSE factor=2 , scan time =15sec, breath holding. One scan was acquired before EOB and post contrast image was acquired during the hepatobiliary phase defined as 20min post injection. Two radiologists experience in diagnostic imaging independently drew the outlines of the liver and spleen on the image section. Using pharmacokinetic models of the liver and spleen, and an SI rescaling procedure, a hepatocyte fraction (HF) map and K map were derived. For all patients, serum bilirubin, and other laboratory tests were retrieved to calculate the Child-Pugh scores. The HF and K values for Gd-EOB-DTPA were correlated with Child-Pugh scores.Results
Patients with Child-Pugh class B disease showed significantly lower liver HF value and K value. HF value and K value were positively correlated with the Child–Pugh scores (r=0.752 to 0.855, p<0.05). HF value and K value had the largest AUC of 0.975 and 0.78 for distinguishing the Child–Pugh class A of cirrhosis from class B. K value had the most area under receiver operating characteristic curve (AUC) of 0.99 for identifying the presence of liver cirrhosis.Conclusion
The hepatocyte fraction and hepatic uptake derived from Gd-EOB-DTPA-enhanced MRI have the potential to quantify liver function.Acknowledgements
No acknowledgement found.References
1. Yamada A, Hara T, Li F, et al. Quantitative evaluation of liver function with use of gadoxetate disodium-enhanced MR imaging. Radiology. 2011;260(3):727-33.
2.Volume-assisted estimation of liver function based on Gd-EOB-DTPA-enhanced MR relaxometry. Haimerl M, Schlabeck M, Verloh N, et al. Eur Radiol. 2016 Apr;26(4):1125-33.
3. Kamimura K, Fukukura Y, Yoneyama T, et al.Quantitative evaluation of liver function with T1 relaxation time index on Gd-EOB-DTPA-enhanced MRI: comparison with signal intensity-based indices. J Magn Reson Imaging. 2014;40(4):884-9.
Figures