2000
Liver quantification with dynamic contrast-enhanced MRI for evaluation in hepatic function and staging of post-hepatitic liver cirrhosis1MRI, The 1st affiliated hospital of Henan University of TCM, ZhengZhou, People's Republic of China
Synopsis
To evaluate the value of DCE-MR for hepatic reserve function assessment and staging in post-hepatitic liver cirrhosis (PHLC). 10 patients with compensatory PHLC, 10 with decompensatory PHLC and 10 healthy volunteers were performed DCE-MRI scanning. All data were calculated by Extended Tofts model fitting with pharmacokinetic curve and the permeability and perfusion parameters were measured in quantification. The new method validated the feasibility of using quantitative parameters of DCE-MRI with pharmacokinetic model to assess liver cirrhosis. In conclusion, DCE-MRI quantitative parameters can be used for diagnosing and staging liver cirrhosis.
Introduction
Introduction: The evaluation of hepatic function and staging is important in patients with post-hepatitic liver cirrhosis (PHLC) for therapeutic strategy. An Early detection and a clinical follow-up of changes in liver function will improve treatments for liver cirrhosis. Liver quantification using dynamic contrast enhancement MRI (DCE-MR) has potential to detect and assess vascular microenvironment and perfusion associated with PHLC.Methods
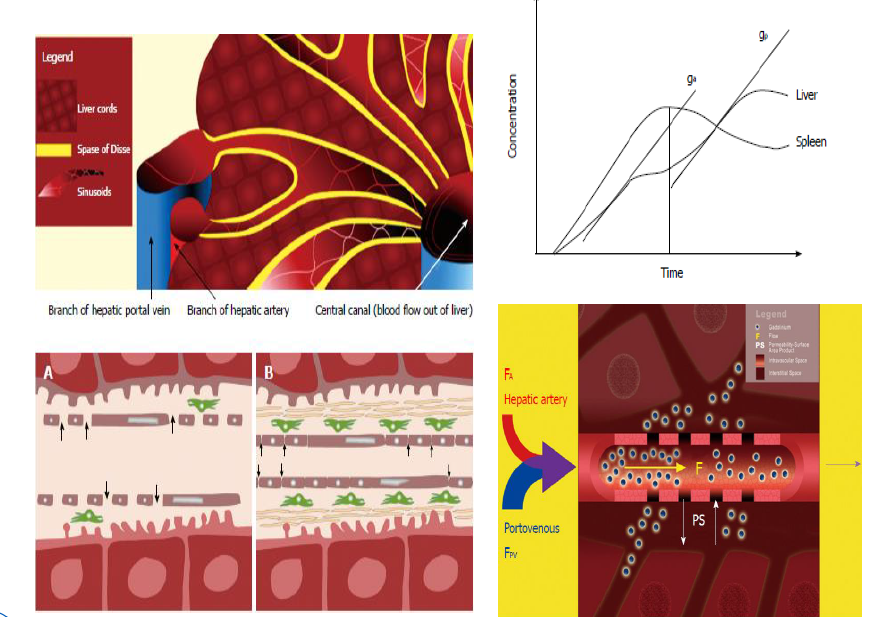
20 patients with PHLC staged according to Child-Pugh criteria (10 compensatory PHLC and 10 decompensatory PHLC) and 10 healthy volunteers were prospectively enrolled. DCE-MRI with gadodiamide (Gd-DTPA-BMA) and 3D-THRIVE sequence was performed on a 1.5T MRI scanner (Achieva, Philips, Netherlands). MRI parameters were as follows: TR/TE,3.8/1.8ms;slice thickness, 3 mm; FOV 400mm×400mm; acquisition matrix 160mm×160mm; number of excitations, 1; 30 images acquired for one phase, and 6.3s for each phase. The total acquisition time of 50 phases was about 5 min. Quantitative parameters of three groups were obtained by Extended Tofts model (Omni-Kinetics, GE healthcare). The permeability parameters included Ktrans (volume transfer constant of the contrast agent), Kep (Reverse reflux rate constant), Ve (Volume fraction of EES) and Vp (Volume fraction of plasma) and the perfusion parameters included HPI(hepatic arterial perfusion index), BV(blood volume),BF (blood flow) and MTT (mean transit time). The parameters between three groups were compared with one-way analysis of variance and LSD test for every two groups. Spearman correlation was used to analyze the correlation of degree of liver cirrhosis with quantitative parameters. The sensitivity and specificity of the quantitative parameters were analyzed by using receiver operating characteristic curve (ROC). A P value of less than 0.05 was considered significant.Results
The value of Ktrans decreases were found significantly between normal group and liver cirrhosis groups (P<0.05). The value of Ve increases were found significantly between normal group and liver cirrhosis groups (P<0.05). There were no significance between three groups for Kep and Vp (P>0.05). HPI and MTT increases were found significantly among three groups (P<0.05), as well as significantly between every two groups(P<0.05). BF decreases were found significantly between normal group and liver cirrhosis groups (P<0.05), while there were no significance among three groups for BV(P>0.05). Ve were positively correlated with liver cirrhosis staging(r=0.451, P<0.05), Ktrans were negatively correlated with liver cirrhosis staging(r=-0.407, P<0.05); HPI and MTT were positively correlated with liver cirrhosis staging(r=0.428 and 0.517, P<0.05), BF were negatively correlated with liver cirrhosis staging(r=-0.596, P<0.05). According to AUC from ROC of parameters, the optimal HPI was 0.54 and MTT was 0.29, the sensitivity and specificity of diagnosis for compensatory liver cirrhosis were 85% and 75%. When optimal HPI was 0.695, and MTT was 0.528, Ktrans was 0.415, and optimal Ve was 0.283, the sensitivity of diagnosis for decompensatory liver cirrhosis were above 90% and specificity of diagnosis for decompensatory liver cirrhosis were 80%.Discussion
The study primarily focused on the establishment and application of a new method based on the double-input and two-compartment model for assessment of variously staged liver cirrhosis.Perfusion parameter variations confirm the hemodynamic changes associated with cirrhotic damage. Collagen deposition and occurring in liver cirrhosis contributes to portal perfusion decrease which resulted in the decrease of BF. A buffer response in the liver is able to counterbalance this phenomenon by increasing arterial perfusion leading to an increase of HPI and MTT. Ktrans and Ve decreased in a cirrhotic liver as well as with progressing liver cirrhosis due to increasing deposition of ECM in the interstitial space. This study has validated the feasibility of using quantitative parameters of DCE-MRI with pharmacokinetic model to assess liver cirrhosis. The permeability parameters (Ktrans and Ve) and the perfusion parameters (HPI,BF and MTT) were good predicators for differentiating cirrhotic livers from normal livers, and staging compensatory and decompensatory liver cirrhosis, as well as evaluating hepatic reserve function.Conclusions
DCE-MRI quantitative analysis could reflect hemodynamic changes and variation of vascular microenvironment for liver cirrhosis, and could be helpful to evaluate severity of liver cirrhosis and staging, suggesting quantitative parameters could be used as important indexes for the degree of PHLC and hepatic reserve function.Acknowledgements
Contract grant sponsor: Foundation for Science and Technology Development Program of Henan province of China ; contract grant number: No 162102310104
References
1 Groszmann R,Vorobioff JD,Gao H. Measurement of portal pressure: when, how, and why to do it[J].Clin Liver Dis,2006,10(3):499-512.
2 Kubo H,Harada M,Ishikawa M,et al.Hemo dynamic changes with liver fibrosis measured by dynamic contrast-enhanced MRI in the rat[J].Magn Reson Med Sci,2006,5(2):65-71.
3 Baxter S,Wang ZJ,Joe BN,et al.Timing bolus dynamic contrast-enhanced(DCE)MRI assessment of hepatic perfusion:Initial experience[J].J Magn Reson Imaging,2009,29(6): 1317-1322.
4 Türkbey B,Thomasson D,Pang Y,et al.The role of dynamic contrast-enhanced MRI in cancer diagnosis and treatment[J].Diagn Interv Radiol,2010,16(3):186-192.
5 Boss MK, Muradyan N, Thrall DE. DCE-MRI: a review and applications in veterinary oncology[J].Vet Comp Oncol.2013,11(2):87-100
6 Yuan Y, Kuai XP, Chen XS, et al. Assessment of dynamic contrast-enhanced magnetic resonance imaging in the differentiation of malignant from benign orbital masses[J].Eur J Radiol,2013,82(9):1506-1511.
7 Kubo H,Harada M,Ishikawa M,et al. Hemo dynamic changes with liver fibrosis measured by dynamic contrast-enhanced MRI in the rat[J].Magn Reson Med Sci,2006,5(2):65-71.
8 Baxter S, Wang ZJ,J oe BN, et al. Timing bolus dynamic contrast-enhanced(DCE)MRI assessment of hepatic perfusion: Initial experience[J].J Magn Reson Imaging,2009,29(6): 1317-1322.
9 Van Beers BE,Leconte R,Mateme AM,et al.Disease:Dynamic CT Measurements Correlated with DiseaseSeverity[J].Aln.J,Roentgenol,Marchl,2001,176(3):667-673.
10 Zhang W, Kong X, Wang ZJ, Luo S1, Huang W1, Zhang LJ, et al.Dynamic contrast-enhanced magnetic resonance imaging with Gd-EOB-DTPA for the evaluation of liver fibrosis induced by carbon tetrachloridein rats. PLoS One 2015;10:e0129621
Figures
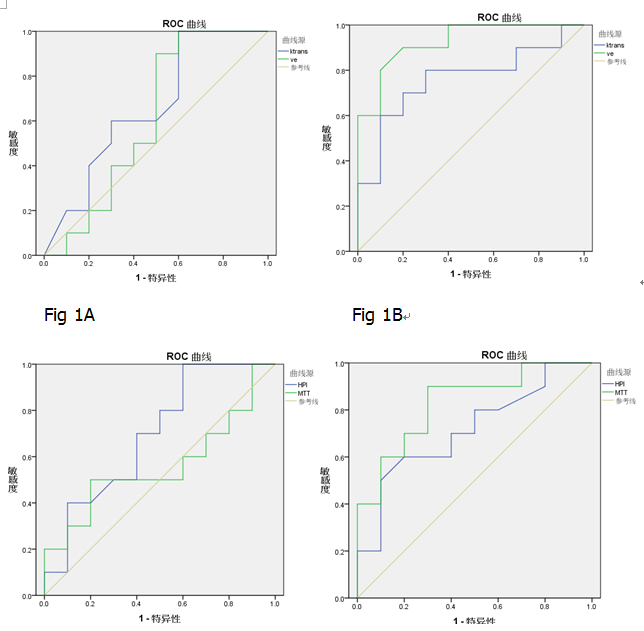
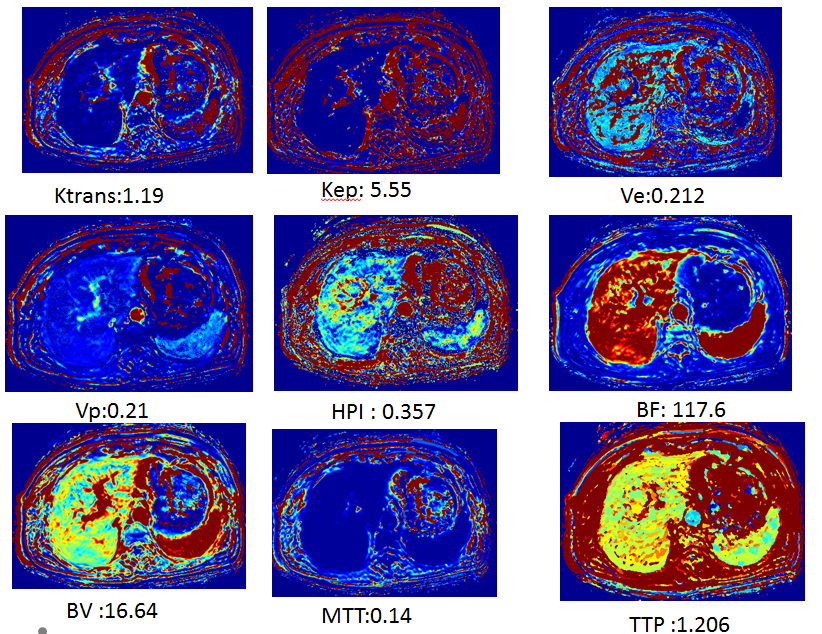
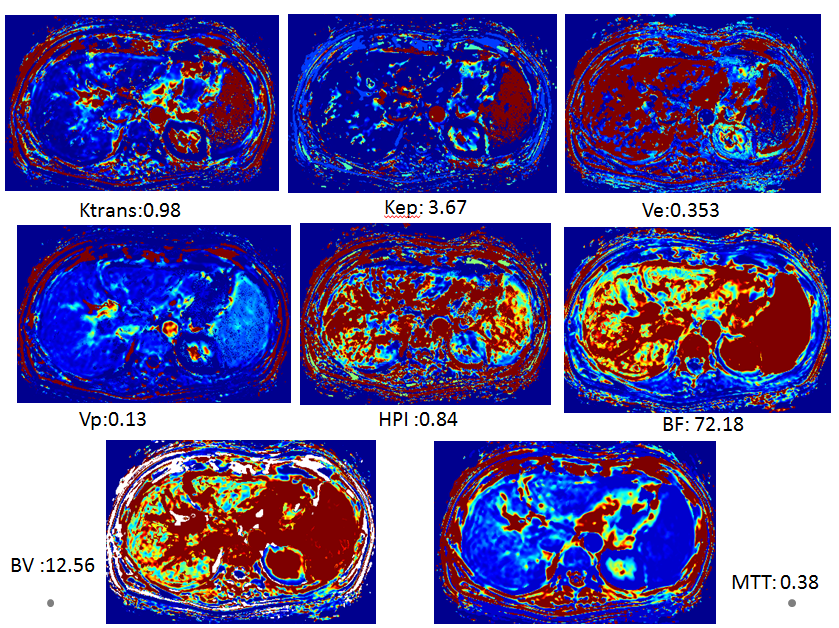
Fig 3 Quantitative parameters pseudo-color map for compensatory liver cirrhosis group with quantitative values.
Female, 56y, hepatitis B for 15y, compensatory liver cirrhosis
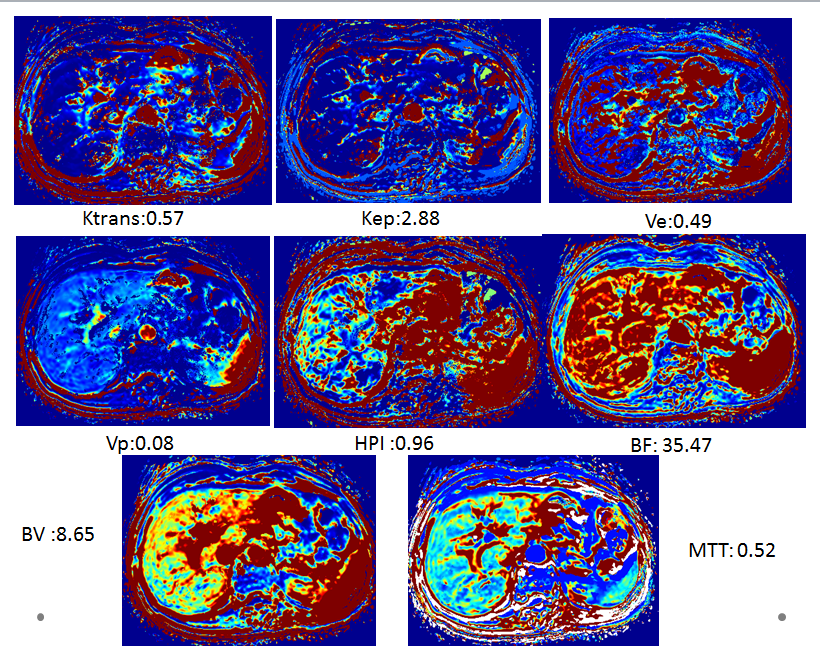
Fig 4 Quantitative parameters pseudo-color map for decompensatory liver cirrhosis group with quantitative values.
male, 68y, hepatitis B for 30y, decompensatory liver cirrhosis