1999
Simultaneous liver and spleen 2D MRE and 3D MRE acquisitions: Preliminary results1Translational and Molecular Imaging Institute, Icahn School of Medicine at Mount Sinai, New York, NY, United States, 2Department of Radiology, Mayo Clinic, Rochester, MN, United States, 3Department of Biomedical Engineering, University of Delaware, DE, United States, 4Siemens Healthcare, Salt Lake City, UT, United States, 5Department of Radiology, Icahn School of Medicine at Mount Sinai, New York, NY, United States
Synopsis
We present initial results of 2D MR elastography (MRE) and 3D MRE acquired in liver and spleen using a dual driver configuration in 13 subjects, 5 healthy and 8 with liver disease. 2D MRE showed a trend to higher stiffness in healthy subjects however in cirrhotic subjects liver stiffness was generally higher with 3D MRE. 3D MRE showed significantly higher liver stiffness in cirrhotic subjects compared to healthy subjects, with spleen stiffness also increased but not reaching significance. Coefficient of variation with single and dual drivers was 5% for liver and spleen in 2D and 3D MRE.
Purpose
2D scalar MR elastography (MRE) has excellent accuracy for assessment of liver fibrosis, while splenic MRE may have potential utility in assessing portal hypertension1. 3D vector MRE encodes and analyzes all 3 components of the vector motion to address the issues of through-plane wave propagation which may cause increased stiffness in 2D MRE and changes in wave polarization which may affect scalar MRE motion sensitivity. We report initial results of liver and spleen stiffness from 2D and 3D MRE acquired using a dual-driver configuration. The primary objective is to compare the ability of 2D and 3D MRE to detect liver cirrhosis. The secondary objective is to investigate whether stiffness determined using 2 drivers is the same as 1 driver.Methods
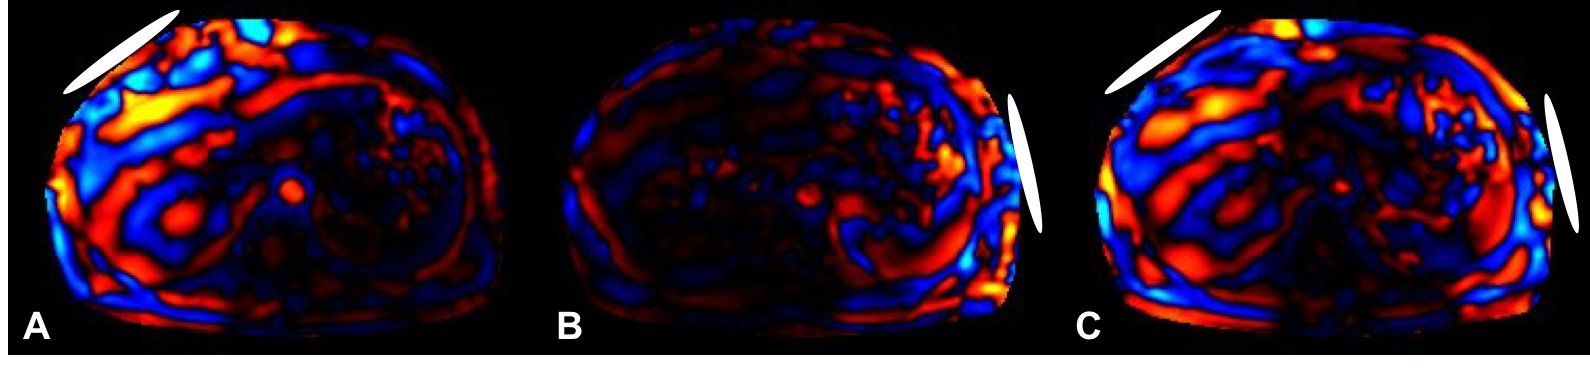
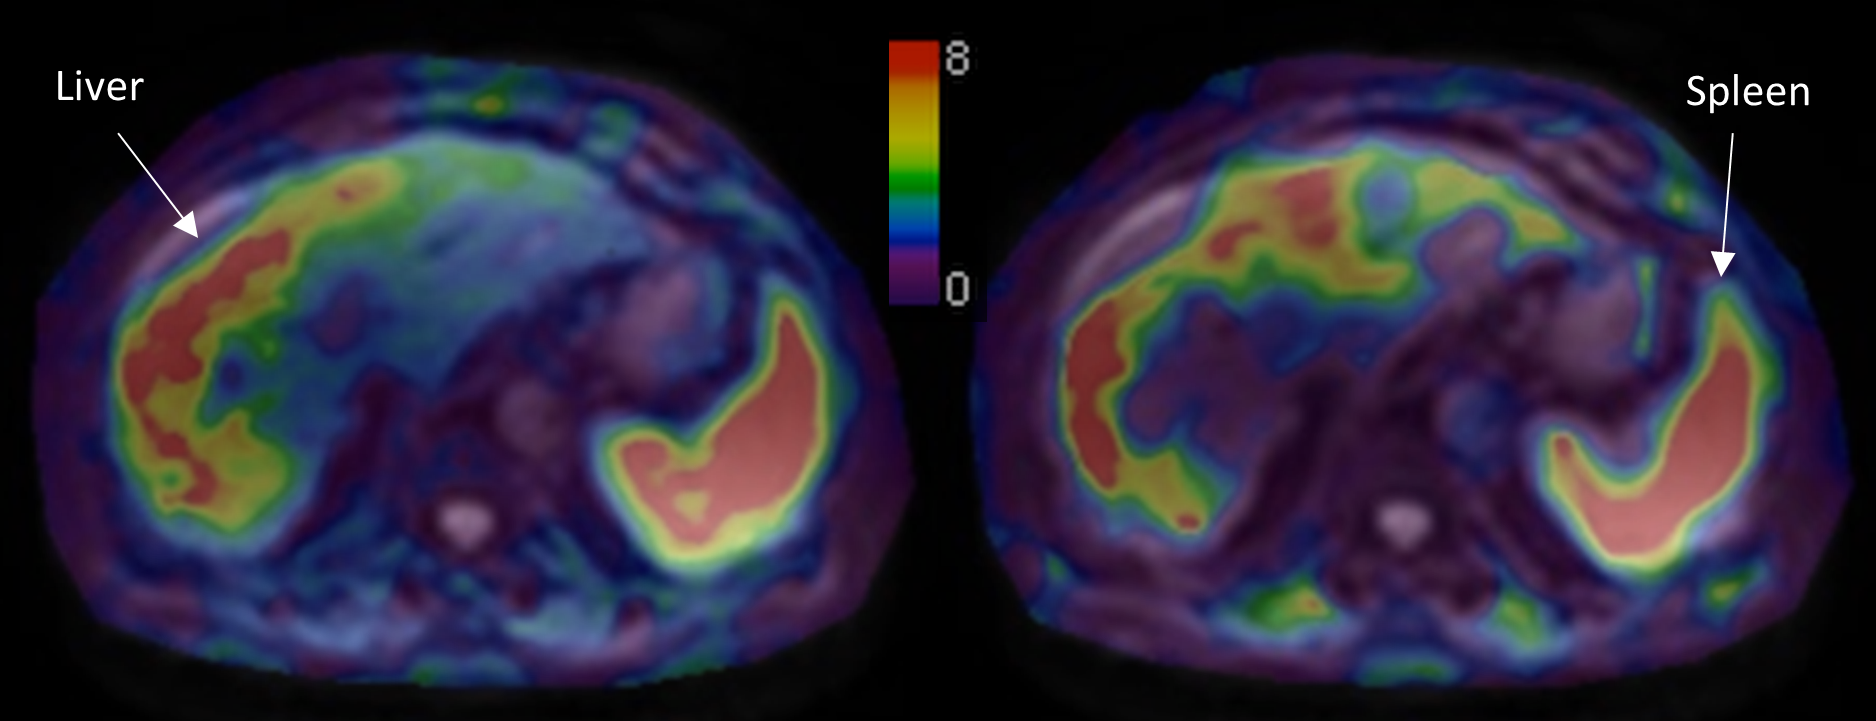
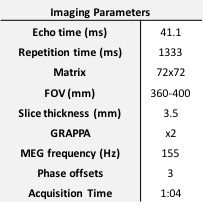
13 subjects were included in this preliminary, prospective IRB-approved study [5 healthy volunteers and 8 liver disease patients (6 cirrhotic), 8M/5F, mean age 53y]. 60-Hz SE-EPI vector MRE (Table 1) was performed at 3T (GE 750) using 2 drivers (connected via Y connector) for simultaneous liver and spleen MRE acquisition. In healthy volunteers, MRE was acquired using each driver individually and then both drivers simultaneously to assess the effect of possible wave interference on stiffness (Figure 1). Rather than perform separate 2D and 3D acquisitions, the 3D MRE data were processed using both 2D scalar and 3D vector MRE inversions, ensuring identical slice locations, applied vibrations, and image characteristics. Elastograms were produced from 3D vector MRE data using 3D direct inversion of the curl of the vector wave field using 3D directional filters2. 2D scalar MRE elastograms (using only the through-plane component of the vector motion) were computed using a 2D multi-model direct inversion algorithm3 (Figure 2). ROIs of liver and spleen, based on magnitude images and the 2D inversion confidence maps were drawn using ImageJ (NIH, Maryland, USA) with care taken to avoid areas of poor wave propagation and morphological structures. Mann-Whitney U tests were used to test the significance of the difference between 2D and 3D MRE stiffnesses and stiffnesses obtained using single and dual drivers.Results
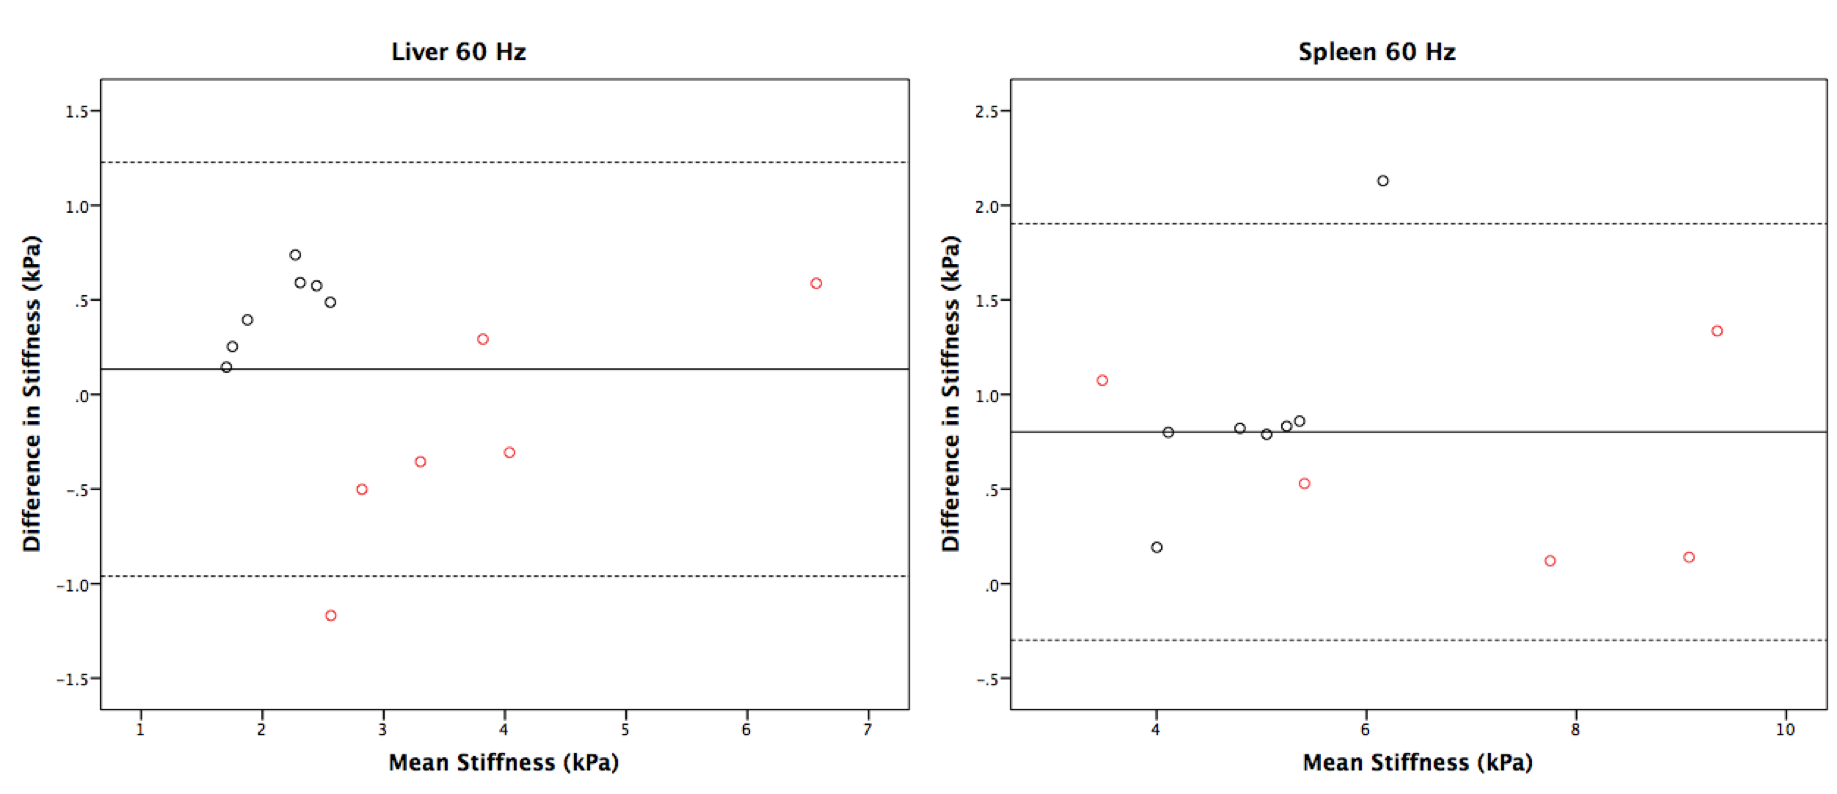
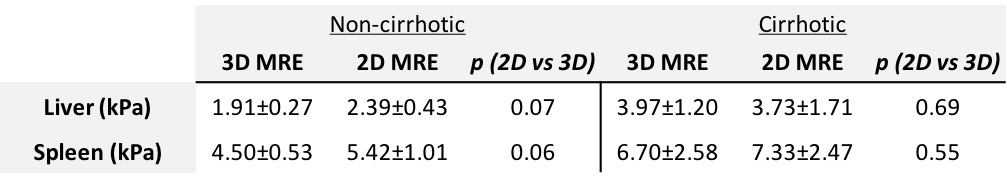
One spleen acquisition failed due to insufficient wave propagation. In non-cirrhotic subjects 2D MRE data showed higher mean stiffness than 3D MRE in the liver (2D MRE stiffer by 0.45±0.21 kPa, p=0.07) and spleen (2D MRE stiffer by 0.92±0.58 kPa, p=0.06) without reaching significance (Table 2). However, in cirrhotic subjects the results were more variable. 2D MRE stiffness was not significantly higher than 3D MRE stiffness in liver and spleen. The mean trend was to higher 3D MRE stiffness in liver (3D MRE stiffer by 0.24±0.62 kPa, p=0.6) and higher 2D MRE stiffness in spleen (2D MRE stiffer by 0.53±0.57 kPa, p=0.5). Bland-Altman plots of the difference in stiffness between 2D and 3D MRE are shown in Figure 3.
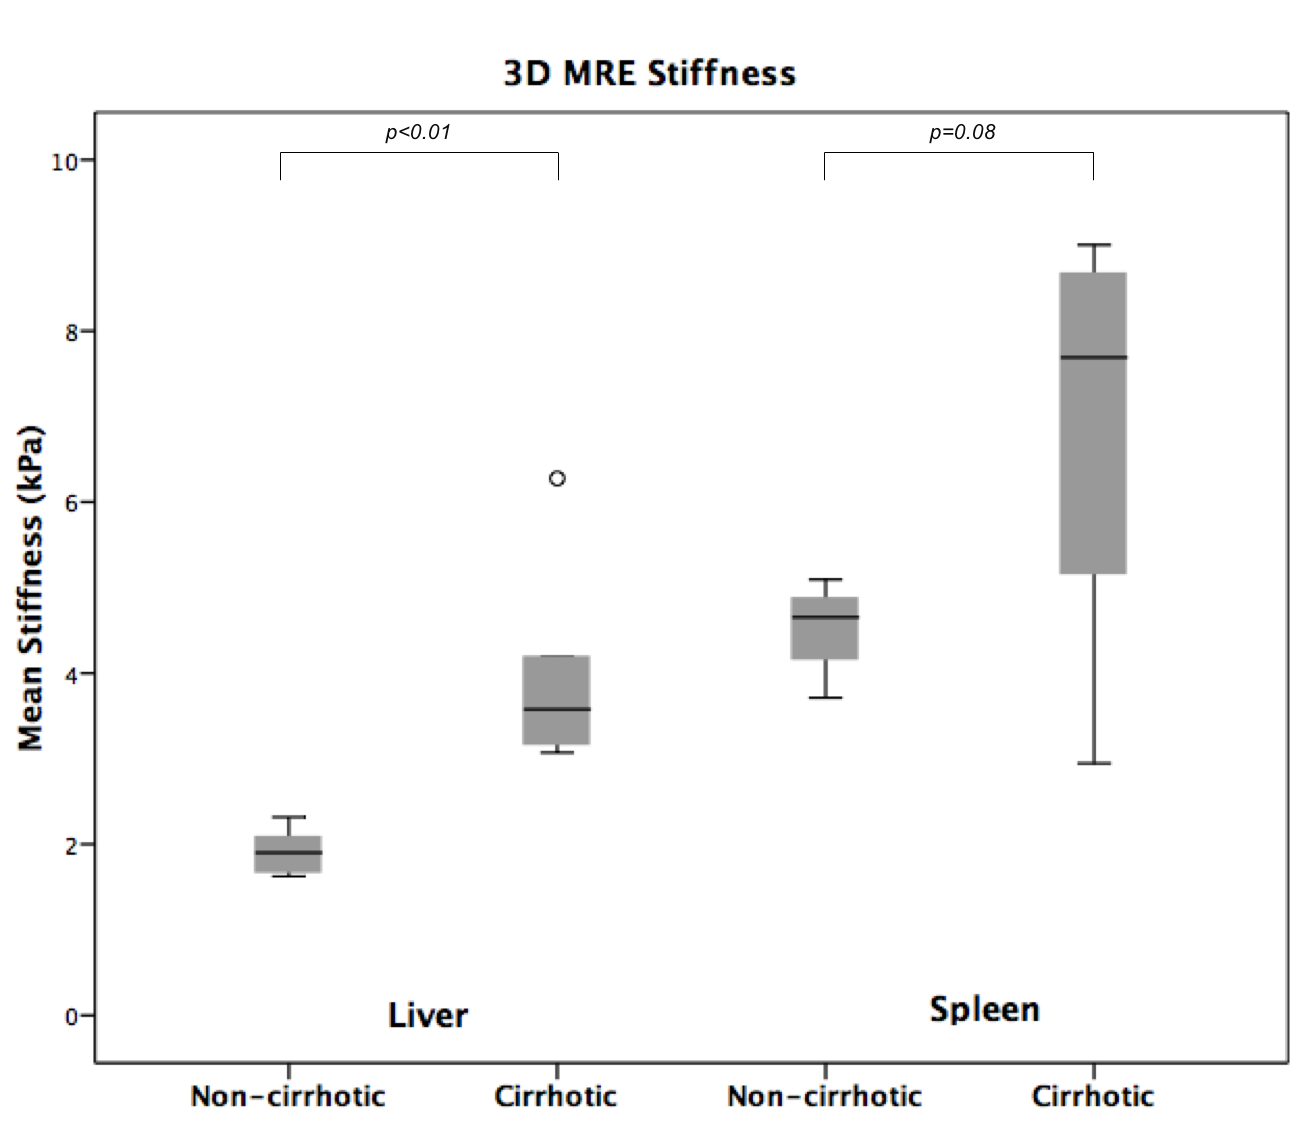
3D MRE showed a significantly increased stiffness in cirrhotic subjects compared to non-cirrhotic subjects in liver (p <0.01), however spleen stiffness difference did not reach significance (p=0.08, Figure 4). 2D MRE data revealed a trend to higher stiffness in cirrhotic subjects though it did not reach significance in liver (p=0.09) or spleen (p=0.16).
Stiffness measurements obtained using single and dual drivers were not significantly different regardless of organ or inversion method (p >0.4), with mean coefficient of variation (CV) 5% for liver and spleen using both 2D and 3D MRE.
Discussion
The results for non-cirrhotic subjects showed a generally higher (though not reaching significance with this small study population) 2D MRE stiffness compared to 3D MRE in liver and spleen. In cirrhotic subjects, 3D MRE stiffness was found to vary depending on organ, with higher 3D MRE values present in the liver compared to 2D MRE in some subjects. Splenic stiffness was higher with 2D MRE compared to 3D MRE. A possible reason for this is the more chaotic wave propagation in cirrhotic liver owing to enhanced diffraction effects. The dual driver configuration was not found to significantly affect the measured stiffness, enabling a 50% reduction in scan time by acquiring MRE data in both organs simultaneously.Conclusion
These initial findings suggest 3D MRE is an effective tool for the detection of liver cirrhosis. The 3D and vector aspects of 3D MRE processing provide a more accurate assessment of wave propagation and hence stiffness, however larger numbers of subjects are required to evaluate this. Future work includes accelerated patient recruitment, multifrequency acquisitions, and analysis of additional parameters available from 3D MRE processing (e.g., volumetric strain). This will enable additional improvements in the characterization of liver and spleen changes due to fibrosis, cirrhosis, and portal hypertension.Acknowledgements
No acknowledgement found.References
1. Nedredal, G. I. et al. Portal hypertension correlates with splenic stiffness as measured with MR elastography. J. Magn. Reson. Imaging JMRI 34, 79–87 (2011).
2. Shi, Y., et al. Feasibility of using 3D MR elastography to determine pancreatic stiffness in healthy volunteers. J. Magn. Reson. Imaging JMRI 41, 369–375 (2015).
3. Dzyubak, B. et al. Automated liver stiffness measurements with magnetic resonance elastography. J. Magn. Reson. Imaging JMRI 38, 371–379 (2013).
Figures