1998
Characterization of Primary Liver Cancers with DWI Histogram Analysis1Translational and Molecular Imaging Institute, Icahn School of Medicine at Mount Sinai, New York, NY, United States, 2Department of Radiology, Icahn School of Medicine at Mount Sinai, New York, NY, 3Department of Pathology, Icahn School of Medicine at Mount Sinai, New York, NY, United States
Synopsis
ADC measurement using DWI have shown promise for characterizing focal liver lesions. In this study, we assessed the ability of advanced ADC histogram parameters to distinguish the histological diagnosis and the grade of primary malignant liver cancers. We found that both ADC mean and ADC percentiles could distinguish between tumor types; ADC percentiles were also predictive of tumor grade for HCC and ICC. Advanced ADC histogram analysis may be useful for accurate tumor diagnosis and prediction of tumor grade.
Purpose
Primary liver cancers, including hepatocellular carcinoma (HCC), intrahepatic cholangiocarcinoma (ICC) and “combined” hepatocellular-cholangiocarcinoma (HCC-ICC) share common risk factors, are rising in incidence and differ in terms of treatment strategy and prognosis. ADC quantification is useful for liver lesion detection, however, is limited for lesion characterization given overlap in mean ADC values for malignant and benign liver lesions (1,2). ADC values have also shown inverse correlation with pathologic tumor grade for HCC and ICC (3,4). ADC histogram analysis with quantification of advanced metrics characterizing the distribution of ADC values within a lesion, have shown promise for differentiating between liver tumor types and pathologic tumor grades (5). The goal of this preliminary study was to evaluate the ability of quantitative ADC histogram parameters to characterize primary liver neoplasms and determine its role for predicting tumor grade.Methods and Materials
In this IRB-approved retrospective study, we included 34 consecutive patients (mean age 59.9±11.8y, 24M/11F) with pathology proven primary liver cancers that underwent MRI including single shot echo-planar (SS-EPI) DWI (b 50, 400, 800), from 12/2013 to 5/2016. Diffusion restriction pattern was qualitatively assessed on high b-values. Lesion volume of interest measurements (VOI) were placed on DWI images excluding areas of necrosis to extract the following ADC histogram parameters: ADC mean, median, min, max, skewness, kurtosis, and 5th, 10th, 25th, 75th, 90th and 95th percentiles. Tumor grade was categorized pathologically as well (G1), moderately (G2), or poorly differentiated (G3). ADC histogram metrics were compared between different tumor types and tumor grades using the Kruskal-Wallis test. The Mann-Whitney test was used to compare ADC metrics with histopathologic tumor grade (G1+2 vs. G3). Spearman correlation was computed to assess correlation between ADC histogram metrics and tumor grade.Results
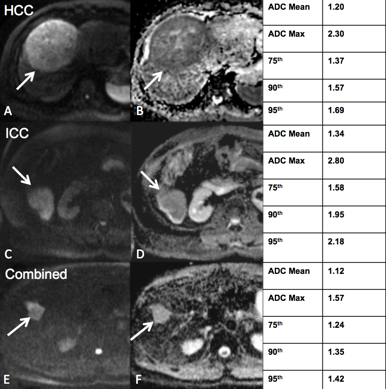
Preliminary results from 34 patients with 35 lesions (mean size 65 ± 30 mm) are reported. Lesions included HCC [n=14; G1 (n=3), G2 (n=8), G3 (n=3)], ICC [n=12; G2 (n=6), G3 (n=6)] and combined HCC-ICC [n=9; G1 (n=3), G2 (n=2), G3 (n=4)]. On high b-value DWI, 11/14 (79%) HCCs, 12/12 (100%) ICCs and 9/9 (100%) combined tumors were hyperintense (Figure 1). ADC histogram values are shown in Table 1. For discrimination between tumor types, ADC mean was borderline significant (p=0.05); ADCmax, 75th, 90th and 95th percentiles were all significant (p values 0.03, 0.02, 0.01 and 0.01, respectively) (Figure 2). For distinguishing G3 tumors vs G1+2, the 5th percentile ADC values were significant for HCC (p=0.03) and the 10th percentile ADC values were borderline significant for ICC (p=0.05). A trend towards significance was observed when correlating ICC tumor grade and ADCmean (r -0.53, p=0.09); there was no significant correlation for HCC or combined tumor grade and ADC metrics. There was no significant difference in ADC median, minimum, skewness, kurtosis or other percentile values for different tumor types or tumor grades (all p-values > 0.13).Discussion and Conclusions
Diagnosis of primary liver cancer is often an imaging diagnosis, and accurate prospective tumor diagnosis is essential to direct appropriate management, as patients with ICC and combined tumors should not be transplanted, as patients with ICC and combined tumors should not be transplanted. However, there are overlapping appearances between all primary liver cancers. Histogram quantification enables derivation of additional metrics and can minimize the effect of outlier ADC measurements. Our preliminary results demonstrate that primary liver cancers are highly conspicuous on DWI and may potentially be distinguishable based on the advanced ADC metrics, possibly in combination with qualitative imaging findings. Statistical percentile parameters reflecting the shape of the right side and left side of the ADC histogram may be useful for distinction of tumor type and tumor grade, respectively. There was a trend towards correlation between ADC and ICC tumor grade, which was not found in HCC or combined tumors. Skewness or kurtosis values were not predictive of tumor type or grade, which could be due to inadequate sample size. ADC histogram quantification may potentially be useful for characterization of histopathologic diagnosis and tumor grade. These results need to be confirmed with a larger number of cases.Acknowledgements
No acknowledgement found.References
1. Parikh T, Drew SJ, Lee VS, et al. Focal liver lesion detection and characterization with diffusion-weighted MR imaging: comparison with standard breath-hold T2-weighted imaging. Radiology. 2008;246(3):812-822.
2. Sandrasegaran K, Akisik FM, Lin C, Tahir B, Rajan J, Aisen AM. The value of diffusion-weighted imaging in characterizing focal liver masses. Academic radiology. 2009;16(10):1208-1214.
3. Nakanishi M, Chuma M, Hige S, et al. Relationship between diffusion-weighted magnetic resonance imaging and histological tumor grading of hepatocellular carcinoma. Annals of surgical oncology. 2012;19(4):1302-1309.
4. Lee J, Kim SH, Kang TW, Song KD, Choi D, Jang KT. Mass-forming Intrahepatic Cholangiocarcinoma: Diffusion-weighted Imaging as a Preoperative Prognostic Marker. Radiology. 2016:151781.
5. Drevelegas K, Nikiforaki K, Constantinides M, et al. Apparent Diffusion Coefficient Quantification in Determining the Histological Diagnosis of Malignant Liver Lesions. Journal of Cancer. 2016;7(6):730-735.
Figures