1997
Feasibility and grading performance of Quantitative Susceptibility Mapping for Hepatic Iron quantification1Department of Radiology, Ruijin Hospital, Shanghai Jiaotong University School of Medicine, Shanghai, People's Republic of China, 2Department of Electrical Engineering and Computer Sciences, University of California, Berkeley, CA, United States, 3MR Collaboration NE Asia, Siemens Healthcare, Shanghai, People's Republic of China, 4Siemens Shenzhen Magnetic Resonance Ltd, Shenzhen, People's Republic of China, 5MR Applications Predevelopment, Siemens Healthcare, Erlangen, Germany, 6The Helen Wills Neuroscience Institute, University of California, Berkeley, CA, United States
Synopsis
This study aimed to evaluate the performance of Quantitative Susceptibility Mapping (QSM) on estimating and grading the liver iron concentration (LIC), using Ferriscan-R2 values as reference. Thirty-three patients suspected of hepatic iron overload were included in this study. The results showed a significant positive correlation between QSM and Ferriscan-based LIC (r=0.924). ROC analysis revealed that QSM could accurately grade LIC for low and moderate iron overload patients, indicating that high-quality QSM maps may allow to reliably estimate and grade iron deposition in the liver.
Introduction
Accurate assessment of liver iron concentration is essential for the treatment with iron chelators to guarantee suitable chelator dose, avoiding both toxicity from iron overload and side-effects from an excessive chelator dose (1). MR imaging offers noninvasive alternative for the assessment of liver iron concentration (LIC). Ferriscan (Resonance Health, Claremont, WA, Australia) is a commercially MRI-based technique that estimates the LIC, which is approved by the U.S. Food and Drug Administration. Quantitative susceptibility mapping (QSM) has been demonstrated as a promising tool for quantifying brain iron concentration in deep gray matte (2,3). However, both chemical shift and breathing artifacts pose challenges for accurate susceptibility measurements in the liver (4). The purpose of this study was to estimate the LIC from the QSM maps, and further evaluate the LIC grading performance of QSM, with Ferriscan LIC as reference.Material and Method
This prospective study was approved by our institutional review board, and informed consent was obtained from all patients. Thirty-three patients (23 men, 10 women; mean age 43.2 year; range ,13-73 years) suspected of hepatic iron overload, with an elevated serum ferritin level (>1500 mg/L) were scanned on a 1.5 T MR system (MAGNETOM Aera; Siemens Healthcare, Erlangen, Germany) using a prototype multi-echo VIBE sequence under single breath-hold with the following parameters: TR=10 ms; TE1/spacing/TE6=1.44/1.36/8.24ms; bandwidth=1040 Hz/pixel; flip angle=6°; FOV=420 x 315 mm2; matrix size =224 x 168; slice thickness = 5 mm. 2D datasets for Ferriscan LIC measurement were acquired using a spin echo sequence with the standardized parameters according to the manual form the Ferriscan center. The acquired 2D SE data were uploaded to Ferriscan center for LIC analysis. QSM images were reconstructed by an in-house developed software prototype based on MATLAB (Mathworks, Natick, MA, USA), using a two-level streaking-artifact reduction algorithm (5). The image phase was unwrapped using a Laplacian-based method, and the background phase was removed using V-SHARP (6,7).
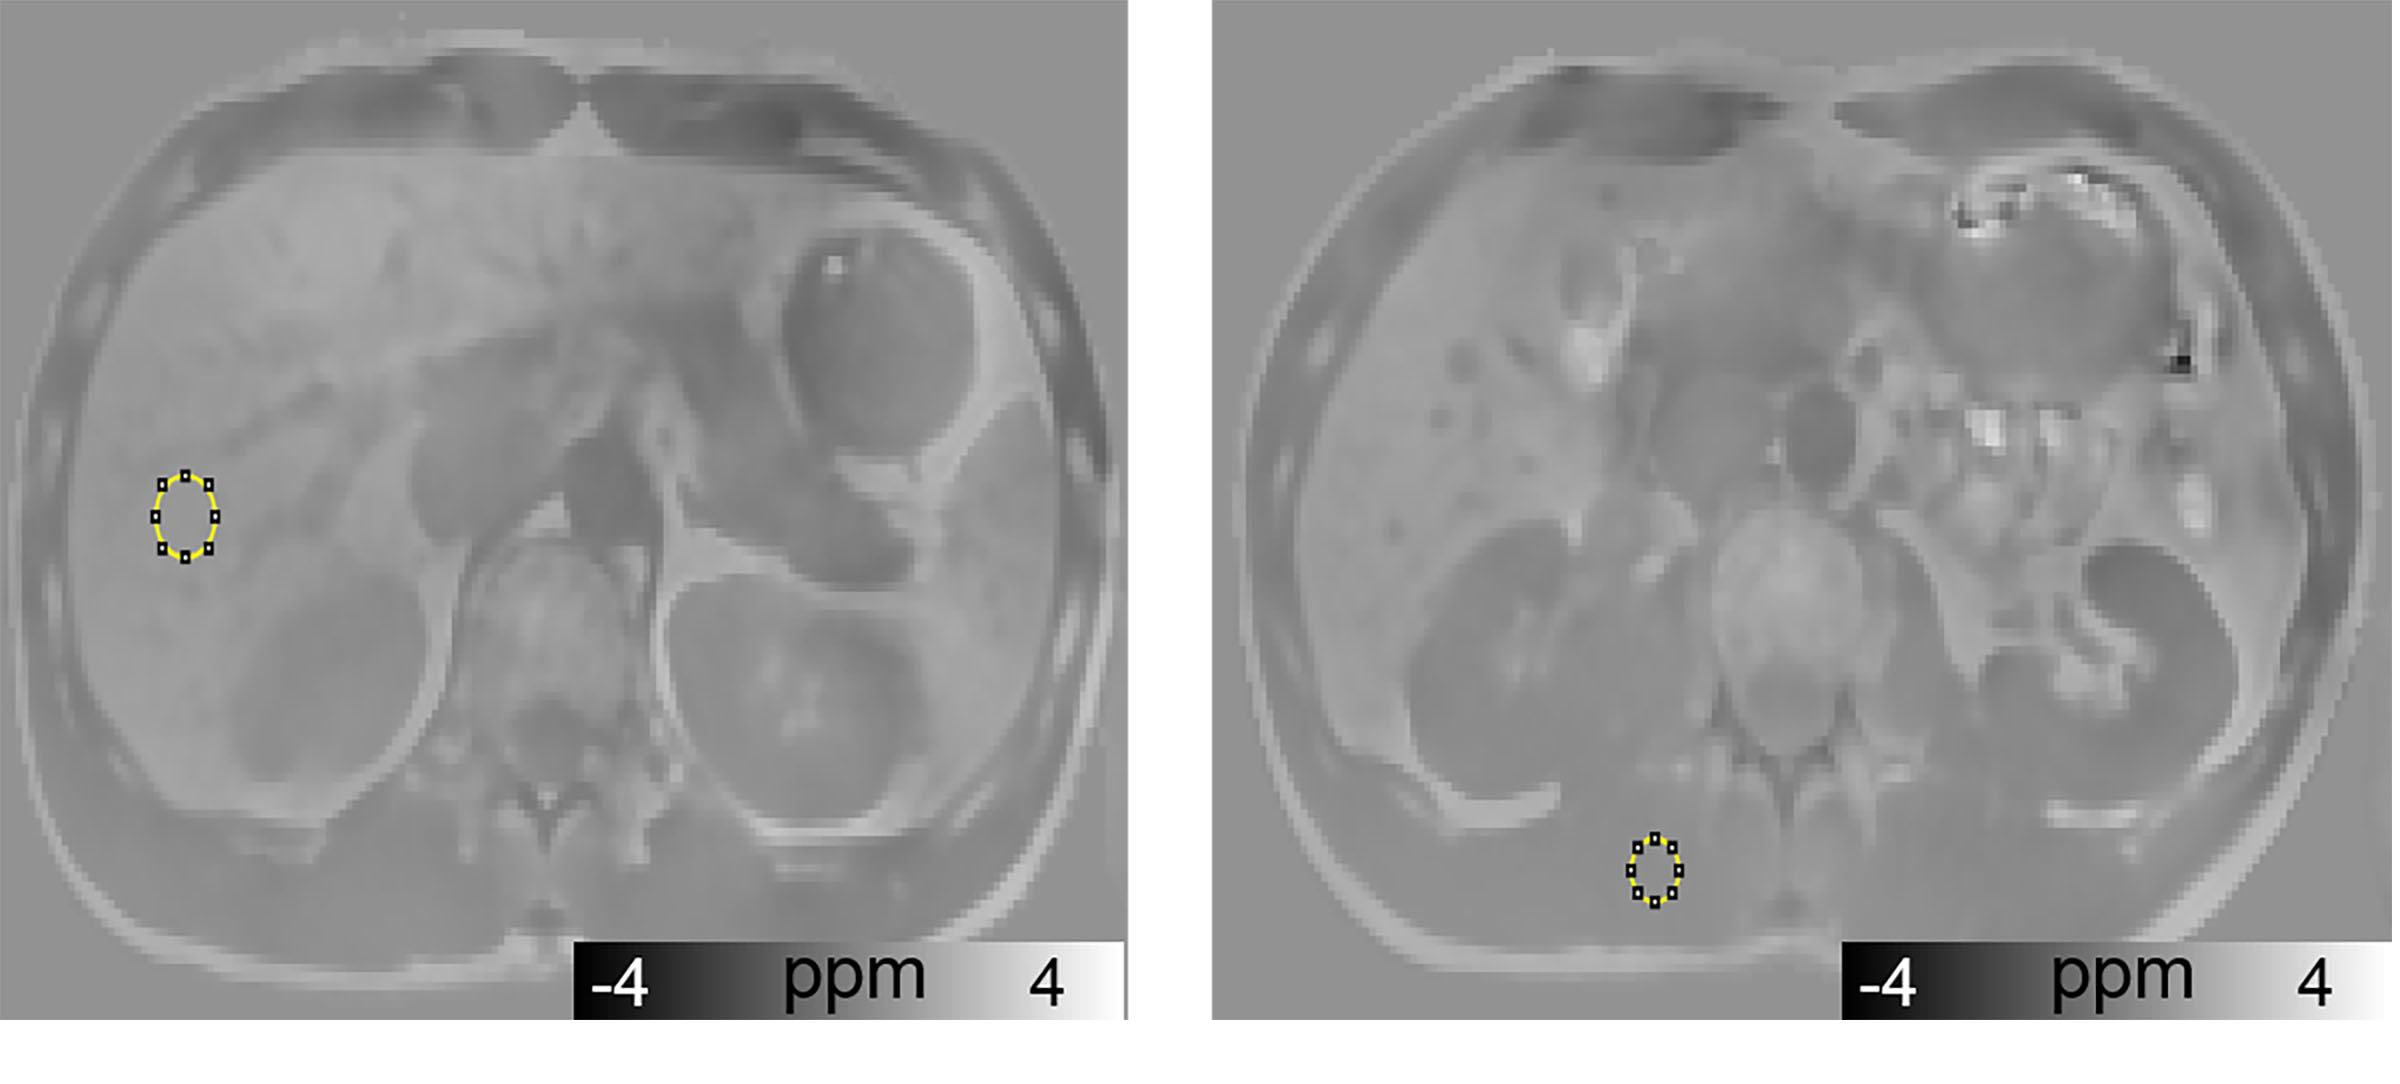
Circular ROIs were drawn in the inferior slices of the right hepatic lobe, avoiding vessels, borders, and artifacts. Liver susceptibility values were calculated relative to that of the paravertebral muscle tissue, which does not accumulate excess iron and is less affected by the artifacts generated by large magnetic susceptibility at air-tissue interfaces than subcutaneous fat (Fig. 1). Linear regression analysis was performed to investigate the correlation between liver susceptibility and the Ferriscan-based estimate of LIC. Receiver operating characteristic (ROC) curves were used to assess the cutoff levels of QSM value. The area under the ROC curve (AUC) was further calculated to evaluate the diagnostic performance of QSM in liver iron overload.
Results
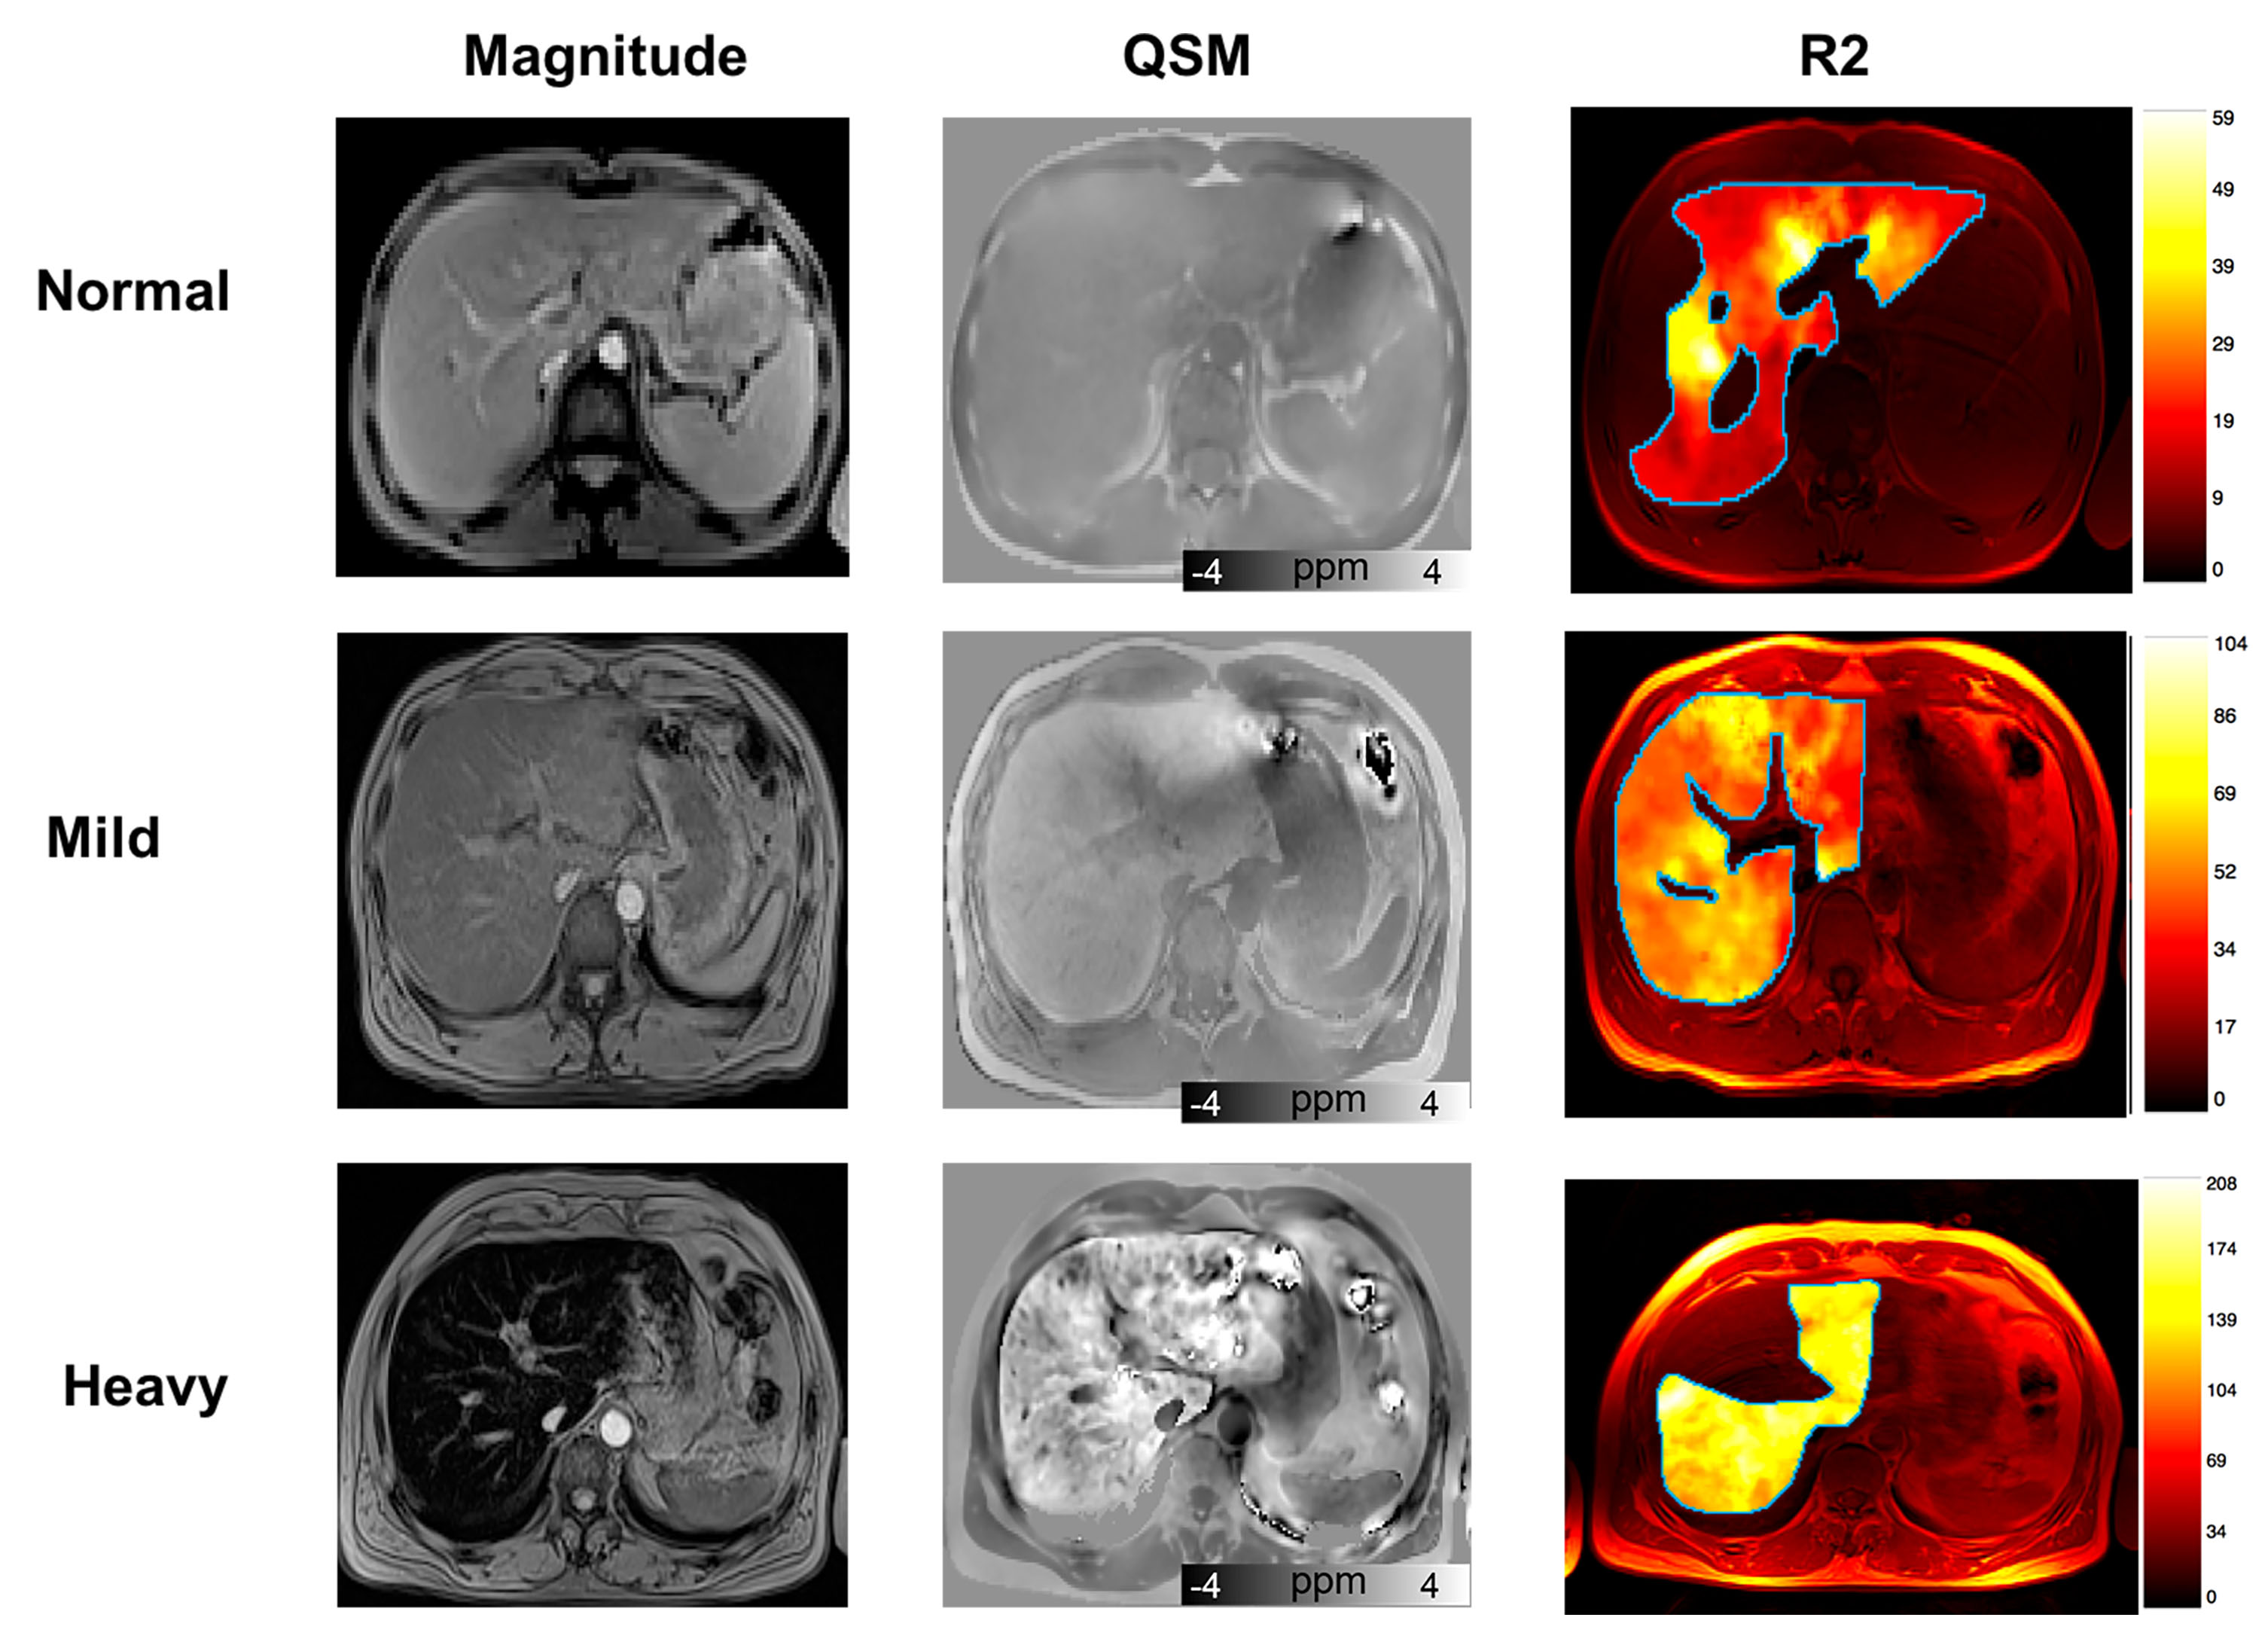
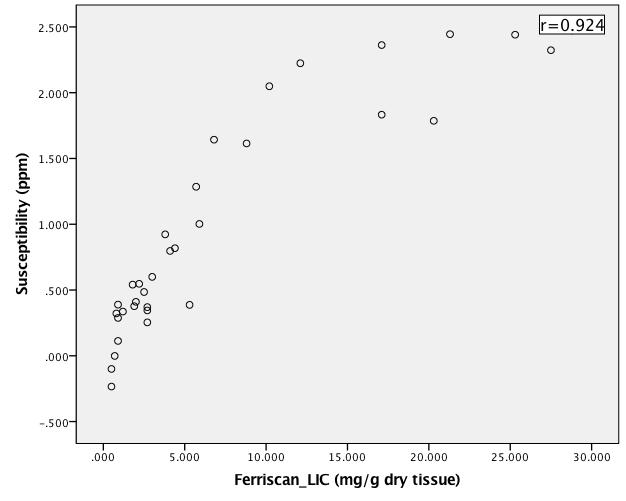
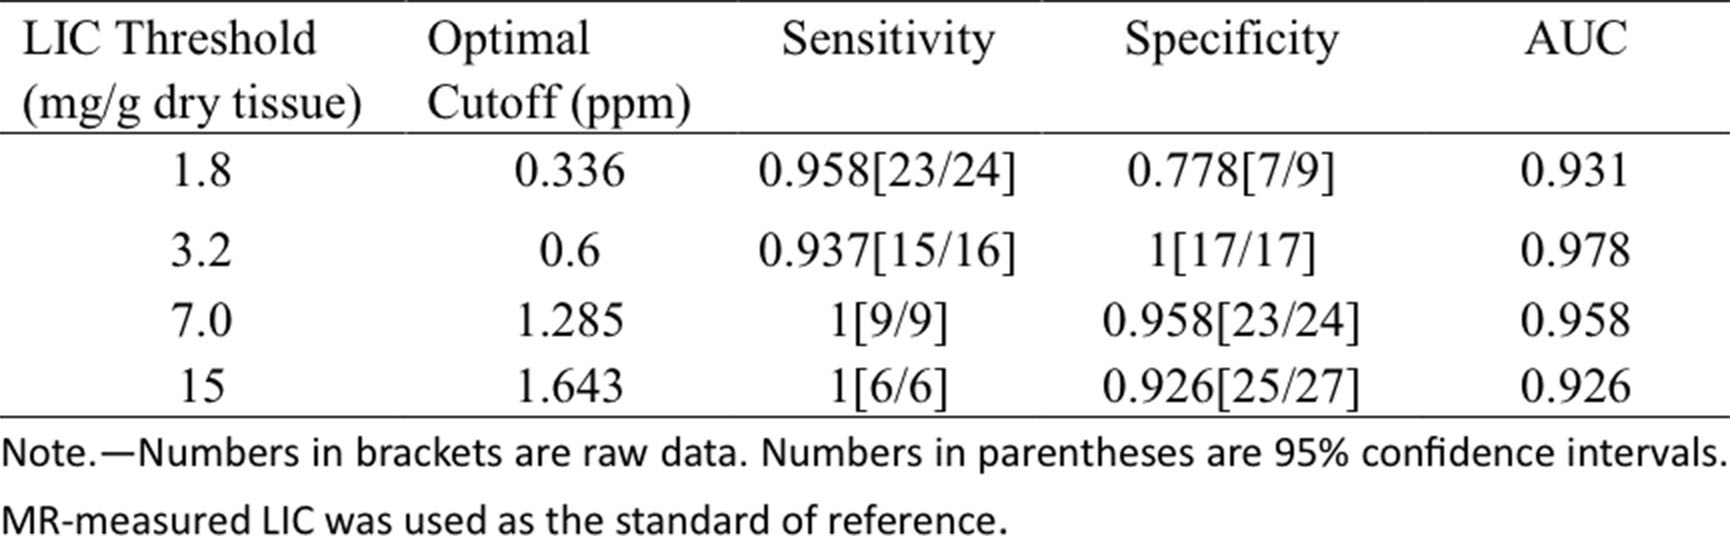
Fig.2 shows exemplary images and parameter maps for three subjects with different levels of liver iron concentration. Liver susceptibility value increased with increasing iron overload, which is confirmed by Ferriscan LIC. The scatterplot showed a better linear fit below the level of 15 mg/g Fe in dry tissue. Significant positive correlation was observed between QSM and Ferriscan-based iron measurements(r= 0.924). ROC analysis revealed that QSM could accurately grade LIC (Table 1). QSM showed good stratified diagnostic performance, especially at the grading level 3.2 mg/g Fe in dry tissue (AUC= 0.978).
Discussion & Conlusion
In this study, a chemical shift removal technique combined with a recently developed two-level STAR-QSM method was used, which allowed reducing the artifacts and allowed high-quality susceptibility maps of human liver. In our study, we have demonstrated that liver susceptibility had good performance in the quantitation and grading of low and moderate liver iron overload. The reason why QSM did not work as expected for heavy LIC patients in our study might be that the echo times of the measurement sequence were too long. Further study will be conducted to improve the overall diagnostic accuracy of QSM by shortening echo times.
In conclusion, high-quality QSM maps may allow reliable estimates and
grading of iron deposition in the liver.
Acknowledgements
The study was supported by the Chinese National Science Foundation No. 8167070289.References
1. Brittenham GM, Badman DG. Noninvasive measurement of iron: report of an NIDDK workshop. Blood 2003;101(1):15-19.
2. Li W, Wu B, Batrachenko A, Bancroft-Wu V, Morey RA, Shashi V, Langkammer C, Bellis MD, Ropele S, Song AW. Differential developmental trajectories of magnetic susceptibility in human brain gray and white matter over the lifespan. Human brain mapping 2014;35(6):2698-2713.
3. Liu C, Wei H, Gong N-J, Cronin M, Dibb R, Decker K. Quantitative Susceptibility Mapping: Contrast Mechanisms and Clinical Applications. Tomography: a journal for imaging research 2015;1(1):3.
4 Samir D. Sharma, Diego Hernando, Debra E. Horng, Scott B. Reeder. Quantitative Susceptibility Mapping in the Abdomen as an Imaging Biomarker of Hepatic Iron Overload.Magnetic Resonance in Medicine 2015;74:673–683.
5. Li W, Wu B, Avram AV, Liu C. Magnetic susceptibility anisotropy of human brain in vivo and its molecular underpinnings. Neuroimage 2012;59(3):2088-2097.
6.Wei H, Dibb R, Zhou Y, Sun Y, Xu J, Wang N, Liu C. Streaking artifact reduction for quantitative susceptibility mapping of sources with large dynamic range. NMR in Biomedicine 2015;28(10):1294-1303. 7.Wei H, Zhang Y, Gibbs E, Chen NK, Wang N, Liu C. Joint 2D and 3D phase processing for quantitative susceptibility mapping: application to 2D echo-planar imaging. NMR in Biomedicine 2016.
Figures