1994
Correlation between incidental fat deposition in the liver and pancreas in asymptomatic patients1The Russell H. Morgan Department of Radiology and Radiological Sciences, Johns Hopkins Hospital, Baltimore, MD, United States, 2The Russell H. Morgan Department of Radiology and Radiological Sciences, Johns Hopkins Hospital, 3Siemens Healthcare, Baltimore, MD, USA
Synopsis
Liver steatosis is the most common parenchymal liver disease in Western Countries and it may progress to steatohepatis, fibrosis and cirrhosis. Also, fat deposition in liver and pancreas can cause diabetes by increasing resistance to insulin. Magnetic Resonance Spectroscopy (MRS) has been shown to strongly correlate with histology in liver fat quantification. However, MRS has some limitations such as breathing artifact and difficulties in avoiding vessels or bile ducts within the voxel. So, it is desirable to utilize a novel and robust imaging technique that can screen for the presence of fat in the liver and pancreas.
Purpose
Fat deposition in the liver can lead to cirrhosis, diabetes and metabolic disorders. Approximately 20% of the United States population have non-alcoholic fatty liver and its prevalence is increasing1. Fat quantification on MRS has been shown to strongly correlate with histology. However, MRS has some limitations such as motion and breathing artifact especially in the left lobe. Also, voxel placement can be challenging if vessels and bile ducts are to be avoided. In addition, obtaining a representative tissue may require more than one voxel acquisition given the potential heterogeneity of fat deposition, so the technique may be time-consuming2. Therefore, finding an alternative method for early detection of fat deposition in the liver could potentially have widespread applications in screening patients with abnormal liver function. In this study, we aimed to explore the utility of 2 different fat quantification methods in the liver and pancreas in a group of healthy liver donor patients. We also sought to compare fat deposition in the liver to that in the pancreas in the same cohort of patients.Method:
This prospective IRB-approved and HIPPA compliant study included 58 healthy potential liver donors without previous history of steatosis (33 males, 25 females; mean age 40 yo) who underwent a comprehensive abdominal 3T MRI. Sequences included two single voxel MRS, one within the right lobe and one in the left lobe, and dual and multi-echo VIBE DIXON that covered the upper abdomen. Fat volume fraction of the liver (LFVF) and pancreas (PFVF) was obtained by drawing three ROI’s in liver (two in the same place of MRS voxels in right and left lobe and also the middle lobe) and the pancreas (head, body, tail) on dual and multi-echo VIBE DIXON sequences (Fig 1). The correlation between fat deposition in the liver on dual-echo Dixon and multi-echo Dixon was calculated, with fat content on MRS as the gold standard. Correlation of fat deposition between dual-echo Dixon and multi-echo Dixon in the pancreas was also calculated. Subsequently, the correlation between fat deposition in the liver and pancreas was calculated using both sequences. Logistic regression analysis was performed to test independent risk factors of fat deposition in the liver and pancreas including age, sex and BMI. Patients were also stratified as those with normal LFVF (<= 6 %) and those with mild steatosis (6%< LFVF <33%)3 based on MRS. ROC analysis was utilized to calculate the accuracy of dual and multi echo Dixon in differentiating between the 2 groups.Results:
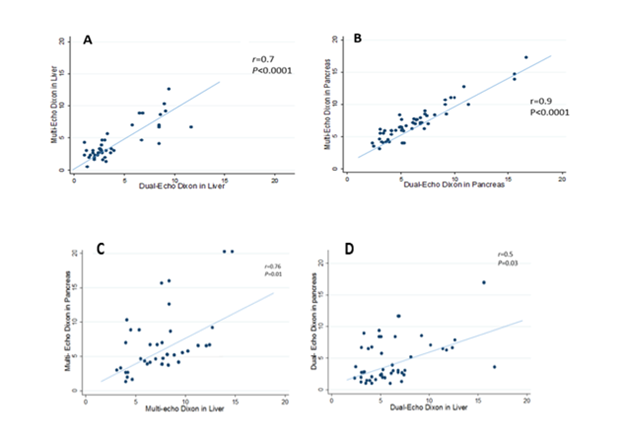
Mean LFVF was 5.9±3.1 % by MRS, 5.1± 4.1 % by dual-echo Dixon and 5.2± 4.2 % by multi-echo Dixon. Two by two paired T-test between the three sequences was not statistically significant. Dual-echo Dixon and multi-echo Dixon showed good correlation in LFVF quantification (r=0.7, p<0.0001) (Figure 2, A). Mean PFVF was 7.1 ± 2.2 % by dual-echo Dixon and 6.1± 3.1 %, by multi-echo Dixon. Paired T-test between the two sequences was not statistically significant (p= 0.1). Dual-echo Dixon and multi-echo Dixon showed good correlation in PFVF (r=0.9, p<0.0001) (Figure 2, B). In the comparison between mean LFVF and PFVF dual-echo Dixon showed moderate correlation (r=0.59, p=0.025), while multi-echo Dixon showed good correlation (r=0.76, p=0.01) (Figure 2, C and E). Univariant logistic regression showed no significant relationship between independent fat deposition risk factors (age, sex, BMI) and PFVF or LFVF. Subgroup analysis to determine the accuracy of both sequences in differentiating normal and mild fat deposition in the liver showed 83% sensitivity, 96% specificity and 89% accuracy for multi echo Dixon and 76% sensitivity, 80% specificity and 79% accuracy for dual echo Dixon.Conclusion:
LFVF had good correlation with PFVF using multi-echo Dixon. Multi-echo Dixon in liver has high accuracy in distinguishing between subjects with normal liver fat versus those with mildly elevated liver fat. Multi-echo Dixon can potentially be used to screen for early fat deposition in the liver or pancreas.Acknowledgements
This research was supported by Siemens Healthcare.]. We are thankful to our colleagues {Fatemeh Sobhani and Neda Rastegar} who assisted us in starting this research study.References
1. Hamaguchi M, Kojima T, Takeda N, Nakagawa T, Taniguchi H, Fujii K, Omatsu T, Nakajima T, Sarui H, Shimazaki M, Kato T, Okuda J, Ida K. The metabolic syndrome as a predictor of nonalcoholic fatty liver disease. Ann. Intern. Med. 2005; 143 (10): 722–8.
2. Qayyum A. MR spectroscopy of the liver: principles and clinical applications. Radiographics. 2009;29(6):1653-64. Gangadhar K, Chintapalli KN, Cortez G, Vinu Nair S. MRI evaluation of fatty liver in day to day practice: Quantitative and qualitative methods. The Egyptian Journal of Radiology and Nuclear Medicine. 2014; 45: 619–626.
3. Gangadhar K, Chintapalli KN, Cortez G, Vinu Nair S. MRI evaluation of fatty liver in day to day practice: Quantitative and qualitative methods. The Egyptian Journal of Radiology and Nuclear Medicine. 2014; 45: 619–626.
Figures
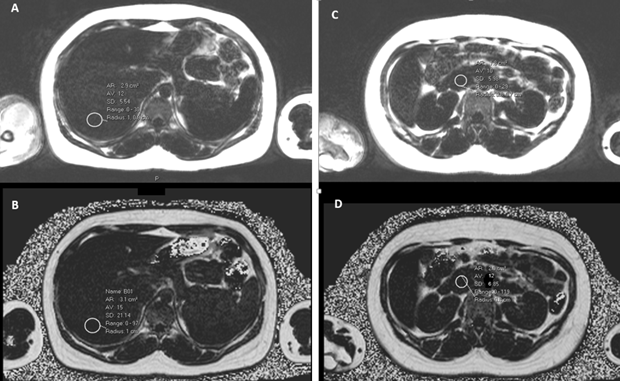
Fig 1. Example of fat quantification in Liver (left) and Pancreas (right) on Dual-Echo Dixon (A, C) and Multi-Echo Dixon (B, D) sequences.