1993
Spectroscopy-Based R2 Relaxometry for Liver Iron Quantification at 1.5T and 3.0T1Radiology, University of Wisconsin-Madison, Madison, WI, United States, 2Medical Physics, University of Wisconsin-Madison, Madison, WI, United States, 3School of Automation Engineering, University of Electronic Science and Technology of China, Chengdu, People's Republic of China, 4School of Biomedical Engineering and Guangdong Provincial Key Laboratory of Medical Image Processing, Southern Medical University, Guangzhou, People's Republic of China, 5Medicine, University of Wisconsin School of Medicine and Public Health, WI, United States, 6Radiology, University of Texas-Southwestern, Dallas, TX, United States, 7Advanced Imaging Research Center, University of Texas-Southwestern, Dallas, TX, United States, 8Biomedical Engineering, University of Wisconsin-Madison, Madison, WI, United States, 9Medicine, University of Wisconsin-Madison, Madison, WI, United States, 10Emergency Medicine, University of Wisconsin-Madison, Madison, WI, United States
Synopsis
R2-based techniques for liver iron quantification using Spin-Echo (SE) imaging require long acquisitions. In contrast, single-voxel Stimulated-Echo Acquisition Mode (STEAM)-MR spectroscopy enables liver R2 measurements in a single breath-hold. However, the accuracy and field strength dependence of STEAM-MRS R2 quantification are unknown. This study evaluated the accuracy and field strength dependence of STEAM-MRS for R2 quantification in healthy controls and patients with liver iron overload. At 1.5T, STEAM-MRS R2 was in close agreement with SE-MRI-based R2. Further, STEAM-MRS R2 measurements were highly correlated across field strengths. Finally, STEAM-MRS R2 measurements at 1.5T and 3.0T were calibrated to liver iron concentration.
Purpose
R2 relaxometry enables accurate quantification of iron overload. However, current techniques based on Spin-Echo (SE) imaging require long acquisitions (10-20minutes) and suffer from severe motion artifacts. In contrast, single-voxel Stimulated Echo Acquisition Mode (STEAM)-MR spectroscopy with multiple short TEs can be performed in a single breath-hold, enabling rapid localized measurement of R2 1,2. However, the accuracy of STEAM-MRS based R2 quantification, as well as its field strength dependence, are unknown. Therefore, the purpose of this study was to evaluate the accuracy and field strength dependence (1.5T and 3.0T) of single breath-hold STEAM-MRS for R2 quantification in healthy controls and patients with liver iron overload.Methods
Subjects: After IRB approval and informed written consent, 10 healthy volunteers (5M/5F, age=41.0±15.3 years) and 39 patients (27M/12F, age=43.9±21.1 years) with varying levels of liver iron overload were recruited for scanning at 1.5T and 3.0T (GE Healthcare, Waukesha, WI) on the same day.
MR protocol: At each field strength, a single-voxel STEAM-MRS acquisition was performed in the right liver lobe, in a single breath-hold with the following acquisition parameters: voxel size=20×20×20-30×30×30mm3, mixing time (TM)=5ms, spectral width=5kHz, 2048 samples, TR=3500ms, acquisition time=18. Multiple echo times (TE = 10,15,20,25,30ms) were acquired during this time to enable measurement of R2 of the water signal in the liver. Further, multi-echo SE-MRI data were acquired at 1.5T using the acquisition protocol for FerriScan (Resonance Health, Claremont, Australia) quantification of liver iron concentration (LIC). This was performed using an axial two-dimensional multi-slice SE sequence during 18 min free-breathing. Acquisition parameters included: readout direction R/L, 44 cm field of view, 256x256 matrix, 6 mm slice thickness, 11 slices, ±62.5 kHz receiver bandwidth, TR = 1000 ms, and five separate TEs (6, 9, 12, 15, and 18 ms).
Data processing: STEAM-MRS data were processed offline using a previously reported method to estimate monoexponential R2 of water by jointly fitting the acquired spectra using Voigt line shapes for the water and multiple fat peaks3. In order to avoid noise bias in subjects with higher liver iron levels, STEAM-MRS data from normal controls at both field strengths was processed using all five acquired echoes, 1.5T data from patients was processed using the first three acquired echoes and 3.0T data from patients was processed using the first three echoes if 1.5T STEAM R2<80, and using the first two echoes otherwise. R2 mapping from SE-MRI data was performed offline using voxel-wise least-squares monoexponential fitting. Region-of-interest (ROI) R2 measurements were placed on the right liver lobe in a single slice while avoiding excessive motion artifacts due to the free-breathing acquisition. Further, SE-MRI data were submitted to Resonance Health (Claremont, Australia) for FerriScan-LIC quantification4.
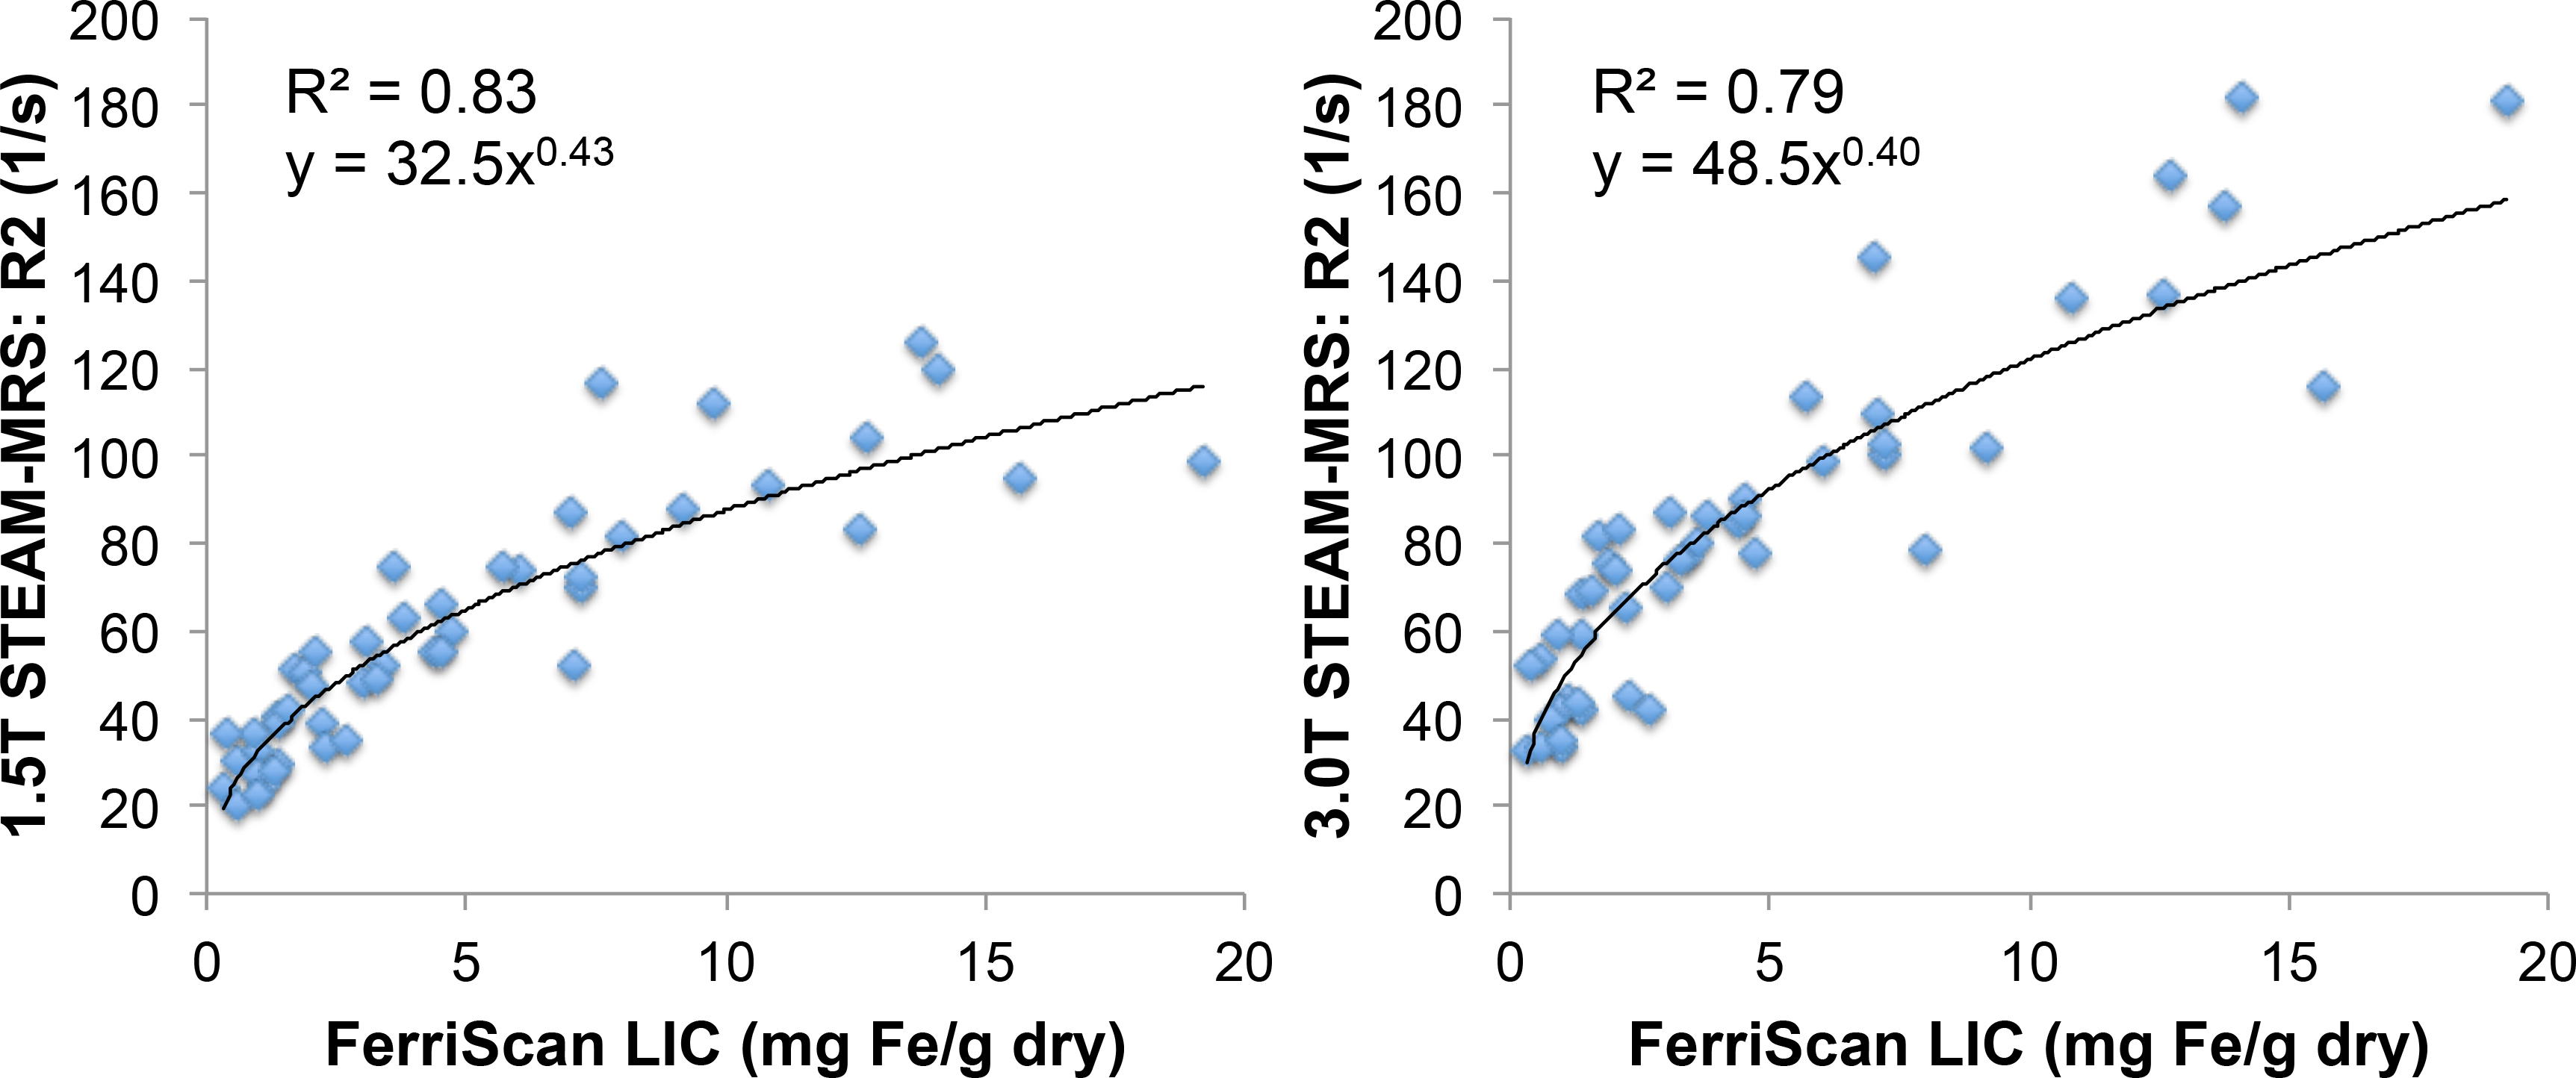
Data analysis: Using Deming regression analysis5, 1.5T SE-MRI R2 measurements were compared to 1.5T STEAM-MRS R2 measurements, and STEAM-MRS R2 measurements were compared across field strengths. Finally, the nonlinear relationship4 between FerriScan-LIC and STEAM-MRS based R2 measurements at 1.5T and 3T was calibrated using a power equation.
Results
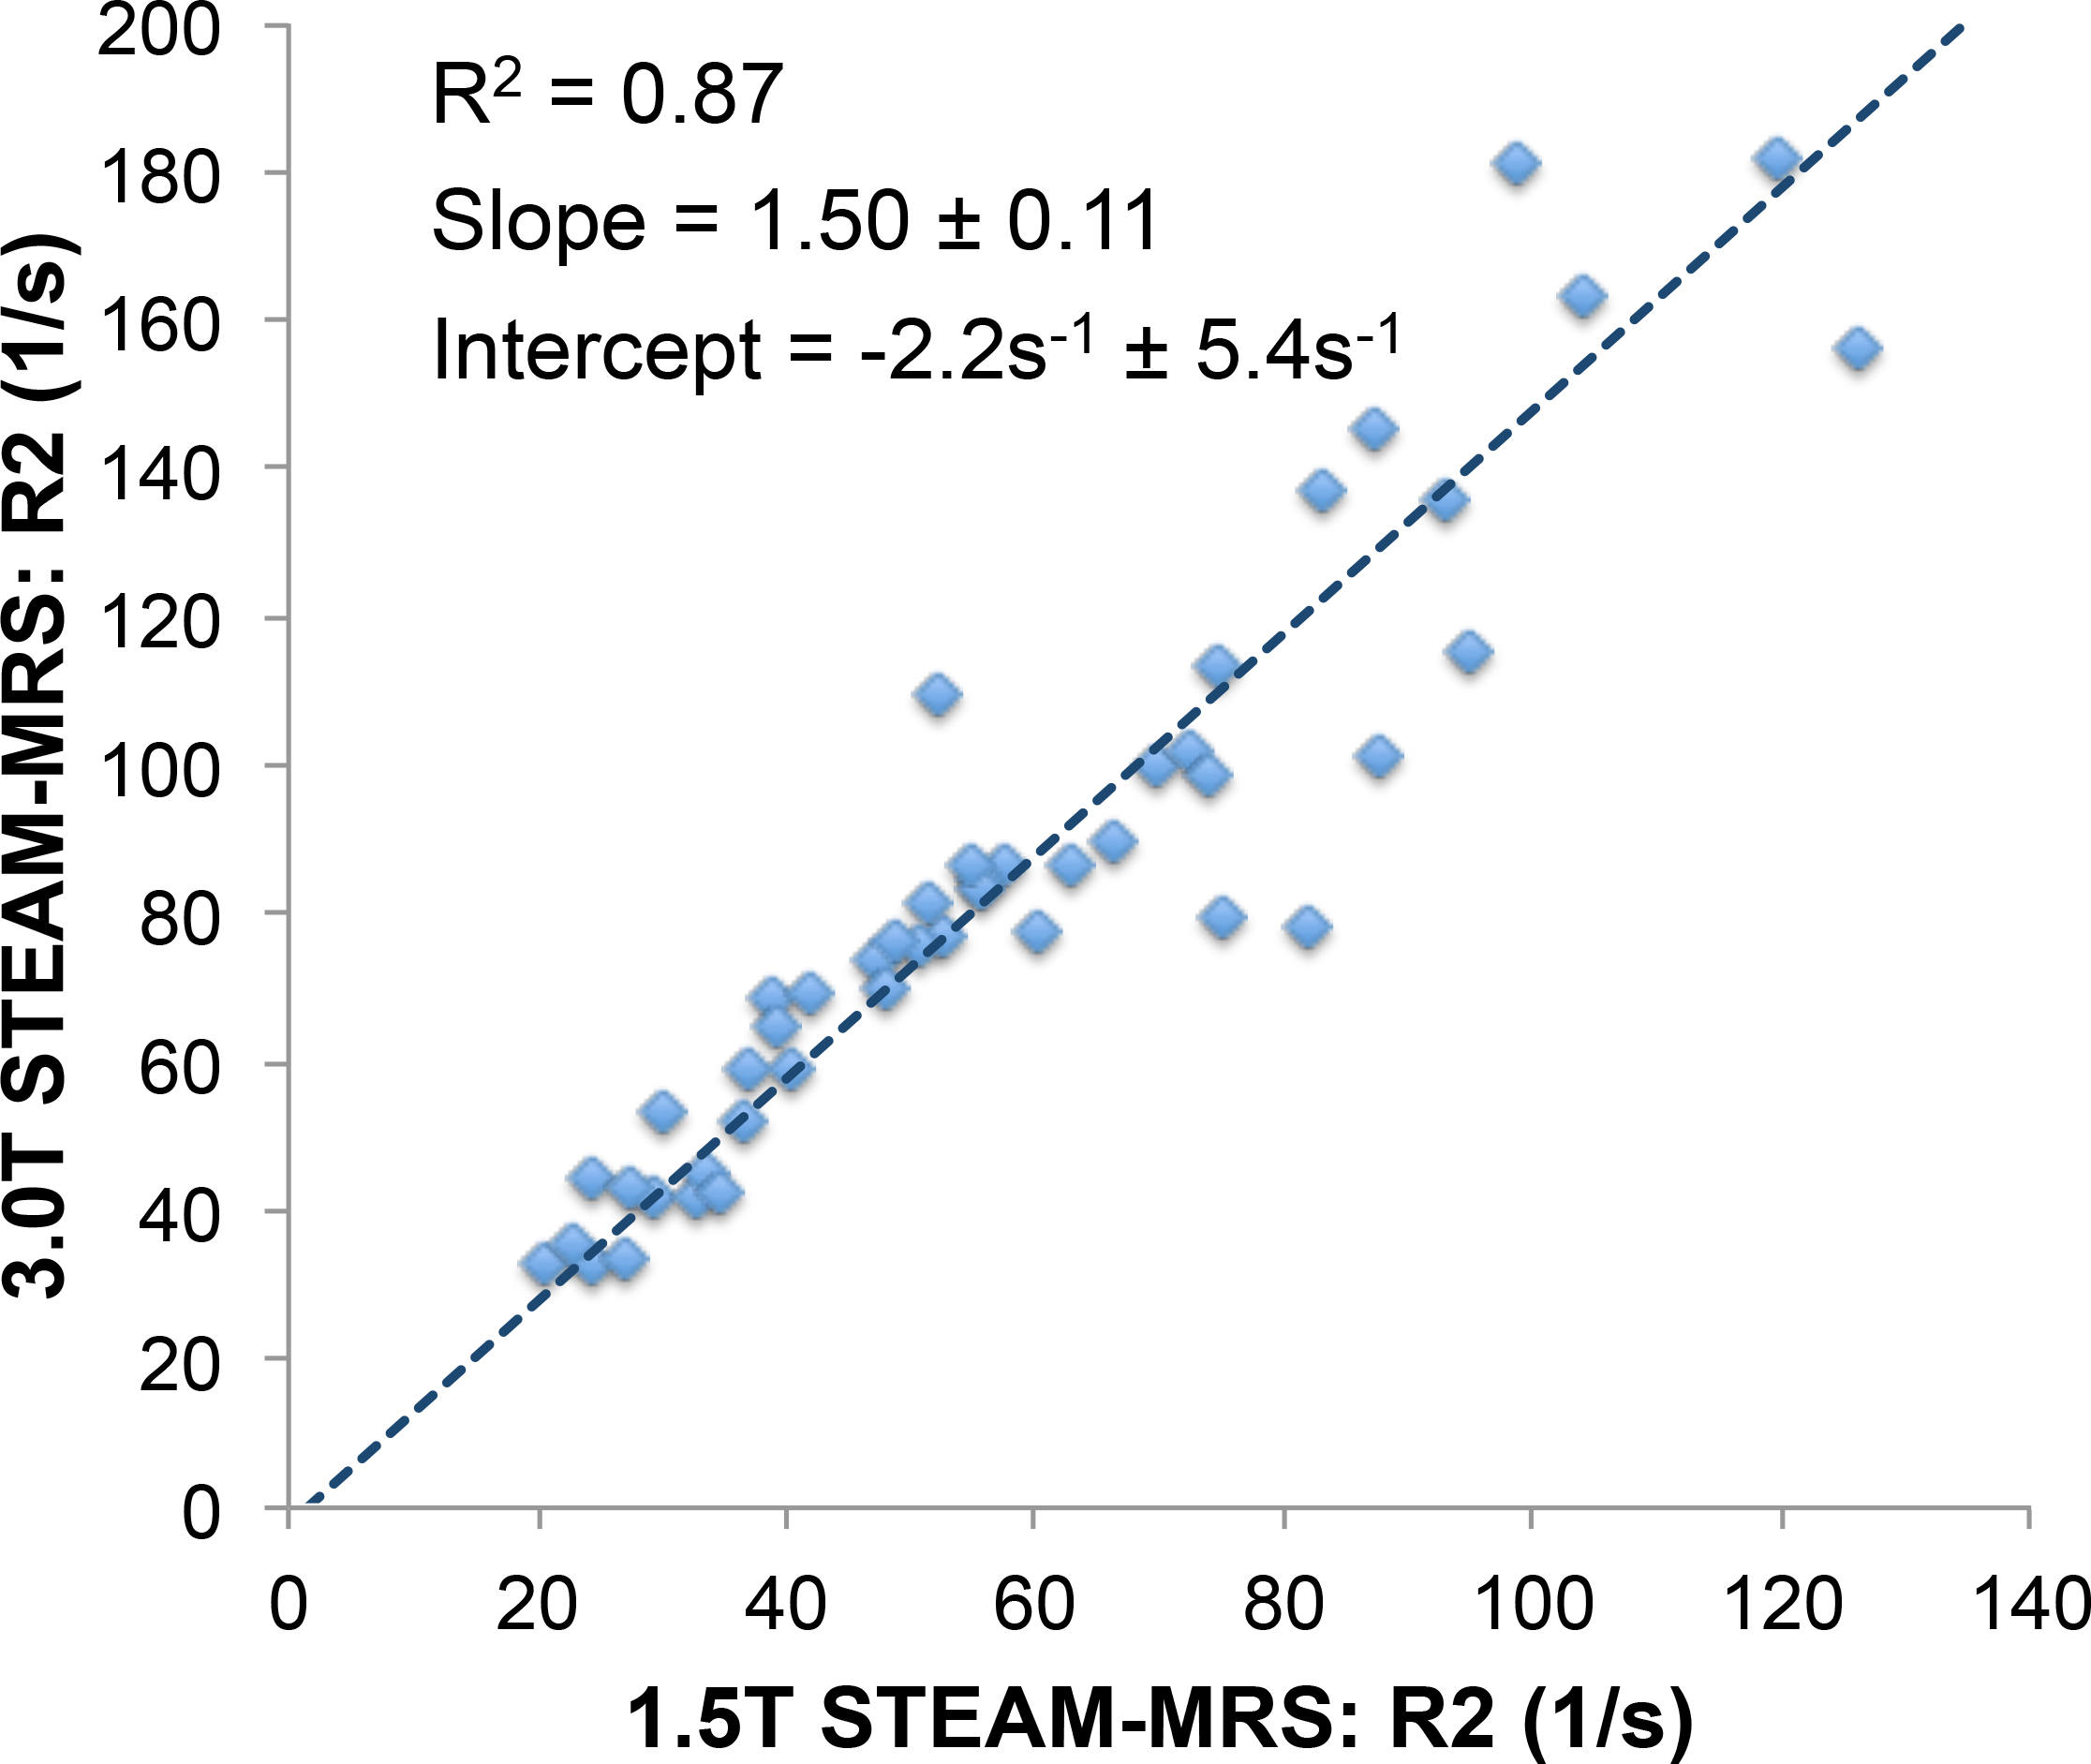
STEAM-MRS data at 1.5T from one subject was not available due to technical failure, and STEAM-MRS data at 3.0T from two subjects was discarded due to excessive artifacts. Figure 1 shows representative spin-echo images and multi-TE spectra in subjects with varying values of liver R2. Figure 2 demonstrates the excellent agreement (r2=0.87,slope=1.05±0.08,intercept=-6.2s-1±4.1s-1) between SE-MRI based R2 and STEAM-MRS based R2 at 1.5T. Figure 3 demonstrates the high correlation (r2=0.87,slope=1.50±0.11,intercept=-2.2s-1±5.4s-1) between R2 measured using STEAM-MRS based at 1.5T vs 3.0T. Figure 4 demonstrates the nonlinear calibration between FerriScan-LIC and R2 measured from STEAM-MRS at both 1.5T and 3.0T.Discussion and Conclusion
STEAM-MRS R2 relaxometry for liver iron quantification is feasible at 1.5T and 3.0T. Importantly, 1.5T STEAM-MRS R2 measurements are in close agreement with 1.5T SE-MRI R2 measurements (both using a mono-exponential fitting model), and STEAM-MRS R2 measurements are highly correlated across field strengths. Further, the slope of the relationship between STEAM-MRS R2 at 1.5T vs 3.0T is in good agreement with previous theoretical predictions and measurements using SE-MRI6,7. Despite its rapid acquisition time and high SNR, the dynamic range of STEAM-MRS for liver iron quantification is likely limited by the minimum achievable TE (10ms on our systems). In this study, STEAM acquisitions with a short TM (5ms) resulted in close agreement with spin echo-based R2 measurements. However, the effect of with varying TMs on STEAM-based R2 relaxometry remains to be explored and may provide further insights into the deposition of liver iron.
In conclusion, single-voxel STEAM-MRS may provide a method for rapid R2-based liver iron quantification at 1.5T and 3.0T.
Acknowledgements
The authors acknowledge the support of the NIH (grants R01-DK088925, R01-DK100651, and K24-DK102595), and the WARF Accelerator Program. We also thank GE Healthcare for their research support.References
1Hamilton G, Middleton MS, Bydder M, Yokoo T, Schwimmer JB, Kono Y, Patton HM, Lavine JE, Sirlin CB. Effect of PRESS and STEAM sequences on magnetic resonance spectroscopic liver fat quantification. J Magn Reson Imaging 2009;30(1):145-152.
2Sharma P, Kitajima HD, Zhong X, Kalb B, Martin DR. Compartmental Analysis of R2 measurements of Hepatic Lipid and Iron In Vivo using Breath-hold Multi-Echo 1H Spectroscopy (HISTO). Proceedings of the 19th Annual Meeting of ISMRM; Montreal, Canada. p. 2011.p. 738.
3Hernando D, Artz NS, Hamilton G, Roldan A, Reeder SB. Fully automated processing of multi-echo spectroscopy data for liver fat quantification. Proceedings of the 22nd ISMRM Scientific Meeting 2014. Milan, Italy 2014, p. 2884.
4St Pierre TG, Clark PR, Chua-anusorn W, Fleming AJ, Jeffrey GP, Olynyk JK, Pootrakul P, Robins E, Lindeman R. Noninvasive measurement and imaging of liver iron concentrations using proton magnetic resonance. Blood. 2005 Jan 15;105(2):855-861.
5Deming WE. Statistical adjustment of data. John Wiley (New York), 1943.
6Guo H, Au WY, Cheung JSet al. Myocardial T2 quantitation in patients with iron overload at 3 Tesla. J Magn Reson Imaging 2009;30(2):394-400.
7Ghugre NR, Doyle EK, Storey P, Wood JC. Relaxivity-iron calibration in hepatic iron overload: Predictions of a Monte Carlo model. Magn Reson Med. 2015 74(3):879-883.
Figures