1992
Quantification of Hepatic Fat Fraction and Liver/Spleen R2* in a Healthy Cohort at 3 Tesla1School of Medicine, Dalhousie University, Halifax, NS, Canada, 2Biomedical Translational Imaging Centre, QEII Health Sciences Centre, Halifax, NS, Canada, 3Department of Diagnostic Radiology, Dalhousie University, Halifax, NS, Canada
Synopsis
Non-invasive quantification of hepatic fat and iron with MRI has generated increasing clinical interest, particularly given the prevalence of chronic liver disease. Elevated R2* is a biomarker of iron deposition in the liver and spleen. The normative distribution of R2* in these organs at 3T is not well described, but is necessary for confident diagnosis of mild to moderate levels of iron deposition. Based on measurements in 97 adults selected from the general population, we confirm that ~20% have fatty liver and suggest that a hepatic R2* > 89 s-1 and splenic R2* > 69 s-1 can be considered abnormal.
Introduction
Accurate, non-invasive quantification of hepatic fat and iron with MRI has generated increasing clinical interest, particularly given that non-alcoholic fatty liver disease (NAFLD) is the most common cause of hepatic dysfunction worldwide and is predicted to become the number one indication for liver transplant in Western society 1. Studies have shown that up to one third of patients with NAFLD have increased stainable hepatic iron at histopathology 2. NAFLD associated with iron overload is correlated with increased fibrosis and progression to cirrhosis with subsequent increased risk for development of hepatocellular carcinoma 3. Other chronic liver diseases such as hemochromatosis, viral hepatitis and alcoholic liver disease have also been associated with increased hepatic iron and/or fat deposition 4-6. In conditions such as transfusional iron overload and hemolytic anemias, the spleen also accumulates iron and hence splenic R2* is also of interest.
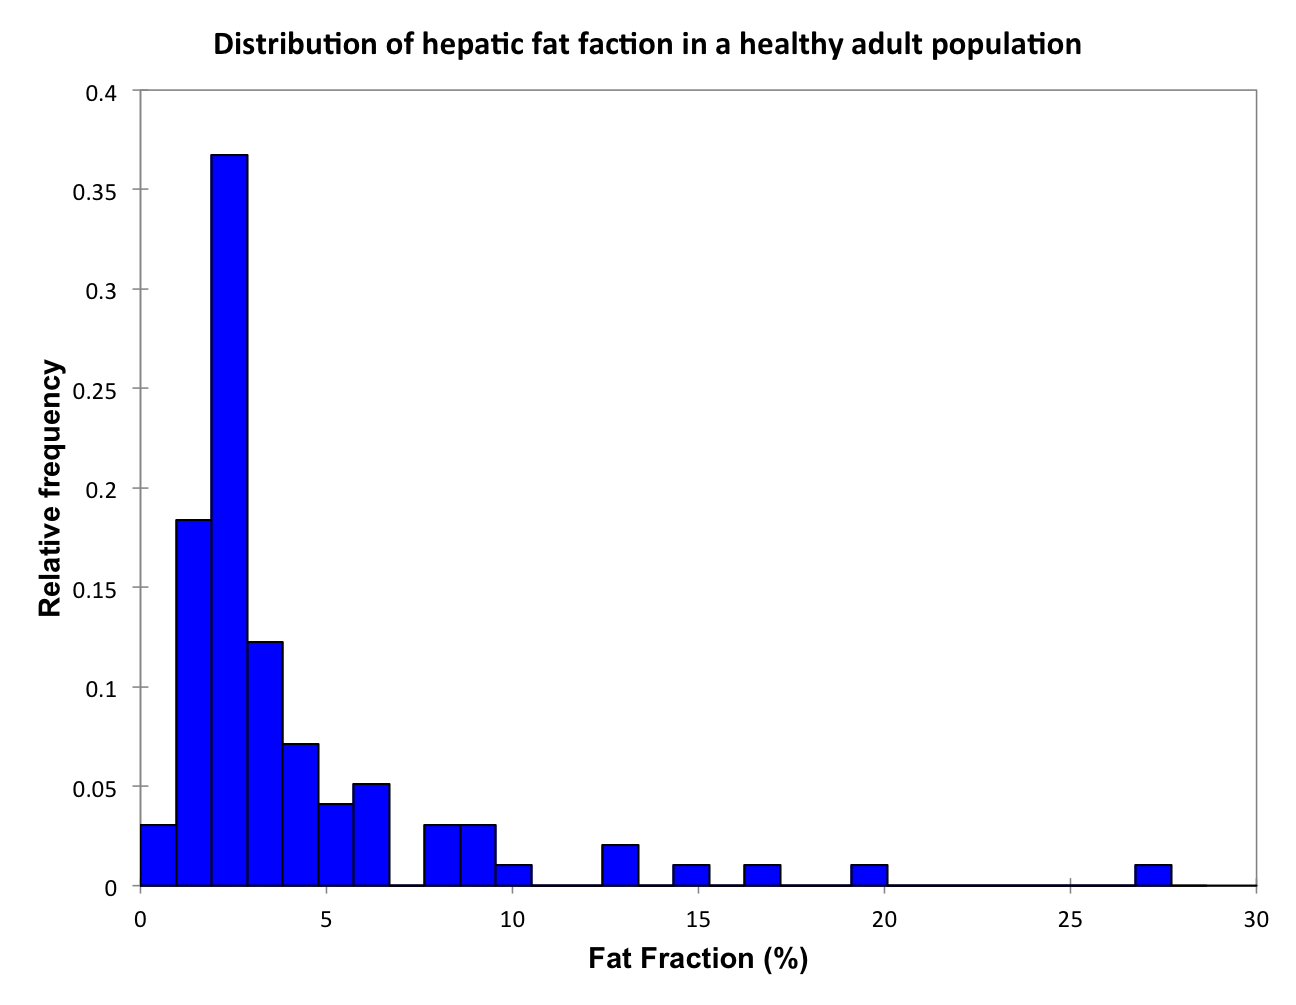
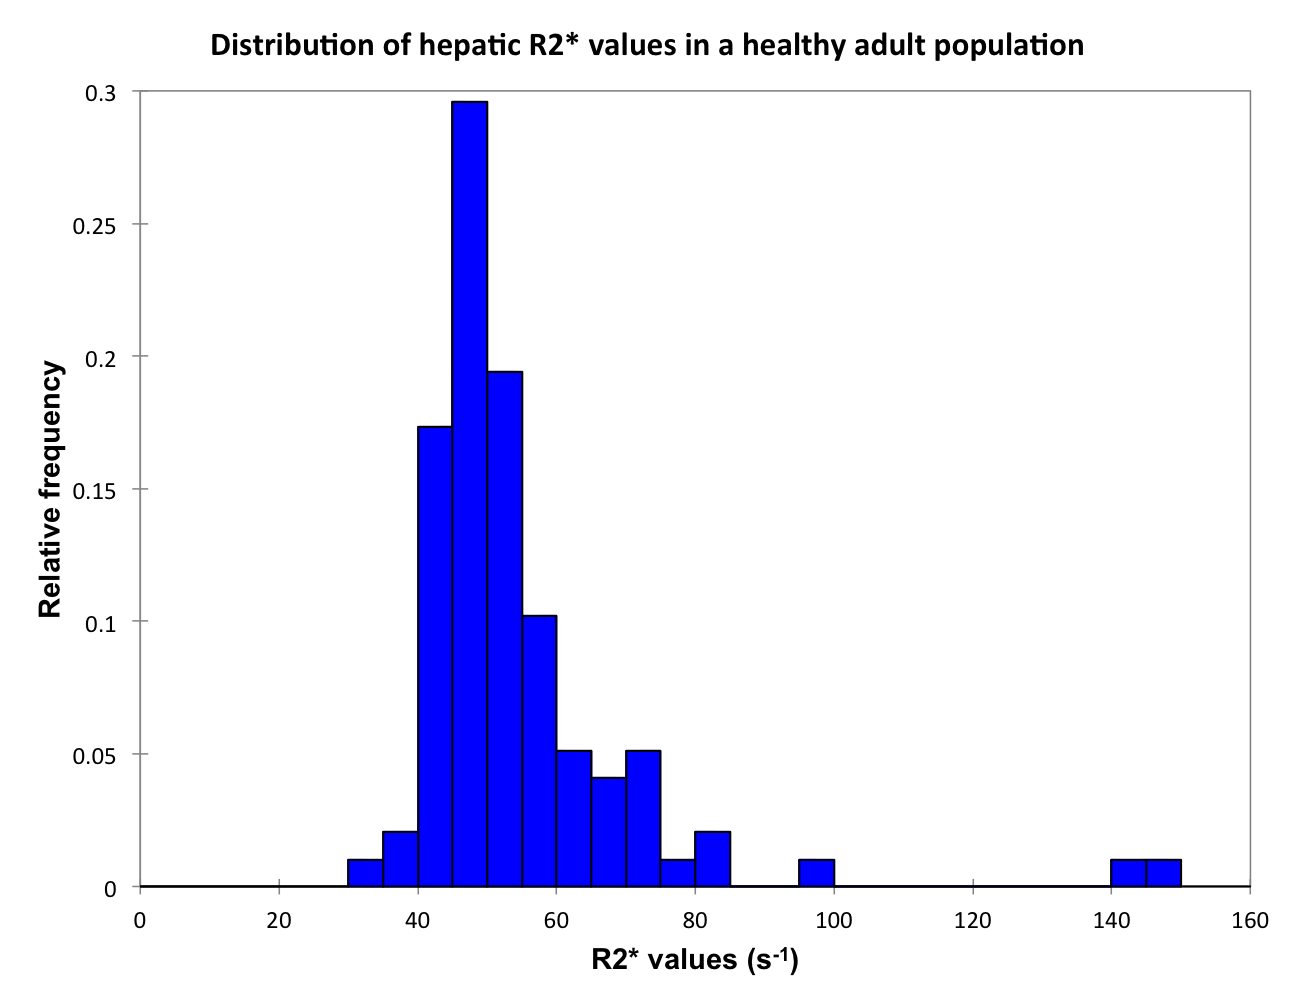
MRI techniques have been developed for simultaneous measurement of proton density fat fraction (PDFF) and R2*, a biomarker for iron deposition 7. Although the PDFF of a normal liver is widely accepted to be 5% or below 8, the normative distribution of hepatic and splenic R2* values at 3T are less well described. In order for the mild to moderate levels of iron deposition associated with chronic liver disease to be diagnosed with confidence, normative values for R2* must be established.
The purpose of our study was to 1) determine the proportion of the local general population with hepatic steatosis; and 2) characterize the distribution of hepatic and splenic R2* values at 3T in the same cohort.
Methods and Analysis
As part of an ongoing study, a cohort of 97 adults from the general population were recruited through Atlantic PATH for this institutional ethics review board-approved study. Subjects underwent abdominal imaging on a 3T GE MR750 system (GE Healthcare, Milwaukee, WI) using a 32-channel torso array RF coil with the upper 18 elements enabled. The commercially available pulse sequence IDEAL-IQ (Iterative Decomposition of water and fat with Echo asymmetry and Least Square Estimation) was used to obtain PDFF and R2* maps of the liver in a single breath-hold. Acquisition parameters: TR 13.7 ms, bandwidth +61.25 kHz, FOV 40 cm, 256 x 128, 2 x 2 acceleration, slice thickness 10 mm.
Circular regions of interest were drawn on the PDFF map by a single trained observer on each of the nine Couinaud segments of the liver and in the central spleen, and then duplicated onto the R2* map. Correlation between hepatic PDFF and R2* was evaluated using linear regression and population results for PDFF and R2* were characterized using descriptive statistics.
Results
The study population consisted of 50 men (average age 60.5 years; range 42-74 years) and 47 women (average age 59.3 years; range 42-73 years). The average body mass index was 26.7; range 16.3-41.7. 19 out of 97 subjects (19.6%) had a fatty liver (95% CI for proportions: 12.9-28.6%). Histograms of PDFF, hepatic R2* and splenic R2* are displayed in Figures 1-3. The average, range, median and standard deviation for the hepatic PDFF, hepatic R2* and splenic R2* are presented in Table 1. Linear regression found no significant correlation between liver R2* and PDFF (r2=0.0638).Discussion
Recruitment is ongoing and we will have over 300 subjects by study closure in March 2017. Thus far, the average hepatic R2* value at 3T in our study, 55 + 17 s-1, is similar to Sofue et al. 9 (51 + 25 s-1) despite the fact that their study population included subjects with chronic liver disease. Schwenzer et al. 10 measured T2* in 129 normal volunteers at 1.5T and found hepatic and splenic R2* of 35.6 s-1 and 22.8 s-1, respectively, indicating that R2* values at 3T are not simply double those at 1.5T. 19% of subjects had fatty liver, in keeping with the prevalence reported in other studies 11,12. Notably, the two subjects with the highest liver R2* (>130 s-1) were not the same two subjects with the highest PDFF (>20%). We propose that an R2* greater than 2 standard deviations (SD) above the mean be considered abnormal. Lack of significant correlation between liver R2* and PDFF suggests that fat and iron deposition may be independent processes in the general population; however, further study is required before conclusions can be drawn.Conclusion
Based on our data thus far, it is reasonable to suggest that a hepatic R2* > 89 s-1 and a splenic R2* > 69 s-1 at 3T (2 SD above the mean), can be considered abnormal and may represent increased iron deposition.Acknowledgements
Funding provided by Dalhousie University Research in Medicine program.References
1. Canbay A, Sowa J-P, Syn W-K, et al. NASH Cirrhosis - the New Burden in Liver Transplantation: How Should It Be Managed? Visc Med. 2016;32(4):234–238.
2. Nelson JE, Wilson L, Brunt EM, et al. Relationship between the pattern of hepatic iron deposition and histological severity in nonalcoholic fatty liver disease. Hepatology. 2010;53(2):448–457.
3. Nelson JE, Klintworth H, Kowdley KV. Iron Metabolism in Nonalcoholic Fatty Liver Disease. Curr Gastroenterol Rep. 2011;14(1):8–16.
4. Corradini E, Pietrangelo A. Iron and steatohepatitis. J Gastroenterol Hepatol. 2012;27:42–46.
5. Sebastiani G, Vario A, Ferrari A, et al. Hepatic iron, liver steatosis and viral genotypes in patients with chronic hepatitis C. J Viral Hepat. 2006;13(3):199–205.
6. Valenti L, Fracanzani AL, Bugianesi E, et al. Clinical advances in liver, pancreas, and biliary tract. YGAST. 2010;138(3):905–912.
7. Yu H, Shimakawa A, McKenzie CA, et al. Multiecho water-fat separation and simultaneous R2* estimation with multifrequency fat spectrum modeling. Magn. Reson. Med. 2008;60(5):1122–1134.
8. Brunt EM. Pathology of fatty liver disease. Mod Pathol. 2007;20(1s):S40–S48.
9. Sofue K, Mileto A, Dale BM, et al. Interexamination repeatability and spatial heterogeneity of liver iron and fat quantification using MRI-based multistep adaptive fitting algorithm. J. Magn. Reson. Imaging. 2015;42(5):1281–1290.
10. Schwenzer NF, Machann J, Haap MM, et al. T2* relaxometry in liver, pancreas, and spleen in a healthy cohort of one hundred twenty-nine subjects-correlation with age, gender, and serum ferritin. Invest Radiol. 2008;43(12):854–860.
11. Beaton MD. Current treatment options for nonalcoholic fatty liver disease and nonalcoholic steatohepatitis. Can. J. Gastroenterol. 2012;26(6):353–357.
12. Chalasani N, Younossi Z, Lavine JE, et al. The diagnosis and management of non-alcoholic fatty liver disease: Practice Guideline by the American Association for the Study of Liver Diseases, American College of Gastroenterology, and the American Gastroenterological Association. Hepatology. 2012;55(6):2005–2023.
Figures