1987
Improved Measurement Precision for AACID CEST MRI of Brain pH using the 2 ppm Amine Resonance1Department of Medical Biophysics, University of Western Ontario, London, ON, Canada, 2The Centre for Functional and Metabolic Mapping, Robarts Research Institute, University of Western Ontario, London, ON, Canada
Synopsis
The chemical exchange saturation transfer (CEST) method called Amine and Amide
Purpose:
In cancer, altered intracellular and extracellular pH gradients can lead to drug resistance. Chemical exchange saturation transfer (CEST) can produce image contrast that is dependent on tissue pH. We have previously demonstrated that the ratio of the 3.5 ppm amide CEST effect to the 2.75 ppm amine CEST effect varies linearly with pH in the physiological range and is largely independent of protein concentration and temperature.1 This CEST method called Amine and Amide Concentration Independent Detection (AACID)1 shows acidification of the brain following stroke,1 and increased pH in brain tumors.2,3 The method can also detect acute tumor acidification using pharmacologic agents.2,3 However in-vivo, the 2.75 amine CEST peak shows little response to changes in pH. In contrast, the 2.0 ppm amine peak is better defined and shows a greater in-vivo pH response. Therefore, use of the 2.0 ppm rather than the 2.75 ppm amine peak could increase the sensitivity of the AACID radiometric measurement.4 The purpose of this study was to compare the range and precision of AACID measurements made in-vivo in the mouse brain using the 2.75 ppm and 2.0 ppm amine resonances.Methods:
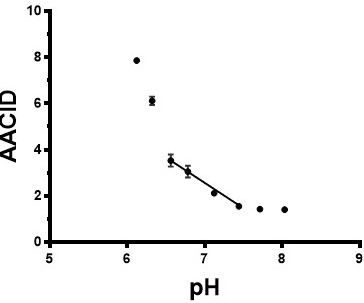
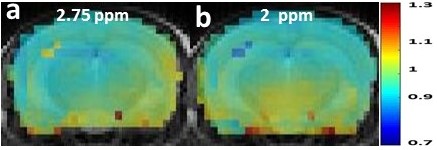
AACID was calculated using Equation 7 in McVicar et. al.1 To validate the use of the 2 ppm amine resonance in the AACID equation, we verified that the AACID response was linear over the physiological pH range. A series of protamine (EMD Millipore, Canada) phantoms were created in 5 mm diameter tubes with pH: 6.12, 6.32, 6.56, 6.78, 7.12, 7.44, 7.71, and 8.03. Protamine produces a 2 ppm amine CEST peak analogous to that observed in human brain.5 The phantoms contained protamine at a concentration 12 mg/ml dissolved in phosphate buffered saline. CEST images of all phantoms were acquired at 37 °C on an Agilent (Santa Clara, CA) 9.4T small animal MRI. CEST images (2 averages) were acquired using a fast spin-echo (FSE) pulse sequence (TR/TE = 7000/7 ms, ETL = 32, effective TE = 7 ms, FOV = 25.6 x 25.6 mm2, matrix size = 64 x 64, slice thickness = 2 mm) preceded by a continuous RF pulse with amplitude 1.5-µT and duration 4-seconds. The CEST images were acquired at different saturation frequencies (1.2 to 4.5 (∆=0.1) ppm, from 5.4 to 6.6 (∆=0.1) ppm. CEST images were also acquired in twenty four mice with U87MG brain tumors and in a transgenic Alzheimer’s model mouse (5XFAD). B0 correction was applied using the water saturation shift referencing (WASSR) technique.6 The range of AACID values in tumor and contralateral tissue were compared when using the 2.0 and 2.75 ppm amine resonance. The quality of in-vivo normalized AACID maps was assessed by comparing the AACID values across the entire brain slice.Results:
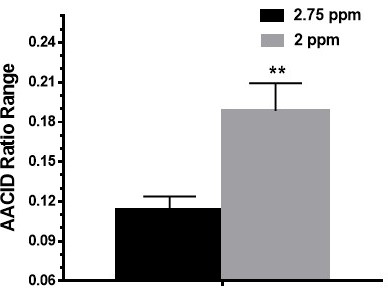
Figure 1 shows the relationship between the 2.0 ppm derived AACID value and pH and verifies that there is a linear response in the range from pH 6.6-7.4. The difference in AACID values between tumor and normal tissue with the 2 ppm amine resonance was 39% greater than that obtained with the 2.75 ppm resonance (Figure 2). Normalized AACID maps obtained for a mouse brain show greater symmetry when using the 2 ppm amine resonance (Figure 3b) compared to the 2.75 ppm amine resonance (Figure 3a).Discussion:
In the current study we used protamine phantoms to show a linear relationship between the AACID value and pH within the physiological pH range (6.6-7.4). Although not required, a linear relationship ensures that we can easily relate changes in the AACID value to changes in pH. This linear response is similar to that previously shown for the AACID value obtained when using the 2.75 ppm amine resonance in bovine serum albumin.1 When applying this measurement in vivo in mouse brain, the AACID measurement made using the 2 ppm amine resonance showed a significantly greater absolute difference in values between tumor and normal tissue compared to the AACID measurement made with the 2.75 ppm amine resonance. This increase is likely because the 2 ppm amine resonance is more prominent in the in-vivo CEST spectrum compared to the 2.75 ppm amine resonance and is more sensitive to change as a function of pH. Future work will evaluate the contribution of various metabolites to the 2 ppm amine resonance when using this particular saturation paradigm.Conclusion:
AACID CEST measurements sensitive to tissue pH have a greater range when using the 2 ppm amine CEST peak compared to the 2.75 ppm CEST peak. Therefore, use of the 2 ppm amine resonance could increase the precision of AACID based pH measurement in-vivo.Acknowledgements
We would like to thank Miranda Bellyou and Ashley Kirley for assistance with animal handling. Funding provided by the Ontario Institute for Cancer Research (OICR).References
1. McVicar, N., Li, A.X., Gonçalves, D.F., Bellyou, M., Meakin, S.O., Prado, M.A. and Bartha, R., 2014. Quantitative tissue pH measurement during cerebral ischemia using amine and amide concentration-independent detection (AACID) with MRI. Journal of Cerebral Blood Flow & Metabolism, 34(4), pp.690-698.
2. McVicar, N., Li, A.X., Meakin, S.O. and Bartha, R., 2015. Imaging chemical exchange saturation transfer (CEST) effects following tumor-selective acidification using lonidamine. NMR in biomedicine, 28(5), pp.566-575.
3. Marathe, K., McVicar, N., Li, A., Bellyou, M., Meakin, S. and Bartha, R., 2016. Topiramate induces acute intracellular acidification in glioblastoma. Journal of Neuro-Oncology, pp.1-8.
4. Desmond K, Stanisz G., 2013. pH mapping based on the ratiometric amide and amine relationship from endogenous CEST. Contrast Media Mol Imaging; 8: 301–302.
5. Bar-Shir, A., Liu, G., Chan, K.W., Oskolkov, N., Song, X., Yadav, N.N., Walczak, P., McMahon, M.T., van Zijl, P.C., Bulte, J.W. and Gilad, A.A., 2013. Human protamine-1 as an MRI reporter gene based on chemical exchange. ACS chemical biology, 9(1), pp.134-138.
6. Kim, M., Gillen, J., Landman, B.A., Zhou, J. and van Zijl, P., 2009. Water saturation shift referencing (WASSR) for chemical exchange saturation transfer (CEST) experiments. Magnetic resonance in medicine, 61(6), pp.1441-1450.
Figures