1986
Modeling the increased inhomogeneous magnetization transfer (ihMT) signal from high amplitude, low duty cycle irradiation1Radiology, Division of MR Research, Beth Israel Deaconess Medical Center, Harvard Medical School, Boston, MA, United States, 2Aix Marseille Univ, CNRS, CRMBM, Marseille, France
Synopsis
Pulsed implementations of RF saturation for MT and ihMT are dependent on the duty cycle of the MT pulse relative to its repetition period. The ihMT signal increases following preparation with high B1, low duty cycle MT pulses. A model was developed to fit ihMT data acquired at different duty cycles, along with the more standard variations in power and offset frequency. Output parameters from the fit were reasonable. The model allowed simulation of the ihMT signal as a function of experimental parameters related to the saturation preparation, and can be used to guide future experiments and/or optimize ihMT.
Purpose
To provide a method by which MT and ihMT can be modeled that accounts for the increased ihMT signal following high B1, low duty-cycle pulsed saturation. The model and/or output parameters from fits to brain and muscle tissue (in particular the dipolar relaxation T1d associated with ihMT) can be used to guide future acquisitions/experimental protocols.Introduction
The ihMT signal is based on the difference between two sets of MT preparations: one with RF saturation applied at a single offset frequency Δf, another following dual frequency irradiation at ±Δf, both applied at the same power1. As for regular MT, based on application in clinical scanners/SAR considerations, ihMT is usually acquired in a pulsed manner2. This lends itself to application in SPGR like sequences or preparations, i.e. repetition of an MT pulse of width τ, every period, τTP3. Such a classic MT preparation shows a change in saturation in brain tissue that is dependent on the duty cycle i.e. τ/τTP for equal B1,RMS over τTP4. In this work, a model was developed that accounts for the change in MT with duty cycle and was used to fit ihMT data from brain tissue, as well as muscle tissue that shows a smaller but measurable ihMT signal5.Theory
The ihMT signal can be modeled using a binary spin bath model: The signals following single and dual frequency MT preparations are modeled using a restricted pool with and without dipolar order respectively5. Sled and Pike proposed a steady-state solution for the signal from an MT-SPGR acquisition decomposed into instantaneous saturation of the liquid pool, and constant-amplitude irradiation of the restricted pool and free precession for periods τ and τTP-τ respectively6. Both models were combined to provide an analytical expression for the longitudinal magnetization of the free pool and thus the measurable signal. Expressions for the steady-state magnetization of the MT-SPGR experiment with and without inclusion of a dipolar reservoir were fit to ROI data following single and dual frequency RF irradiation respectively.Methods
Experiments were conducted on a 3T GE scanner using an 8-channel head coil and knee coil to acquire healthy volunteer data in the brain (n=5) and calf (n=4) respectively. 2s MT preparations were placed before spin-echo EPI (FOVbrain=25x25cm2; FOVcalf=17x17cm2; matrix=128x128; slice=6mm; TE/TR=24/5000ms). MT preparation (τ=5ms) was conducted for varying: duty cycles, i.e. τTP=10;40;70;100ms, Δf=5;7;10;13kHz and B1,RMS=1.5;2.1;2.6;3.0μT, with B1,RMS≈3.0μT being a reasonable limit based on SAR restrictions. Dual frequency irradiation was achieved by cosine modulation and appropriate increases in B1. ROIs were drawn in white matter (WM), grey matter (GM), and calf muscles7. The parameters R1a, T2b, and T2a were allowed to vary within a range based on literature values for the relevant tissue at 3T8, to better constrain fits.Results and Discussion
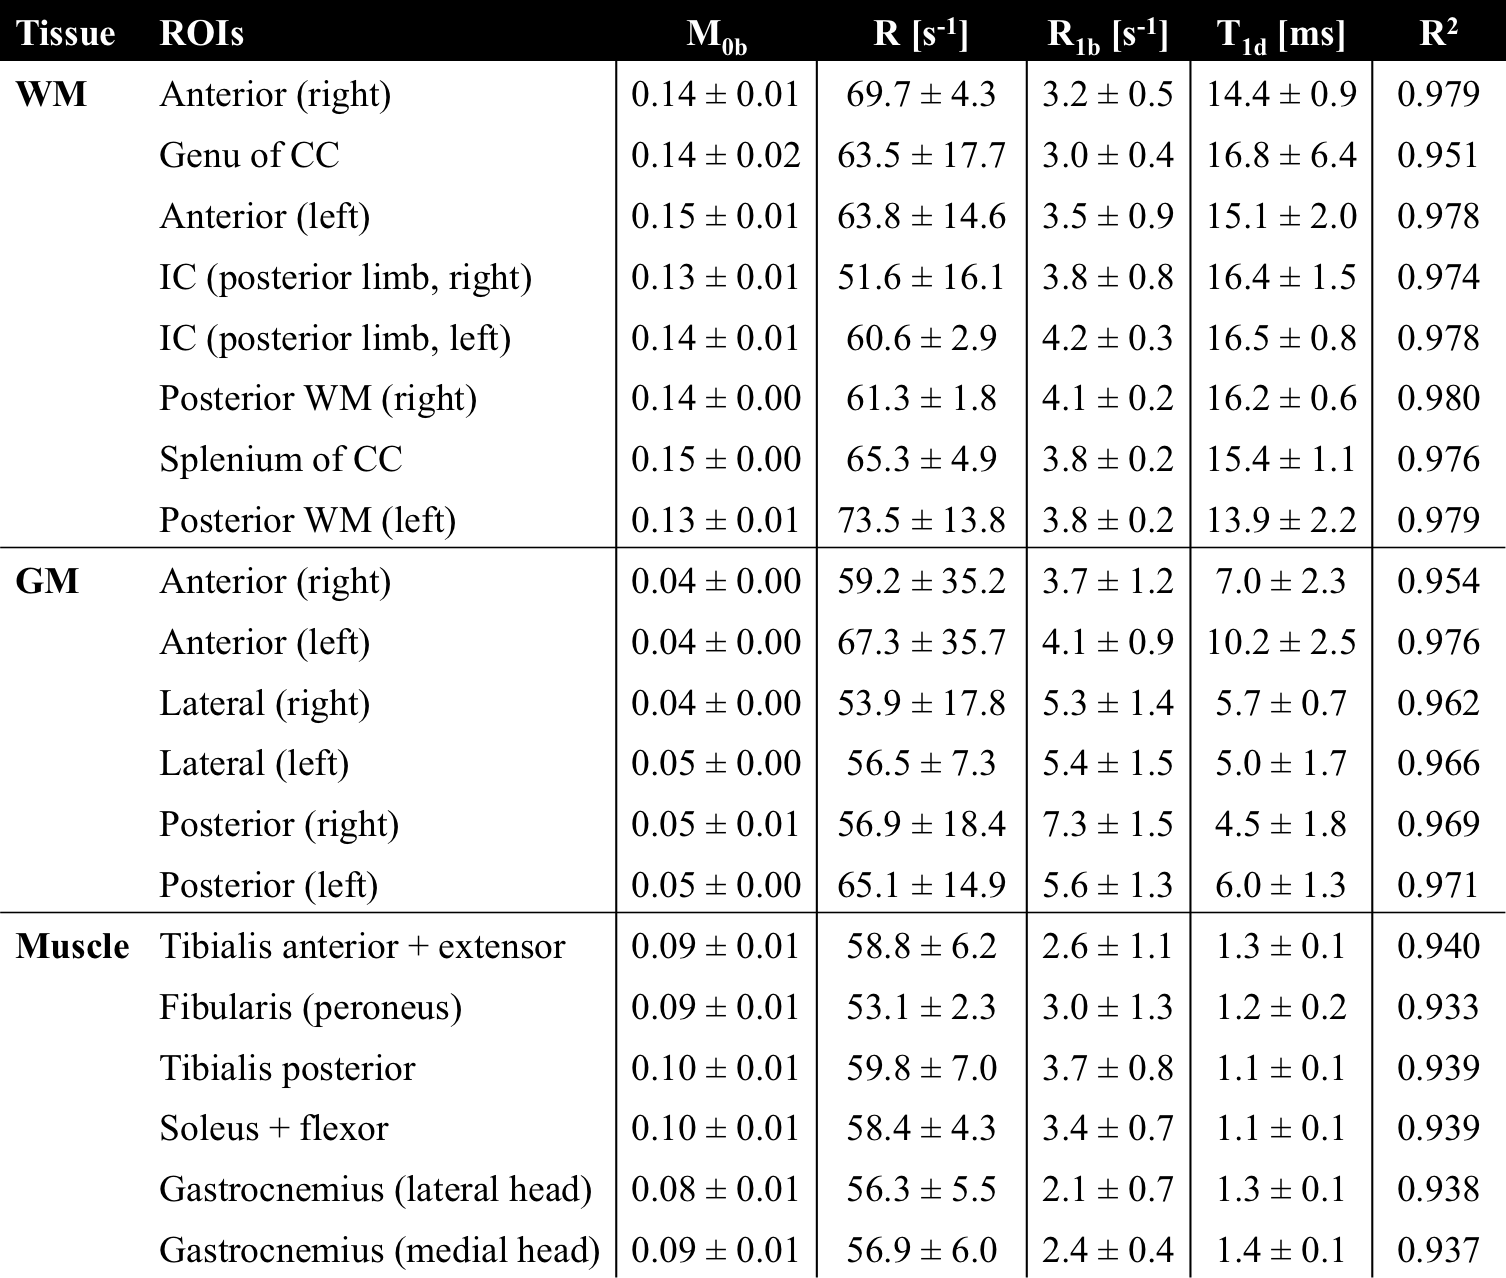
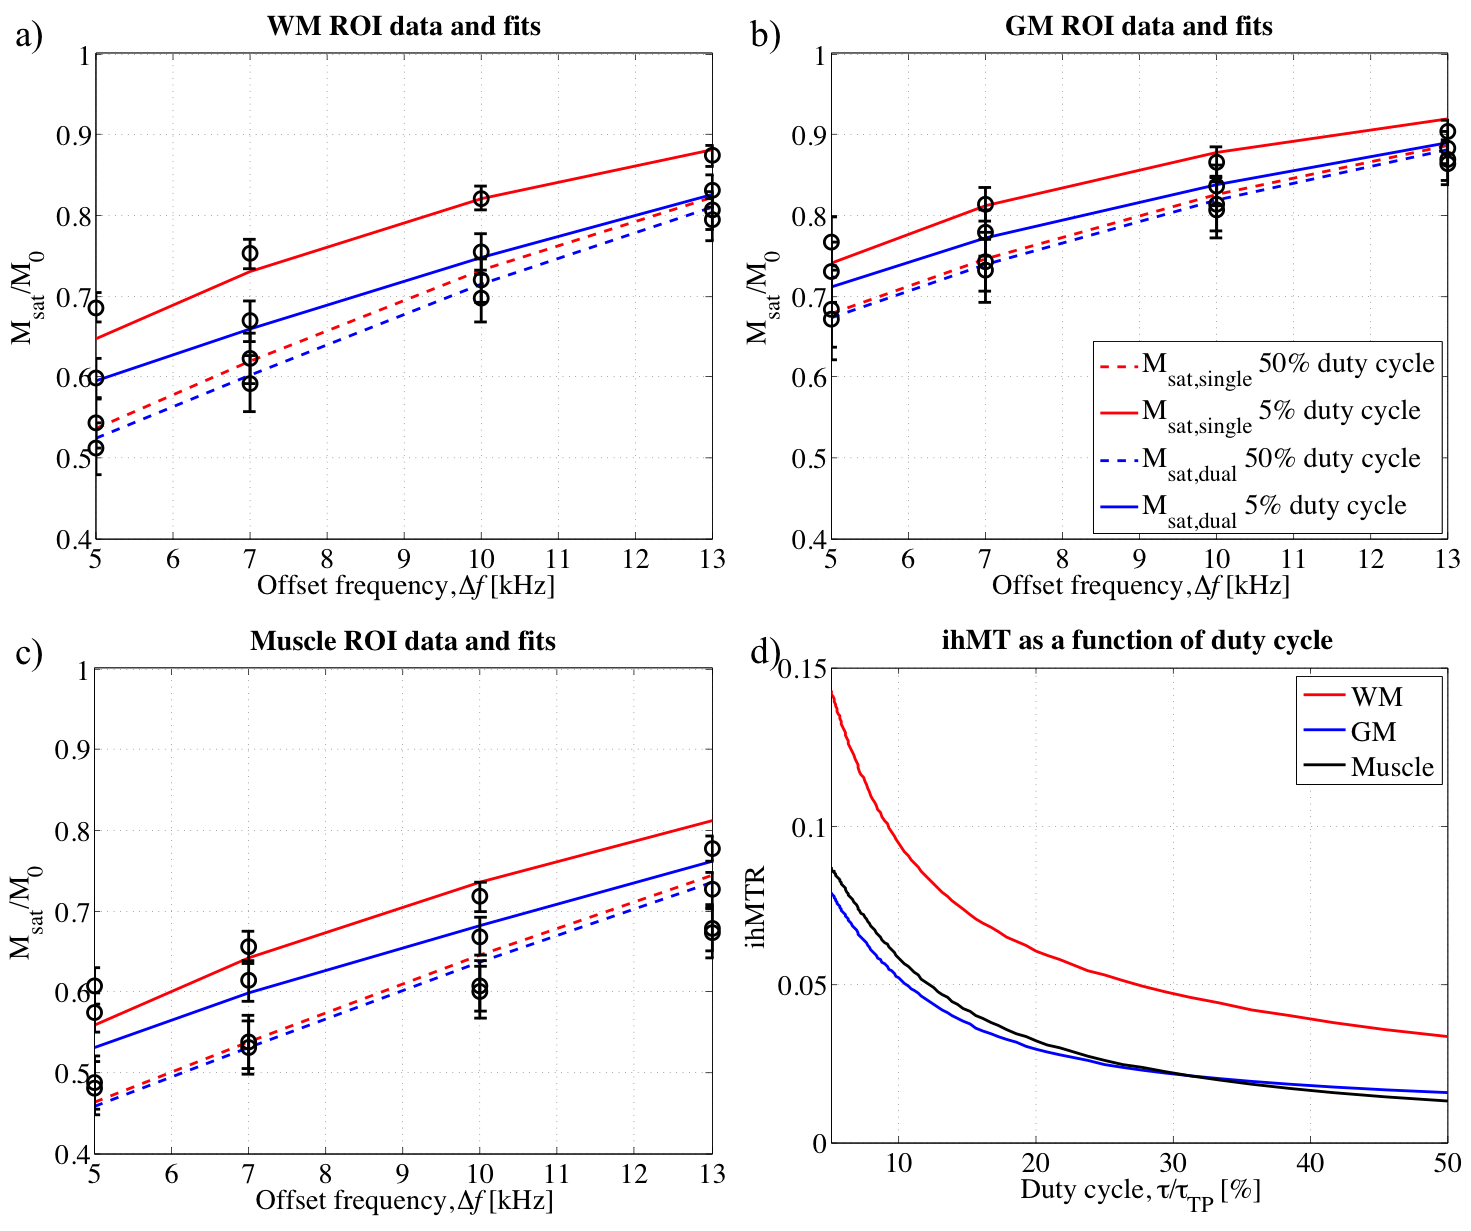
Average values for the output parameters M0b and T1d from fits to the model were comparable to previous literature7–9 (Fig. 1). Muscle T1d was short, with longer averages found in WM and GM ROIs. Paired Student t-tests showed a significant difference (p≤0.01) in T1d between: tibialis and gastrocnemius calf muscles; and, anterior and posterior WM on the right side. Longer T1ds (with larger standard deviations) found in anterior GM ROIs were likely the result of partial volume. The large variability in all output parameters points towards them being ill constrained (Figs.2a-c). Fits were reasonable, R2≥0.94, and use of values output from the model showed increased ihMT for lower duty cycles, expected from empirical evidence4,10 (Fig.2d). Deviation from some WM and GM T1Ds found in prior literature5 is thought the result of the entire restricted pool assumed to have a dipolar order with a single T1D in this study; Further refinements of the model are possible, e.g. considering only a fraction of the restricted pool to have dipolar order5.
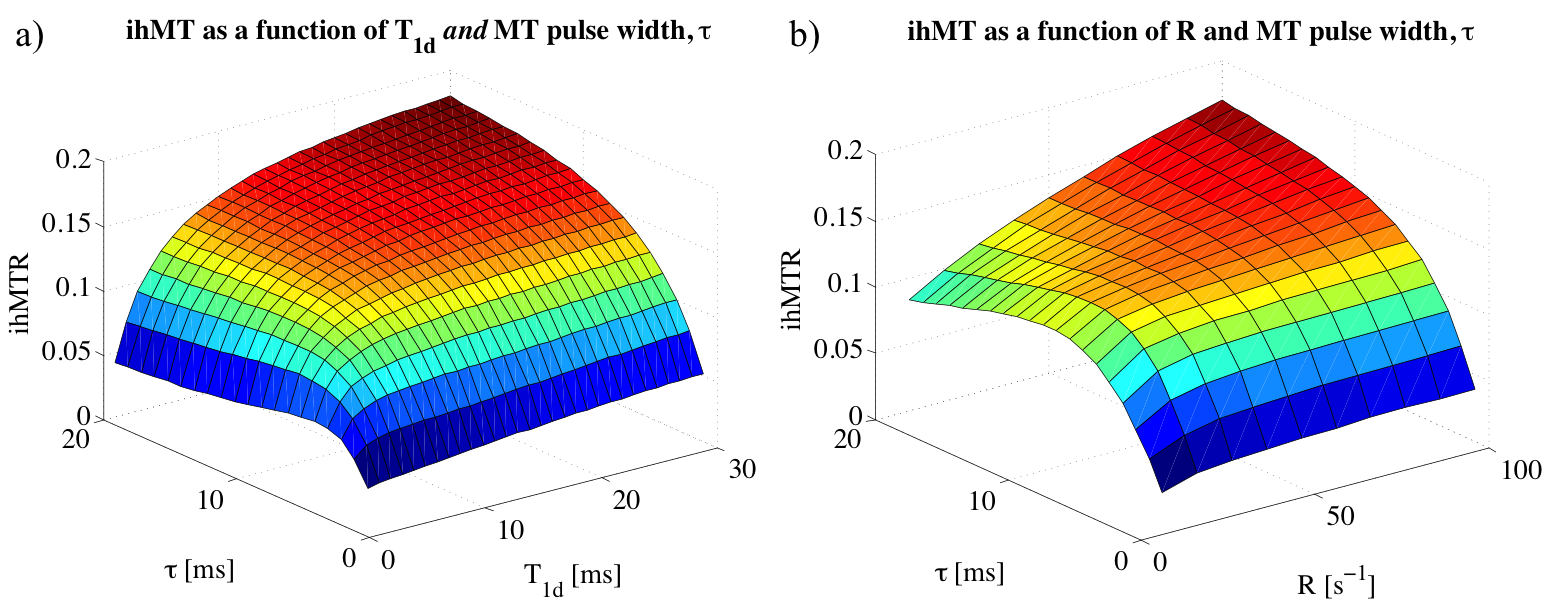
To illustrate the utility of the model, a set of fixed and assumed parameters (based on average values) were used to simulate the ihMT signal: As a function of T1d and MT pulse width, ihMT increased with both (more gradually for values ≥10ms) such that optimal ihMT was found for τ≥T1D (Fig.3a); As a function of exchange rate R and τ, ihMT increased up to τ≈T1d, and as τ increased for a fixed duty cycle so too did τTP, which resulted in decreasing ihMT for τTP>R-1 (Fig.3b).
Conclusion
The model described was able to fit ihMT data for varying saturation duty cycles and provide reasonable output parameters. Use of output parameters in the model showed the expected increase in ihMT, including for muscle tissue. The model can be utilized to guide future experiments, taking into account hardware limits/SAR.Acknowledgements
No acknowledgement found.References
1. Varma G, et al. Magnetization transfer from inhomogeneously broadened lines: A potential marker for myelin. Magn Reson Med. 2015;73:614–622.
2. Girard, OM, et al. Magnetization transfer from inhomogeneously broadened lines (ihMT): Experimental optimization of saturation parameters for human brain imaging at 1.5 Tesla. Magn Reson Med. 2015;73:2111–2121.
3. Varma G, et al. 3D Acquisition of the Inhomogeneous Magnetization Transfer Effect for Greater White Matter Contrast. in Proc ISMRM 2013:4224.
4. Varma G, et al. Increasing the Inhomogeneous Magnetization Transfer (ihMT) Signal in Vivo with High Amplitude, Low Duty Cycle Irradiation. in Proc ISMRM 2016:2890.
5. Varma G, et al. Interpretation of magnetization transfer from inhomogeneously broadened lines (ihMT) in tissues as a dipolar order effect within motion restricted molecules. J Magn Reson 2015:260;67–76.
6. Sled JG & Pike GB. Quantitative interpretation of magnetization transfer in spoiled gradient echo MRI sequences. J Magn Reson. 2000;145:24–36.
7. Sinclair CDJ, et al. Quantitative magnetization transfer in in vivo healthy human skeletal muscle at 3 T. Magn Reson Med. 2010;64:1739–1748.
8. Stanisz GJ. et al. T1, T2 relaxation and magnetization transfer in tissue at 3T. Magn Reson Med. 2005:54;507–12.
9. Swanson SD, et al. Molecular, dynamic, and structural origin of inhomogeneous magnetization transfer in lipid membranes. Magn Reson Med. 2016;doi:10.1002/mrm.26210.
10. Girard O, et al. Theoretical and experimental optimization of a 3D steady-state inhomogeneous (ihMT) gradient echo sequence: Boosting the ihMT sensitivity with sparse energy deposition. in Proc ISMRM 2016:2892.
Figures