1985
An assessment of interdependent chemical exchange saturation transfer (CEST) signals from metabolites with overlapping chemical shift frequencies and proton exchange rates1Advanced Imaging Researh Center, UT Southwestern Medical Center, Dallas, TX, United States
Synopsis
The objectives are to investigate how the chemical exchange saturation transfer (CEST) signal measured at a given frequency is independent of the neighboring CEST signals. We measured the CEST signals from combinations of four metabolites at 3.5, 3, 2 and 1 ppm with 5 different powers and 3 different durations of presaturation pulse to investigate the parameter-dependence and interdependency of each CEST signal in phantoms. The CEST signal of glutamate was less impacted by concentration changes in other exchanging species by subtracting CEST signals at two different power levels.
Purpose
Chemical exchange saturation transfer (CEST) imaging has been extended to detection of several different tissue metabolites and more studies have demonstrated the changes in tissue concentration of amide proton, glutamate, creatine or glucose measured at 3.5, 3, 2 and 1-1.2ppm1-4 in several diseased states. The purpose of this study was to investigate how the CEST signal measured at each frequency is independent of the neighboring signals with the goal of separating out the CEST signal of specific metabolite.Materials and Methods
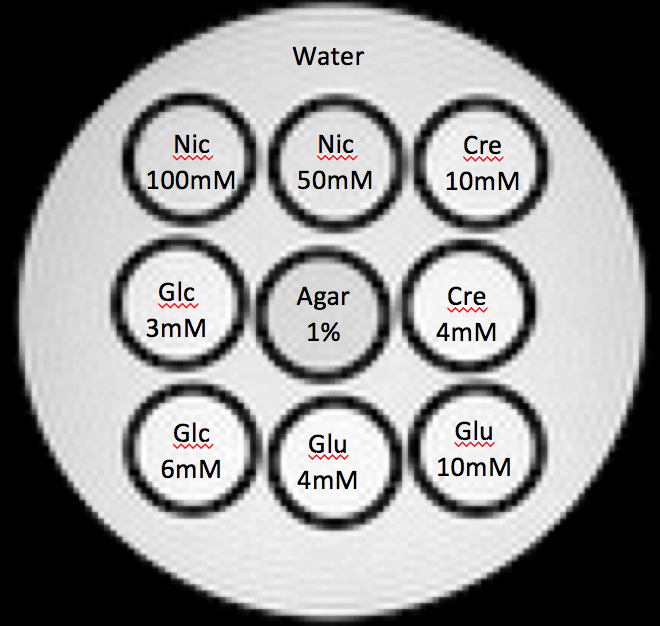
Phantom preparation: We prepared eight separate phantoms (pH 7.2) containing nicotinamide (Nic), glutamate (Glu), creatine (Cre), and glucose (Glc) aqueous solution in high and low concentrations (Fig. 1). Based on a preliminary study, high and low concentrations of each substance were adjusted to yield CEST signals of approximately 10% and 5% at 3.5, 3, 2 and 1 ppm, respectively, at 37°C.
MRI: The study was conducted using a 7T animal scanner (Agilent) with the phantoms placed parallel to the magnetic field. Gradient echo images (2-mm axial, centric k-space ordering) were collected following a presaturation pulse (continuous-wave: CW block pulse) which was applied at 61 frequency offsets from 6 to -6 ppm with an interval of 0.2ppm at 37°C. Other imaging parameters were: TR/TE = 5.32/2.64ms, flip angle = 20°, FOV = 32×32mm, matrix = 128×64 (reconstructed to 128×128), NEX = 4. A control image was obtained with the presaturation pulse at 300pm. Water saturation shift referencing (WASSR) images were collected for B0 inhomogeneity correction with a CW pulse (B1 = 0.2μT, duration = 200ms) which was applied at 31 frequency offsets from 0.5 to -0.5ppm every ~0.03ppm. The CEST imaging was repeated when we change the parameters, power (B1: 1.28, 2.3, 3.83, 4.6, 5.5µT) and duration (1, 3, 5sec), of the presaturation pulse.
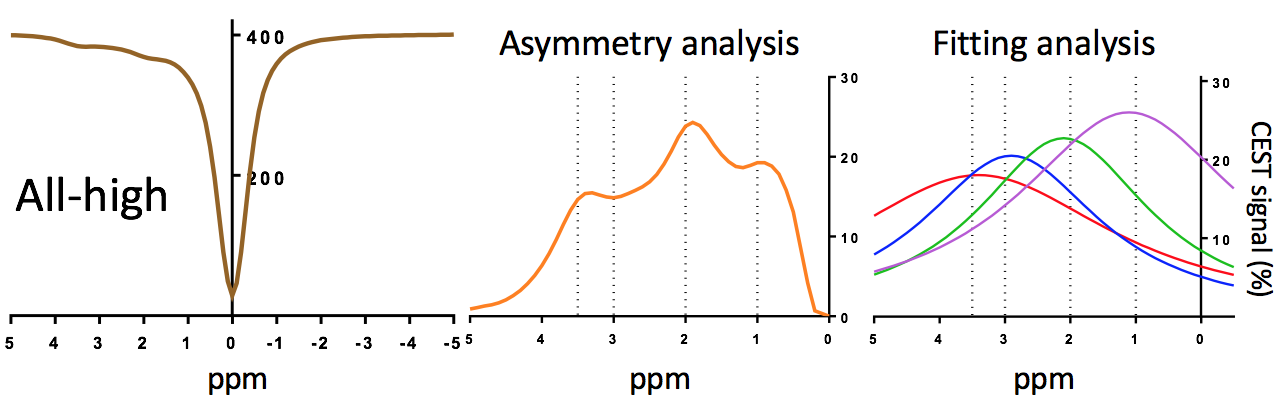
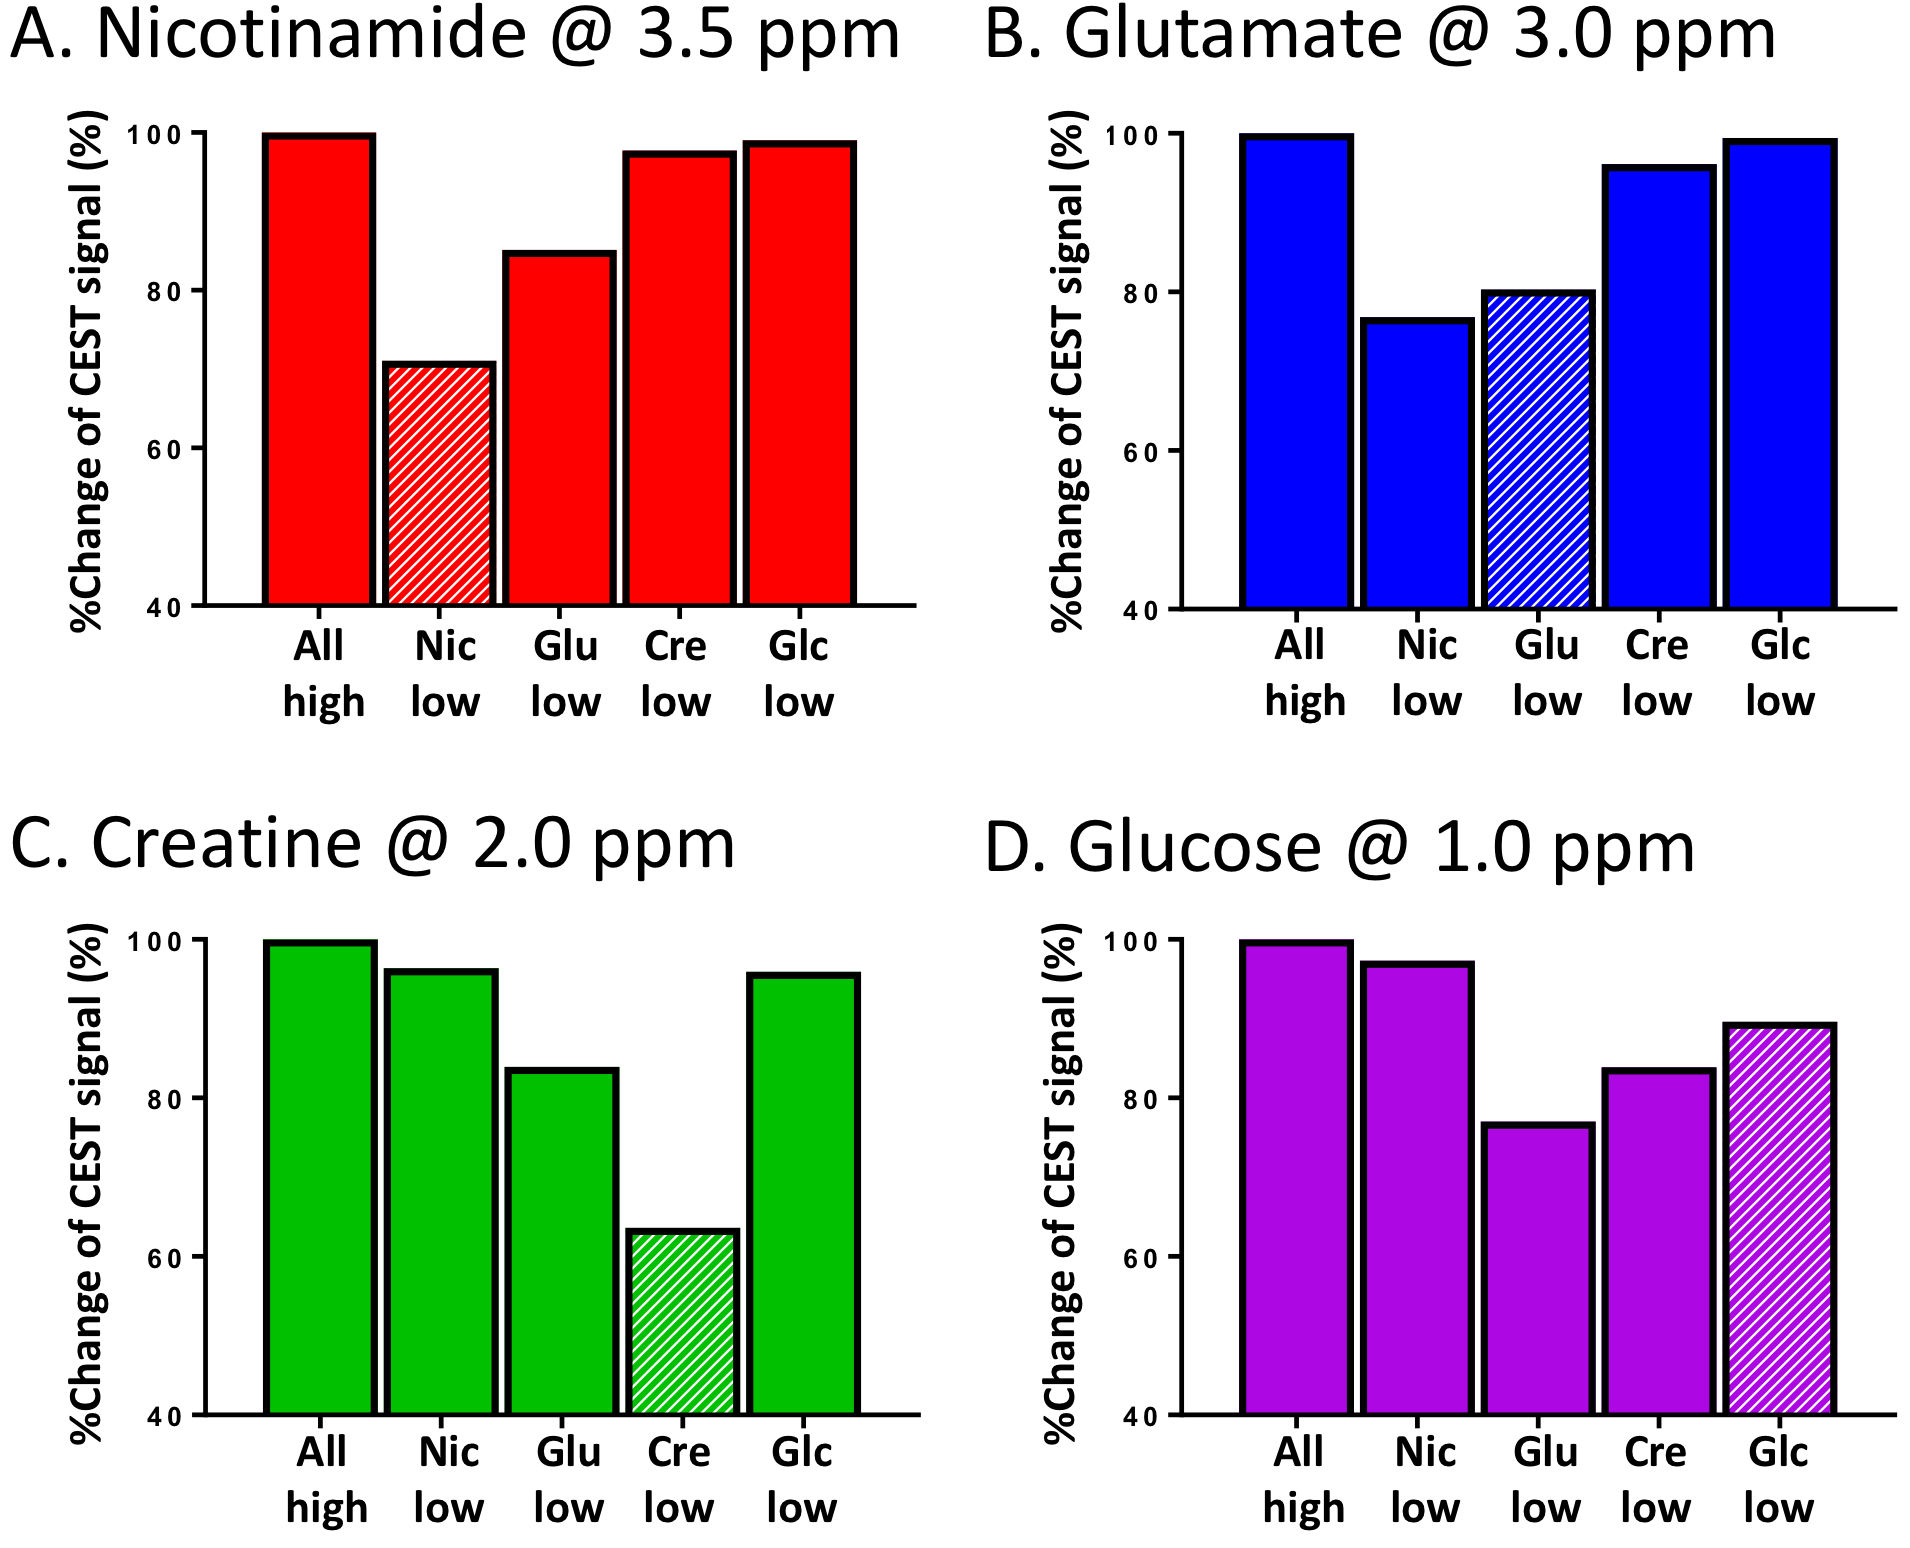
Image Analysis: The z-spectrum was obtained by a fitting all data points on a pixel-by-pixel basis in each phantom1. The four z-spectra from each sample in high concentration were summed to mimic a condition where all four metabolites would have been mixed together in one sample. This is referred to as the 4-high z-spectrum. To mimic a condition where the concentration of any one of the four substances is reduced, we also generated z-spectra that represented the sum of three z-spectra of three metabolites in high concentration and one z-spectrum of one metabolite in low concentration. On these five summed z-spectra (4-high, Nic-low, Glu-low, Cre-low and Glc-low), we measured the CEST signals at 3.5, 3, 2, and 1ppm both in an asymmetry analysis and a Lorentzian fitting analysis in 15 (5 powers x 3 durations) data sets.
Results and Discussion
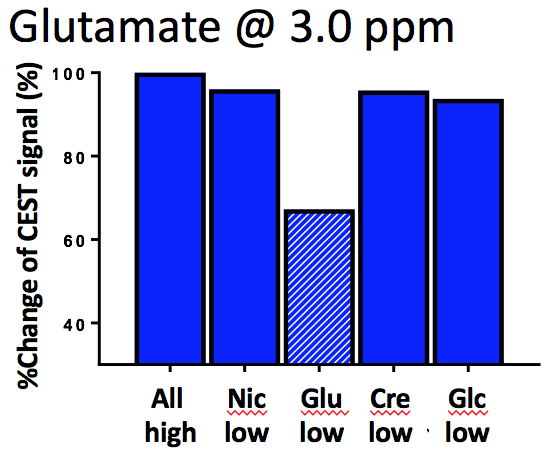
In the summed “all-high” z-spectrum, the intensity of the CEST signal (%) at 3.5, 3, 2, and 1ppm measured directly by asymmetry analysis and by Lorentzian fitting were 14.63 and 18.0 (Nic), 14.80 and 20.43 (Glu), 23.83 and 22.64 (Cre), 19.46 and 25.96 (Glc). These values were all higher than those from those measured in the z-spectrum of individual substance (Fig. 2). The CEST contribution from each substance decreased not only when its own concentration was reduced but also when the concentration of any one of the other substances was reduced (Fig. 3). For example, the Glu signal was lowered by 20% when the Glu concentration was reduced but it was also lowered by 24%, 4% and 0.5% when the concentrations of any one of Nic, Cre and Glc were reduced, respectively (Fig. 3B). The effect of CEST interference from neighboring signals was magnified in the fitting analysis. All signals increased as either the power or duration of the saturation pulse was increased as expected and the power and duration dependencies differed for each metabolite, also as expected. It should be noted that the power dependency was dominant for Glu and Glc, the two metabolites with the fastest proton exchange rates, while the duration dependency was dominant for Nic and Cre, the two metabolites with the slowest proton exchange rates5. When we subtracted the result at 2.3µT/3s from the result at 4.6µT/3s, we could observe the Glu CEST signal which was not much affected by the signal change of the neighboring CEST signals (Fig. 4). In summary, the CEST signal measured at a given frequency is influenced by concentration changes in other metabolite signals but with an appropriate combination of power adjustment and/or saturation pulse duration has the potential to increase specificity of each metabolite. As proton exchange rates can differ in tissues, further studies in vivo are needed to optimize sets of imaging parameters.Acknowledgements
This research was supported by grant CA-115531 from the National Institutes of Health.
References
1. Sagiyama K, Mashimo T, Togao O, et al. In vivo chemical exchange saturation transfer imaging allows early detection of a therapeutic response in glioblastoma. Proc Natl Acad Sci. 2014;111(12):4542-4547
2. Cai K, Haris M, Singh AK, et al. Magnetic resonance imaging of glutamate. Nat Med. 2012;18(2):302-306
3. Kogan F, Haris M, Singh A, et al. Method for high-resolution imaging of creatine in vivo using chemical exchange saturation transfer. Magn Reson Med. 2014;71(1):164-172.
4. Chan KW, McMahon MT, Kato Y, et al. Natural D-glucose as a biodegradable MRI contrast agent for detecting cancer. Magn Reson Med. 2012;68(6):1764-1773.
5. Vinogradov E, Sherry AD, Lenkinski RE. CEST: from basic principles to applications, challenges and opportunities. J Magn Reson. 2013;229:155-172
Figures