1984
Investigation of magnitude and phase CEST effects in fixed whole brains and tissue samples: a combined 3T and 9.4T study1Research Centre Juelich, Juelich, Germany
Synopsis
Saturation transfer effects were investigated in fixed tissue at 3T and 9.4T and a range of saturation powers. Z-spectra on magnitude as well as phase data were studied with high spatial and spectral resolution, also due to the excellent performance of a PCA-based denoising algorithm. The preliminary findings do not support the presence of an APT effect in fixed tissue; however, saturation transfer effects could be enhanced in pathological tissue, similar to in vivo findings in e.g. tumour or stroke. This study opens the way to a systematic investigation of saturation transfer effects in healthy and pathological fixed tissue.
Introduction
Formalin-fixed tissue specimens constitute a highly valuable source of clinical material for retrospective molecular studies1. The equivalence of proteome inventories obtained from formalin fixed brains and frozen tissue specimens was recently demonstrated2. Comparison of CEST/NOE effects, which demonstrate clinical interest 3-5 and sample properties investigated by e.g. proteomic studies would thus be highly desirable, especially with the aim of quantification. The aim of this work is to investigate CEST contrast in fixed tissue, an issue which, to our knowledge, has not been addressed before.Materials and Methods
Two whole fixed brains (1male, 1 female) and one visual cortex sample were obtained in accordance with the requirements of the local ethics committee and kept in 10% formalin solution for a period exceeding 5 years. The whole brains were investigated at 3T on a clinical scanner (Siemens Tim-Trio) whereas the tissue sample was scanned on a home-built 9.4T system (21cm horizontal magnet with Siemens console equivalent to that of the clinical scanner). The pH of the formalin solution in which the samples were preserved was measured using indicator stripes to be 4.5-5 for the whole brains and 6.5-7 for the tissue sample. At 3T, a 3D gradient-echo sequence was used using a saturation-read scheme. Relevant parameters were: pulse duration/delay = 50/35ms, TR/TE/flip=4.3ms/1.3ms/5deg, matrix 200x132x144, resolution 1mm3. At 9.4T, a 2D centrically ordered GRE sequence was used with a train of saturation pulses before readout. Relevant parameters were: pulse duration/delay = 50/50ms, TR/TE/flip=6ms/2ms/10deg centric reordering, matrix 210x210, resolution 0.2x0.2mm2, single slice 0.4mm thick, 4 avgs. Z-spectra were sampled at 3T with 81 off-resonance frequencies between -5 and 5ppm from the water peak and normalised to 300ppm. Different effective B1 powers were used for exploration (0.14, 0.92, 1.54, 1.92, 2.22 μT) and complete data sets acquired at powers of 0.92 and 2.22 μT. At 9.4T, complete data sets with 200 non-equidistant off-resonant frequencies between -18 and 18ppm and normalisation scans at 300ppm were acquired at 10 equidistant powers between 0.33, and 3.26μT.
At both fields, magnitude as well as phase images were saved and used to construct Z-spectra. PCA-based denoising similar to6 was performed, exploiting the very high similarity between images acquired at different off-resonance frequencies, and hugely increased SNR of the whole data set. Denoising of complex data or magnitude and phase separately was investigated; the latter was used for final results. At both fields, T1 and M0 mapping was performed to enable corrections7.
Results and Discussion
In addition to magnitude, also the phase of the water protons can also be expected to be influenced by exchange8 and we have investigated both.
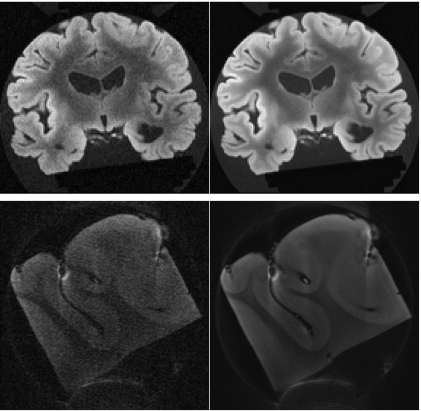
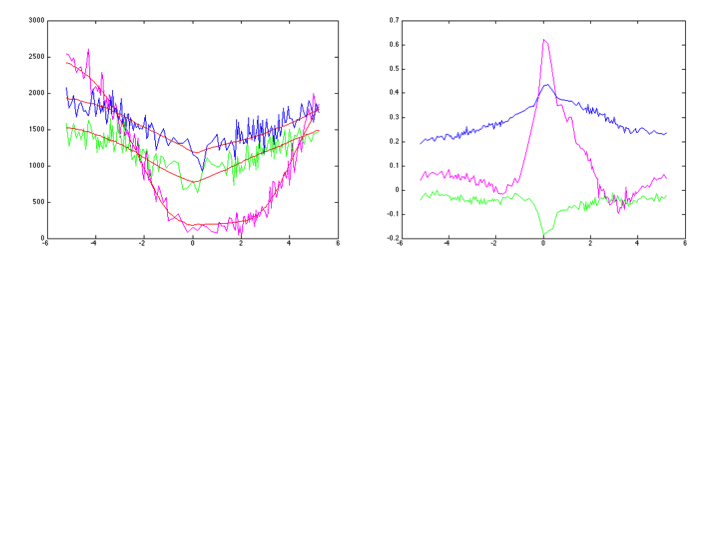
In order to assess denoising performance, a representative slice from a whole brain and the slice acquired for the tissue sample are shown in Fig. 1 at a saturation frequency close to that of water. Z-spectra obtained at 9.4T from magnitude images are shown in Fig. 2a (magnitude, original data and denoised) and 2b (phase, denoised) from single voxels. The denoised Z-spectra were interpolated and differences between the frequency of the minimum and 0 assigned to B0 inhomogeneity effects and corrected.
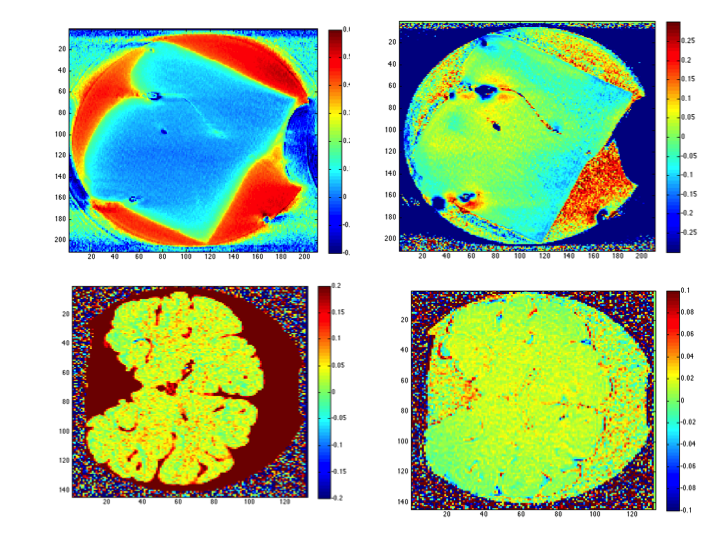
As already noticed in9, formalin shows a huge CEST effect at around 2ppm. We found the effect to be most striking at 9.4T at the lowest power investigated and only weakly seen in tissue voxels. An asymmetry effect can be detected in tissue at both fields, increasing with increasing power, in magnitude as well as in phase data. We calculated the assymmetry effect at 3.4ppm (APT frequency) in magnitude and phase and found it to show little anatomical features (Fig. 3). Whereas phase asymmetry shows slightly more anatomy than magnitude asymmetry, a likely interpretation is that the asymmetry is due to the presence of methylene glycol (hydrated formaldehyde) in tissue. Studies of hydrated tissue can clarify this aspect.
The shorter T1 in fixed tissue10 and reduced temperature both contribute to reducing the effects of saturation transfer. The pH of the formalin solution used for the whole brains incidentally corresponds to the approximate value of the minimum in exchange rate between water and methylene glycol9 and the results could change if exchange was investigated at different pH. Whether or not this pH also corresponds to tissue is unclear. In conclusion, this study opens the way to a systematic investigation of saturation transfer effects in healthy and pathological fixed tissue.
Acknowledgements
No acknowledgement found.References
[1] Kelly AD, Breitkopf SB, Yuan M, Goldsmith J, Spentzos D, Asara JM. Metabolomic profiling from formalin-fixed, paraffin-embedded tumor tissue using targeted LC/MS/MS: application in sarcoma. PLoS One. 2011;6:e25357.
[2] Sprung RW Jr, Brock JW, Tanksley JP, Li M, Washington MK, Slebos RJ, Liebler DC. Equivalence of protein inventories obtained from formalin-fixed paraffin-embedded and frozen tissue in multidimensional liquid chromatography-tandem mass spectrometry shotgun proteomic analysis. Mol Cell Proteomics. 2009;8:1988-98.
[3] Jones CK, Schlosser MJ, van Zijl PCM, Pomper MG, Golay X, Zhou JY. Amide proton transfer imaging of human brain tumors at 3T. Magn Reson Med. 2006;56(3):585–592.
[4] Salhotra A, Lal B, Laterra J, Sun PZ, van Zijl PCM, Zhou JY. Amide proton transfer imaging of 9L gliosarcoma and human glioblastoma xenografts. NMR Biomed. 2008;21(5):489–497.
[5] Jia GA, Abaza R, Williams JD, Zynger DL, Zhou JY, Shah ZK, Patel M, Sammet S, Wei L, Bahnson RR, Knopp MV. Amide Proton Transfer MR Imaging of Prostate Cancer: A Preliminary Study. J Magn Reson Imaging. 2011;33(3):647–654.
[6] Oros-Peusquens AM and Shah NJ. Proc ISMRM 2013.
[7] Xu J et al. On the origins of chemical exchange saturation transfer (CEST) contrast in tumors at 9.4T. NMR Biomed 2014; 27:406-416.
[8] Shmueli K, Dodd SJ, Li TQ, Duyn JH The Contribution of Chemical Exchange to MRI Frequency Shifts in Brain Tissue Magn Reson Med 2011; 65:35-43
[9] Rivlin M, Eliav U, Navon G. NMR studies of proton exchange kinetics in aqueous formaldehyde solutions. J Magn Reson 2014; 242:107–112.
[10] Oros-Peusquens AM and Shah NJ. Proc ISMRM 2014.
Figures