1980
Muscular glycogen detection with CEST imaging in living rat at 14.1T1Laboratory for functional and metabolic imaging, Ecole Polytechnique Fédérale de Lausanne, Lausanne, Switzerland, 2Center for Biomedical Imaging (CIBM-AIT), Ecole Polytechnique Fédérale de Lausanne, Lausanne, Switzerland
Synopsis
Glycogen is the principle intracellular storage for energetic needs in muscle and information about its spatial distribution would be a great additional tool for traumatology and sport sciences. In this study, we aimed to map in vivo muscular glycogen using CEST imaging in rodent. We have shown that optimal B1 saturation power allowed CEST imaging glycogen distinguishable from the neighboring creatine at 14.1 Tesla. We applied our optimized protocol on muscle after exercise session, resulting in 50% reduction of MTRasym comparing to muscle at resting state. This is supporting the specificity of our method and is consistent with literature.
PRUPOSE
Glycogen is the principle form of intracellular storage for energetic needs in muscle and information about its distribution through the tissue would be a great additional tool for traumatology and sport sciences. Because of its resonance frequency proximity to water and a short T2, glycogen remained challenging to detect by proton spectroscopy and required 13C-MRS. However, 13C-measurements are limited by their sensitivity for molecular imaging. CEST imaging offers an alternative for glycogen detection and it has been demonstrated feasible on rat livers in vitro1.
In this study, we aimed to map in vivo muscular glycogen using CEST imaging. We proposed in addition to follow glycogen modulations in response to physical training and to distinguish its CEST effect from saturation transfer of total creatine’s amine groups.
METHODS
All studies were performed in a 14.1T/26cm actively shielded animal scanner (Varian/Magnex). A home-built 1H quadrature bird cage coil (50mm-inner-diameter) covering rat leg was used as transceiver2. In order to maximize CEST sensitivity and specificity to glycogen from its neighboring creatine, phantom containing different glycogen and creatine concentrations was prepared for validation.
Field inhomogeneity was adjusted over a volume (280mm3) covering the entire region of interest using FASTMAP (LWanimal=23±2Hz). B0/B1 maps were measured using GRE sequence (TR=6000ms, TE=2.2/2.4ms, α=30°/60°). A train of Gaussian pulses with a saturation B1 field of 0.9μT (BW=60Hz) were applied for 6 seconds on 55 offsets covering a frequency window from 6.8ppm to –6.8ppm. A series of 2mm-slice images with the corresponding offsets were acquired by a segmented gradient echo sequence (centric ordering in k-space, echo train=4, TE=1.95ms,TRecho=4.5ms, a 42mm-in-plane-resolution).
B0 drift was done on each voxel by placing reference (0ppm) at the global minimum of apodized z-spectrum3. After correction, MTRasym were calculated by subtracting negative part by positive part of z-spectrum.
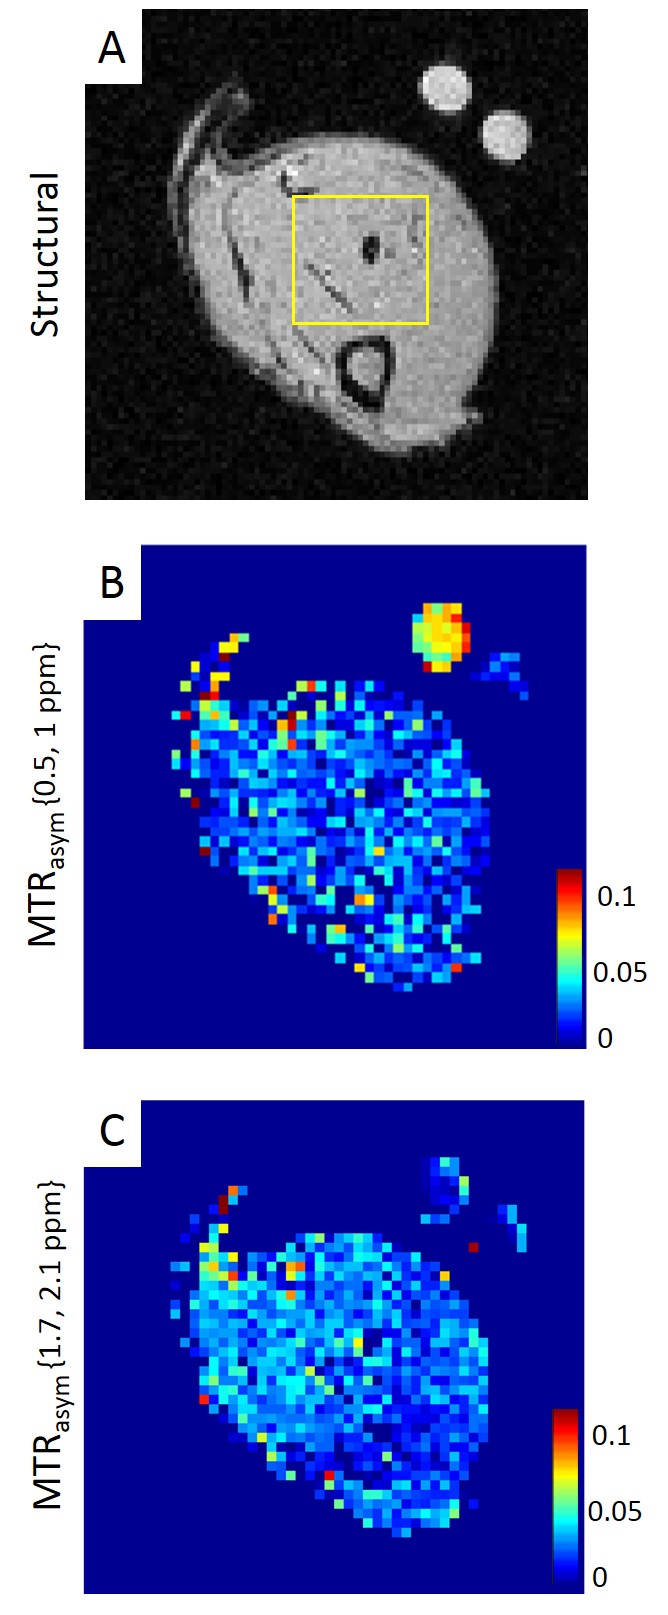
The optimized CEST protocol was applied in vivo on legs of male Wistar rats fed ab libitum. Animals were anesthetized using 1.8% of isoflurane and maintained under physiological conditions (60-70 breathing-beats-per-minute, temperature ~37°C). Muscular exercises were induced by 20 min of swimming session, ~40 min before starting CEST acquisition i.e. ~1h20 before glycoCEST at 1ppm. Two reference phantoms (10mM Glycogen and saline each) were placed close to the leg (Fig2.A).
RESULTS
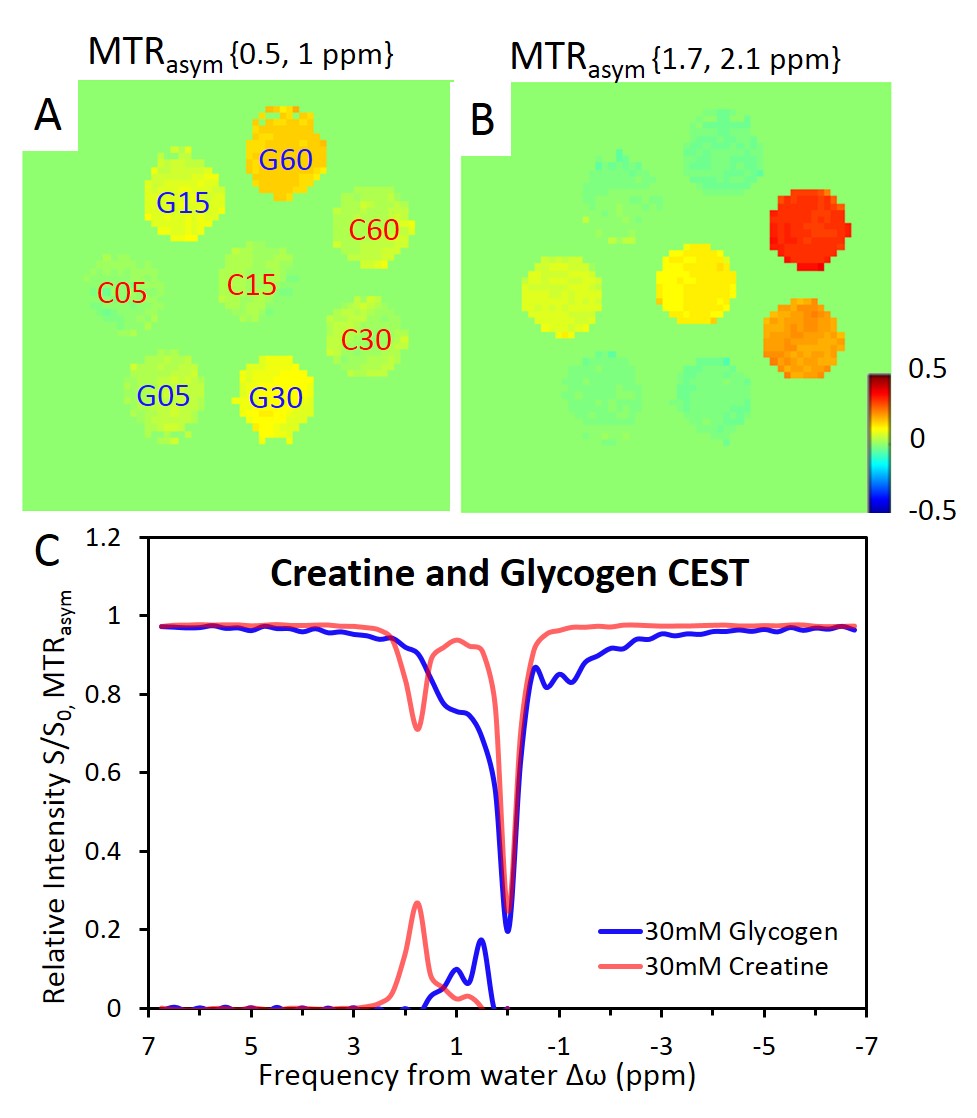
A clear distinction of CEST effects between glycogen and creatine was observed when B1 = 0.9μT. With increased B1, CEST effects of glycogen and creatine became overlapped due to an increase of the saturation bandwidth. In equimolar phantoms, creatine represents 16% of glycogen MTRasym between 0.5-1ppm whereas glycogen represents 2.7% of creatine MTRasym value around 1.8ppm. Linearity of MTRasym in function of each metabolite concentrations has been observed (Fig1.A-B). Despite similar saturation magnitudes induced by creatine and glycogen at 1.8 and 1.2 ppm respectively, glycogen MTRasym was 0.65±0.05 time smaller than creatine because of saturation contribution in the negative part of the z-spectrum. (Fig1.C).
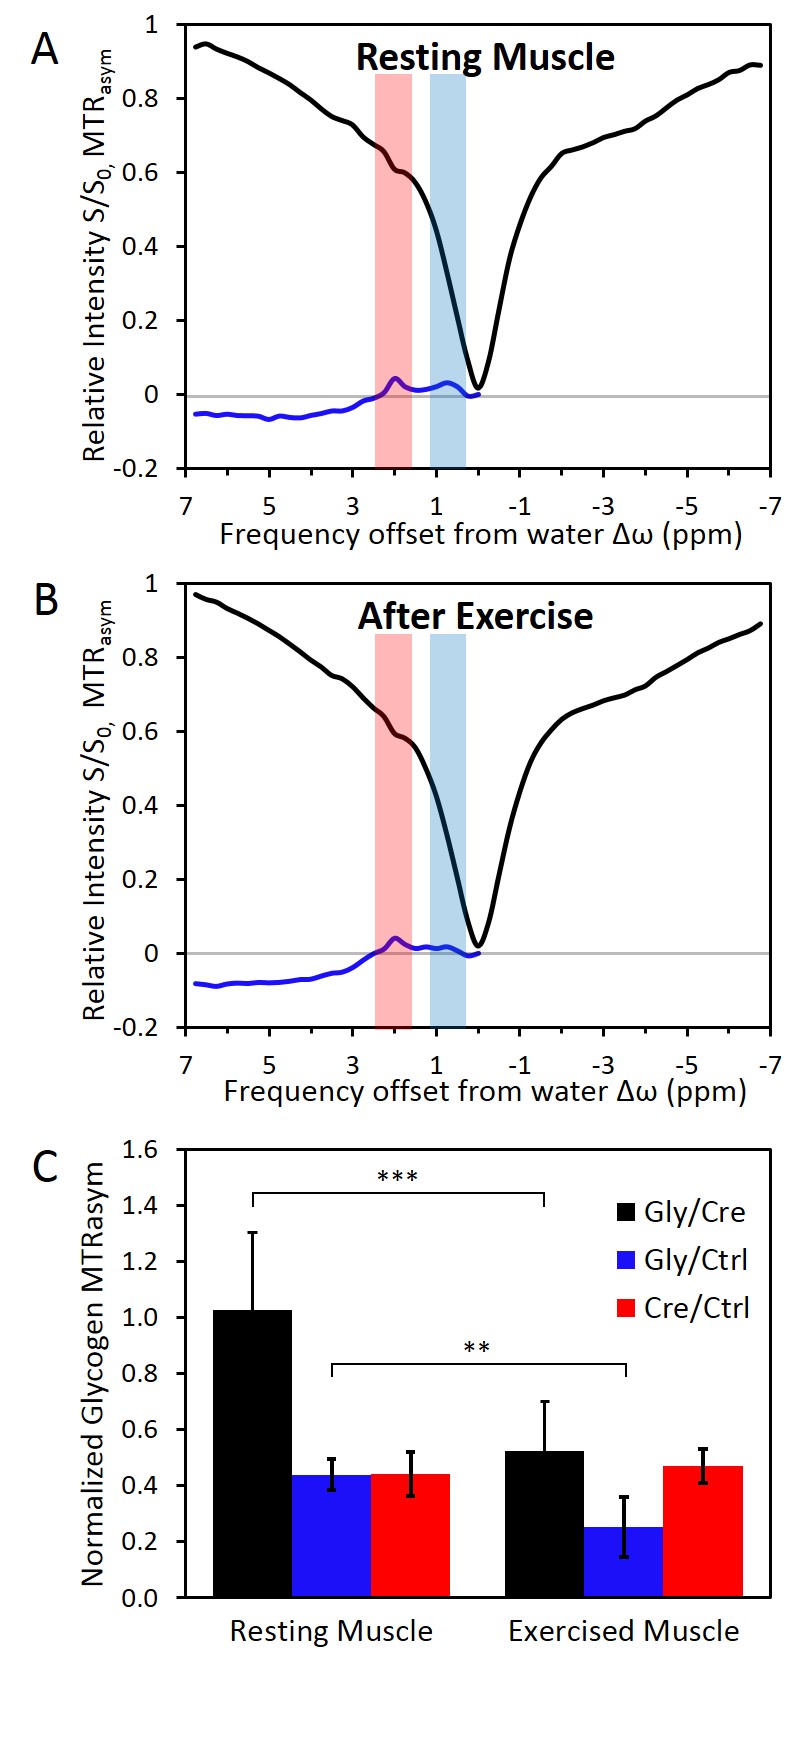
In resting muscle, creatine and NOE were visible in z-spectrum (Fig3.A-B). Glycogen was consistently observed in MTRasym from 4 animals (Fig2.B,Fig3.A). MTRasym curve showed a clear separation between creatine and glycogen with a 1:1 ratio (Fig3.A). In contrast, with trained muscle, glycogen (0.5-1ppm) was lowered than creatine (1.7-2.1ppm) on MTRasym curves (Fig3.B). MTR ratios of muscular glycogen to glycogen phantom and muscle creatine indicated a decrease of 51% and 58% respectively between resting and exercised muscles, whereas MTRasym at creatine remained constant. (Fig3.C)
DISCUSSION
In this study, we have shown that an optimal B1 saturation power allowed CEST imaging glycogen of living muscle, distinguishable from the neighboring creatine at 14.1Tesla. Although the saturation contribution of glycogen in the negative part of z-spectrum and NOE under-estimated the corresponding MTRasym , i.e. 65% of the creatine MTRasym (Fig1.A), muscular glycogen concentration can be estimated to be approximately 51µmol/g (1.5 times of creatine), when we referenced literature values of muscle creatine4.
The further CEST imaging study on muscle after exercise resulted in 50% reduction of MTRasym compare to muscle at resting state (Fig3.C). This observation supports the specificity of our method and is consistent with glycogen depletion and recovery observed in previous 13C spectroscopy studies5. Moreover, the CEST image amplitude of creatine in muscle after exercise remained constant to the resting state, which is consistent with fast recovery creatine and phosphocreatine modulations after exercise5.
CONCLUSION
We concluded that CEST imaging is feasible for non-invasively mapping muscular glycogen and tracking its modulations in response to physical exercises.Acknowledgements
This work is supported by Centre d’Imagerie Biomédicale of UNIL, UNIGE, HUG, CHUV, EPFL, the Leenaards and Louis-Jeantet Foundations.
References
1Van Zijl, P. C. M., et al. MRI detection of glycogen in vivo by using chemical exchange saturation transfer imaging (glycoCEST). PNAS.2007 104(11), 4359–64.
2Dehghani M.M. et al. Transmit volume coil-receive surface coil for proton operating at 14 Tesla. ISMRM.2015, abstract 2576
3I. Tkàc et al. In Vivo 1H NMR Spectroscopy of Rat Brain at 1 ms Echo Time, MRM 1999, 41:649–656
4Paganini AT, Foley JM, Meyer RM. Linear dependence of muscle phosphocreatine kinase kinetics on oxidative capacity. Am J Physiol.1997, 272:C501–510.
5S. Rotman et al. Muscle glycogen recovery after exercise measured by 13C-magnetic resonance spectroscopy in humans: effect of nutritional solutions. MAGMA.2000, 114--121
Figures