1979
Elegant method to quantify chemical exchange processes for pH CEST imaging1Division of Medical Physics in Radiology, German Cancer Research Center (DKFZ), Heidelberg, Germany, 2Department of High-field Magnetic Resonance, Max-Planck-Institute for Biological Cybernetics, Tübingen, Germany
Synopsis
A novel concentration-independent approach is presented to determine the pH-dependence of exchange rates employing a single CEST image of a set of model solutions at different pH. Not only the comparatively short acquisition time, but also the robustness against variations in relaxation parameters makes this modality an elegant way to determine exchange rates in vitro. The calibrated functions are required for accurate pH mapping in vivo using CEST, as well as for design of exogenous CEST contrast agents.
Purpose
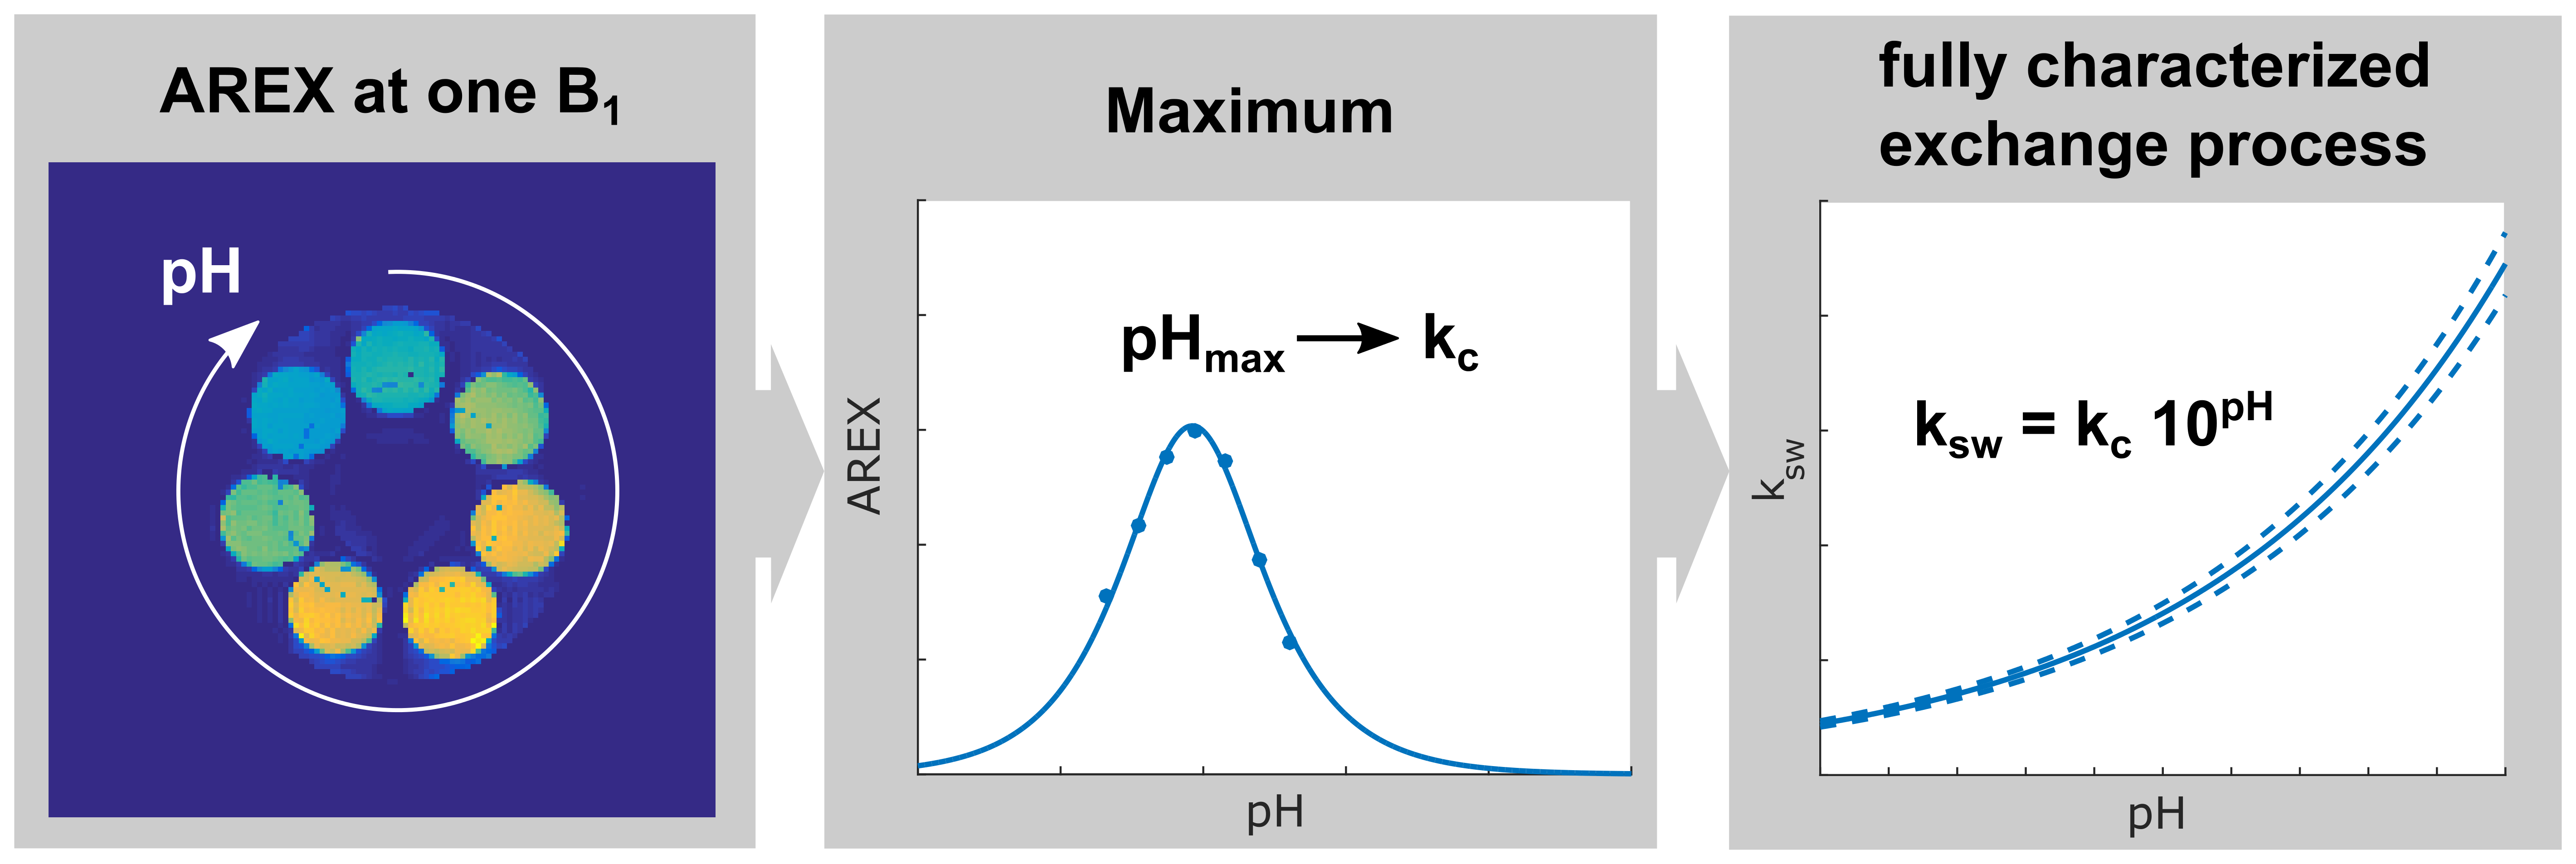
The concentration-independent determination of the exchange rate ksw is a well-known issue that was nicely solved by Dixon et al.1 and extended to pulsed pre-saturation by Meissner et al.2 Consequently, in vivo pH-mapping via CEST is possible presuming the pH-dependence of the underlying exchange process is known.3 However, precise calibration of the pH-dependence is time consuming and moreover requires assumptions for the transversal relaxation rate R2s of the chemically exchanging protons. In this study, a remarkably robust method is presented which addresses these problems. It is demonstrated that the pH-value where the CEST signal reaches its maximum (pHmax) fully characterizes the exchange process. Determination of pHmax can be realized by acquisition of just one single CEST image (Fig. 1).Theory
The isolated CEST signal calculated by the apparent exchange dependent relaxation (AREX)4 can be described as followed2:
$$AREX = c_{1}\cdot DC\cdot f\cdot k_{sw}\frac{(γB_{1})^{2}}{(γB_{1})^{2}+c_{2}^{2}\cdot k_{sw}(k_{sw}+R_{2s})}$$
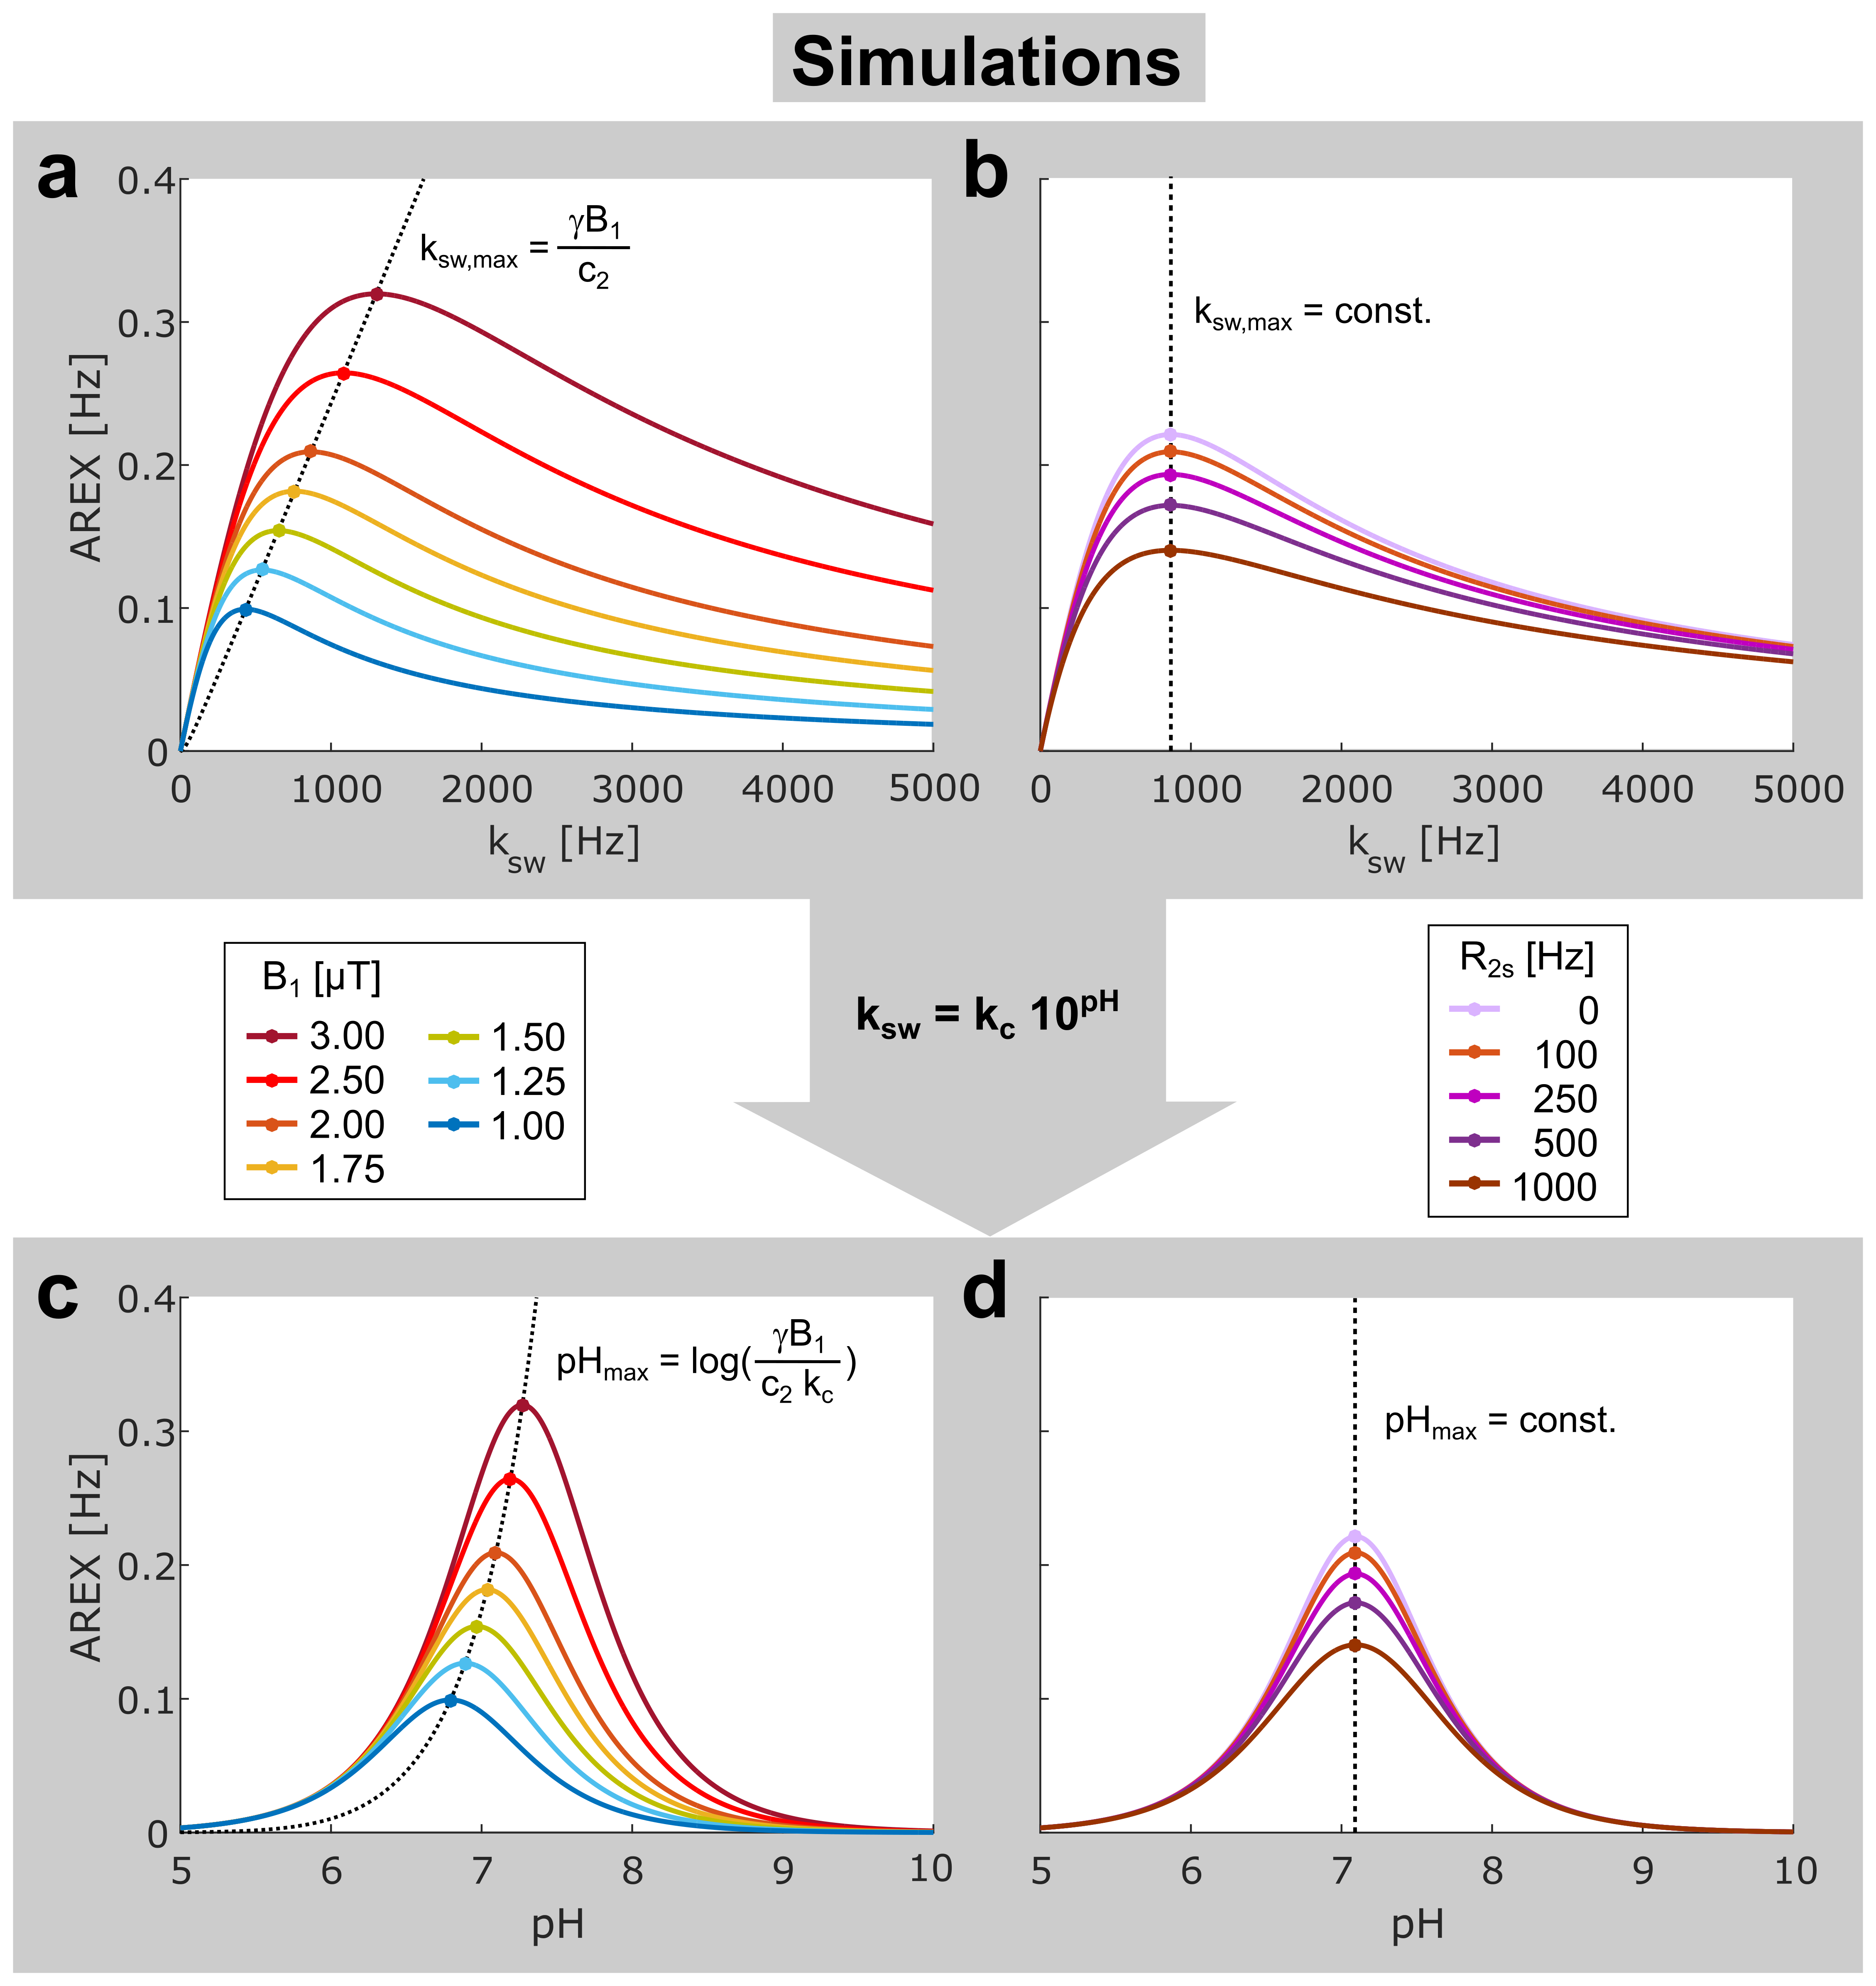
with the relative proton fraction f and the pulsed saturation parameters: mean amplitude B1, duty cycle DC, and the form factors c1,2 considering the pulse shape. AREX as a function of ksw reaches a maximum at $$$k_{sw,max}=\frac{γB_{1}}{c_{2}}$$$ (Fig. 2a) independent of concentration and R2s (Fig. 2b).
Assuming
a base-catalyzed exchange process: $$$k_{sw}=k_{b}\cdot 10^{pH–pK_{w}}=k_{c}\cdot 10^{pH}$$$, AREX (eq. 1) can be transformed into
a function of pH (Fig. 2c,d). The exchange process and thus also the transformation is
fully characterized by the pre-exponential factor $$$k_{c}=k_{b}\cdot 10^{–pK_{w}}$$$.
Materials and Methods
CEST image data of Rerich et al.5 was used for evaluation. Model solutions containing 50 mM creatine at different pH ranging from 6.3 to 7.6 were measured at 37 °C.
$$$AREX(Δω)=\frac{1}{T_{1}}\cdot (\frac{1}{Z}–\frac{1}{Z_{ref}})$$$ at frequency offset Δω was calculated using the other side of the Z-spectrum as the reference Zref.
CEST imaging was performed on a 7 T whole body MR tomograph (MAGNETOM 7T, Siemens Healthineers, Germany). Pre-saturation was achieved by a train of 50 Gaussian-shaped RF pulses (c2=0.6171, tpulse=100ms, DC=50%, tsat=10s) with a mean amplitude B1 ranging from 1.2 to 3.1 µT. AREX was corrected for B0- and B1-inhomogeneities.
Results
An analytical form of the function AREX(pH) was derived. The expression for the position of its maximum pHmax (eq. Fig. 2c) allows direct calculation of kc and hence full quantification of the exchange process. Remarkably, pHmax is independent of R2s (Fig. 2d) leading to a unique accuracy for the determined exchange rates. In addition, the half-width of the symmetric resonances AREX(pH) is nearly constant under variations of B1 (Fig. 2c) and R2s (Fig. 2d), which facilitates a robust fitting of the function and consequently robust determination of pHmax.
Experimental AREX values of creatine as a function of pH (Fig. 3a) agree well with theoretical expectations (Fig. 2c). For full quantification of the exchange process, acquisition of data at one B1 is sufficient. However, to demonstrate the robustness of the presented method, AREX values at several B1 were evaluated. The calculated values kc agree very well, with a mean value of (70.7 ± 0.9) µHz. In a comparison to the reference value determined by the Ω-plot method1,2 kc = (66.5 ± 6.0) µHz the error was reduced approximately by an order of magnitude.
Discussion
The presented method is a powerful tool to robustly quantify exchange rates as a function of pH with a unique accuracy. It was already shown by Woessner et al. that the maximal CEST signal yields insight into the exchange rate.6 We were able to extend this insight by showing that a full characterization of the exchange process is possible by acquisition of just one AREX image at one specific B1. This allows a high throughput quantification of samples and therefore e.g. to investigate the exchange processes under different molecular environments. In contrast, the concentration-independent Ω-plot method1,2 requires a series of AREX images at several B1.
In this study, the method was verified under the assumption of a dominant base-catalyzed exchange, which is correct for the CEST signals appearing in vivo at an intermediate B1 around 1 µT. Nonetheless, the theory is also extendable to acid-catalyzed exchange processes.
Finally, the method was used to establish calibration functions for amide (Δω = 3.5 ppm) and guanidinium (Δω = 2.0 ppm) protons in vivo. Investigation of homogenized pig brain tissue (data not shown) led to kc = 1.54 and 85.1 µHz for amide and guanidinium protons, respectively. Corresponding exchange rates under physiological conditions (pH 7.1 and 37 °C) are 19.4 and 1071 Hz, respectively.
Conclusion
In this study, a robust method is presented to precisely determine the pH-dependence of exchange rates. The calibrated functions will improve the accuracy of in vivo pH imaging using CEST.Acknowledgements
We cordially thank Eugenia Rerich from the hospital in Nürnberg, Germany for providing the data of the creatine samples.References
1. Dixon WT, Ren J, Lubag AJM, et al. A Concentration-Independent Method to Measure Exchange Rates in PARACEST Agents. Magn Reson Med 2010;63:625-632.
2. Meissner J-E, Goerke S, Rerich E, et al. Quantitative pulsed CEST-MRI using Ω-plots. NMR Biomed 2015;28(10):1196-1208.
3. Sun PZ. Xiao G, Zhou IY, et al. A method for accurate pH mapping with chemical exchange saturation transfer (CEST) MRI. Contrast Media Mol Imaging 2016;11(3):195-202.
4. Zaiss M, Xu J, Goerke S, et al. Inverse Z-spectrum analysis for spillover-, MT-, and T1-corrected steady-state pulsed CEST-MRI – application to pH-weighted MRI of acute stroke. NMR Biomed. 2014;27(3):240-252.
5. Rerich E, Zaiss M, Korzowski A, et al. Relaxation-compensated CEST-MRI at 7 T for mapping of creatine content and pH – preliminary application in human muscle tissue in vivo. NMR Biomed. 2015;28(11):1402-1412.
6. Woessner DE, Zhang S, Merritt ME, et al. Numerical Solution of the Bloch Equations Provides Insights Into the Optimum Design of PARACEST Agents for MRI. Magn Reson Med. 2005;53:790-799.
Figures