1976
3D gagCEST of articular cartilage in the knee at 7 T correlates with clinical findings1University Medical Center Utrecht, Utrecht, Netherlands, 2Orthopaedics, University Medical Center Utrecht, Utrecht, 3Radiology, University Medical Center Utrecht, Utrecht, Netherlands, 4Faculty of Science and Technology, University of Twente, Enschede, Netherlands, 5MIRA Institute for Biomedical Technology and Technical Medicine, University of Twente, Enschede, Netherlands
Synopsis
The purpose of this study was to assess the sensitivity of 3D gagCEST at 7T in cartilage repair patients with respect to healthy volunteers. Six healthy volunteers were scanned for stability assessments and five patients with cartilage defects were included to assess clinical applicability of the gagCEST sequence. The mean GAG effect size in healthy controls is 10.2 %, which is three times higher than the coefficient of variation in the stability assessments. The results of this study demonstrate the stability of 3D gagCEST at 7T and the results from patients with cartilage defects indicate a correlation with clinical findings.
Purpose
The molecular composition of cartilage changes after trauma and during the course of degenerative diseases such as osteoarthritis, and is relevant for cartilage repair. Of particular interest are changes in the amount of glycosaminoglycan (GAG) in articular cartilage, which can be monitored directly in vivo with glycosaminoglycan chemical exchange saturation transfer (gagCEST) 1–3. The purpose of this study was to assess the sensitivity of new 3D gagCEST sequence at 7 T in cartilage repair patients with respect to healthy volunteers.Methods
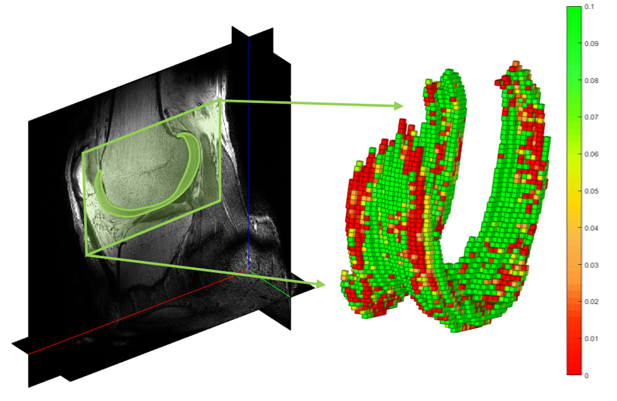
Experiments were carried out on a 7.0 T whole body scanner (Achieva; Philips Healthcare, Best, Netherlands) using a wrap-around 32-channel receiver knee coil and a volume transmit coil (MR Coils BV, Zaltbommel, the Netherlands). The 3D gagCEST sequence as implemented in this work was a pseudo-steady state 4 spoiled gradient echo sequence with a pre-saturation pulse train of 25 ms sinc-shaped pulses (2 µT, N=20, duty cycle 62.5%), readout (sagittal orientation, TR = 2.75 ms, TE = 1.4 ms, FA = 5, FOV = 140 x 150 x 135, TFE factor of 370, SENSE factor 2, five shots and inter-shot T1 recovery time = 2s, k-space center-weighted acquisition), two dummy scans, scan time 6min:59s. The sequence was preliminary optimized through Bloch-McConnell simulations for maximum sensitivity to GAG effect size. CEST images were acquired at 17 saturation offsets from -3 ppm to 3 ppm (± 333 ppm for normalization). The CEST datasets were analyzed in MATLAB (version 2015b, the Mathworks inc., Natick, MA, USA) using a Lorentzian fit with a three-pool model (water, GAG and magnetization transfer) 5, after which the area under the curve from 0.6 ppm to 1.2 ppm was used to calculate the GAG effect. Figure 1A shows the location of the region of interest (ROI) in the trochlea, used for both the stability analyses and calculation of GAG effect in healthy controls (age 24 to 29, four males and two females). Figure 1B shows CEST spectrum in the ROI. Stability measurements were taken by repeating the same 0 ppm offset nine times and stability was assessed with coefficient of variation. Five patients undergoing arthroscopy for repair of a femoral cartilage defect were included in this study to assess the clinical value of the new gagCEST sequence, i.e. whether it can discriminate between healthy and damaged cartilage. The cartilage was manually segmented, after which gagCEST MRI values were assigned to each voxel resulting in a 3D colormap of the cartilage depicting gagCEST values.Results
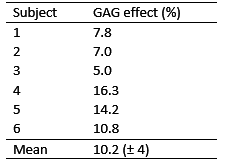
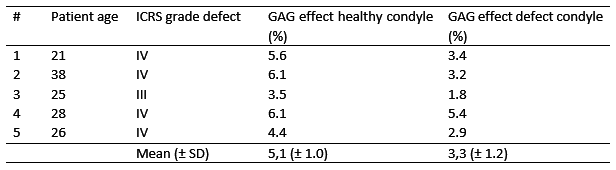
Table 1 summarizes signal stability assessments in vivo, the average CV was 3.2%. Subject three showed a higher CV, which is related to the motion artifacts which were clearly seen in the dynamic series. Table 2 shows the GAG effect size in healthy controls, which was on average 10.2% (± 4%). 3D segmentations of the cartilage are used to assess the gagCEST values within the whole knee in patients. An example of a 3D segmentation of the cartilage with GAG effect values in each voxel is shown in Figure 2. This specific patient had a defect on the medial side of his knee (ICRS grade IV) and some blistering and small defects on the lateral side and trochlea (ICRS grade I/II). The results of cartilage repair patients are summarized in Table 3, which show that the GAG effect is always significantly higher was (p < 0.05, related-samples Wilcoxon Signed Rank Test) in healthy cartilage compared to damaged cartilage.Discussion
The results of this study demonstrate the stability and clinical applicability of the new 3D gagCEST at 7 T. If we use the area under the curve of a range around the expected GAG effect, which is commonly used in literature 1,6,7, we find a GAG effect between 5.0% and 16.3% in healthy cartilage. These results are acquired within a clinically feasible scan time of seven minutes. The gagCEST results from patients with cartilage defects indicate a correlation with clinical findings.Acknowledgements
No acknowledgement found.References
1. Schmitt B, Zbýn S, Stelzeneder D, et al. Cartilage Quality Assessment by Using Glycosaminoglycan Chemical Exchange Saturation Transfer and 23 Na MR Imaging at 7 T 1. Radiology. 2011;260(1):257-264. doi:10.1148/radiol.11101841/-/DC1.
2. Krusche-Mandl I, Schmitt B, Zak L, et al. Long-term results 8 years after autologous osteochondral transplantation: 7 T gagCEST and sodium magnetic resonance imaging with morphological and clinical correlation. Osteoarthr Cartil. 2012;20(5):357-363. doi:10.1016/j.joca.2012.01.020.
3. Kogan F, Hargreaves B a., Gold GE. Volumetric multislice gagCEST imaging of articular cartilage: Optimization and comparison with T1rho. Magn Reson Med. 2016;00:n/a - n/a. doi:10.1002/mrm.26200.
4. Khlebnikov V, Geades N, Klomp DWJ, Hoogduin H, Gowland P, Mougin O. Comparison of pulsed three-dimensional CEST acquisition schemes at 7 tesla: steady state versus pseudosteady state. Magn Reson Med. July 2016. doi:10.1002/mrm.26323.
5. Zaiss M, Schmitt B, Bachert P. Quantitative separation of CEST effect from magnetization transfer and spillover effects by Lorentzian-line-fit analysis of z-spectra. J Magn Reson. 2011;211(2):149-155. doi:10.1016/j.jmr.2011.05.001.
6. Singh A, Haris M, Cai K, et al. Chemical exchange saturation transfer magnetic resonance imaging of human knee cartilage at 3 T and 7 T. Magn Reson Med. 2012;68:588-594. doi:10.1002/mrm.23250.
7. Schleich C, Bittersohl B, Miese F, et al. Glycosaminoglycan chemical exchange saturation transfer at 3T MRI in asymptomatic knee joints. Acta radiol. 2015;0(0):1-6. doi:10.1177/0284185115598811.
Figures