1975
Lorentzian Probabilistic Sum based Z-Spectrum fitting approach for computing CEST and NOE contrast and its Comparison with Lorentzian Sum and Asymmetry Analysis1Centre for Bio-Medical Engineering, Indian Institute of Technology Delhi (IIT Delhi), New Delhi, India, 2Department of Biomedical Engineering, All India Institute of Medical Sciences Delhi, India, New Delhi, India
Synopsis
In this study, we proposed a Z-spectrum fitting method based upon Lorentzian Probabilistic Sum (LPS) for computing CEST and NOE contrast. Proposed fitting method was tested on multi-pool Z-spectra data acquired using simulations and from in-vivo human brain data at 7T. Proposed fitting results were compared with asymmetry analysis and another fitting method based on Linear Sum (LS) of Lorentzian functions. Results of this study show that both LPS and LS nicely fit z-spectra; however, LPS provide more accurate estimation of NOE and CEST contrast. Therefore, proposed LPS model can be used for improved estimation of separate CEST and NOE components.
INTRODUCTION
Z-spectra1,2 has been used to study magnetization transfer (MT)3, chemical exchange saturation transfer (CEST)4-7 and exchange relayed Nuclear Overhauser enhancement (rNOE)8-10 effects. For in-vivo data, Z-spectrum is a function11 of direct saturation (DS), MT, CEST and rNOE effects. CEST contrast is generally computed using CEST asymmetry analysis which provides a mixed contrast from CEST, NOE and MT. Computation of individual CEST and NOE contrast is challenging task; alternative Z-spectra fitting based methods are being developed11. Linear Sum of Lorentzians (LS)12,13 has been used for computing individual contrast components14. Recently, Z-Spectra fitting using Lorentzian Probabilistic Summation (LPS) for two pools followed by subtraction was used to compute CrCEST12 . In this study, we propose a Z-spectrum fitting approach based upon LPS for multi-pool (three, four and five) data and compare the accuracy of results with conventional asymmetry and LS fitting for simulation and experimental data.METHODS
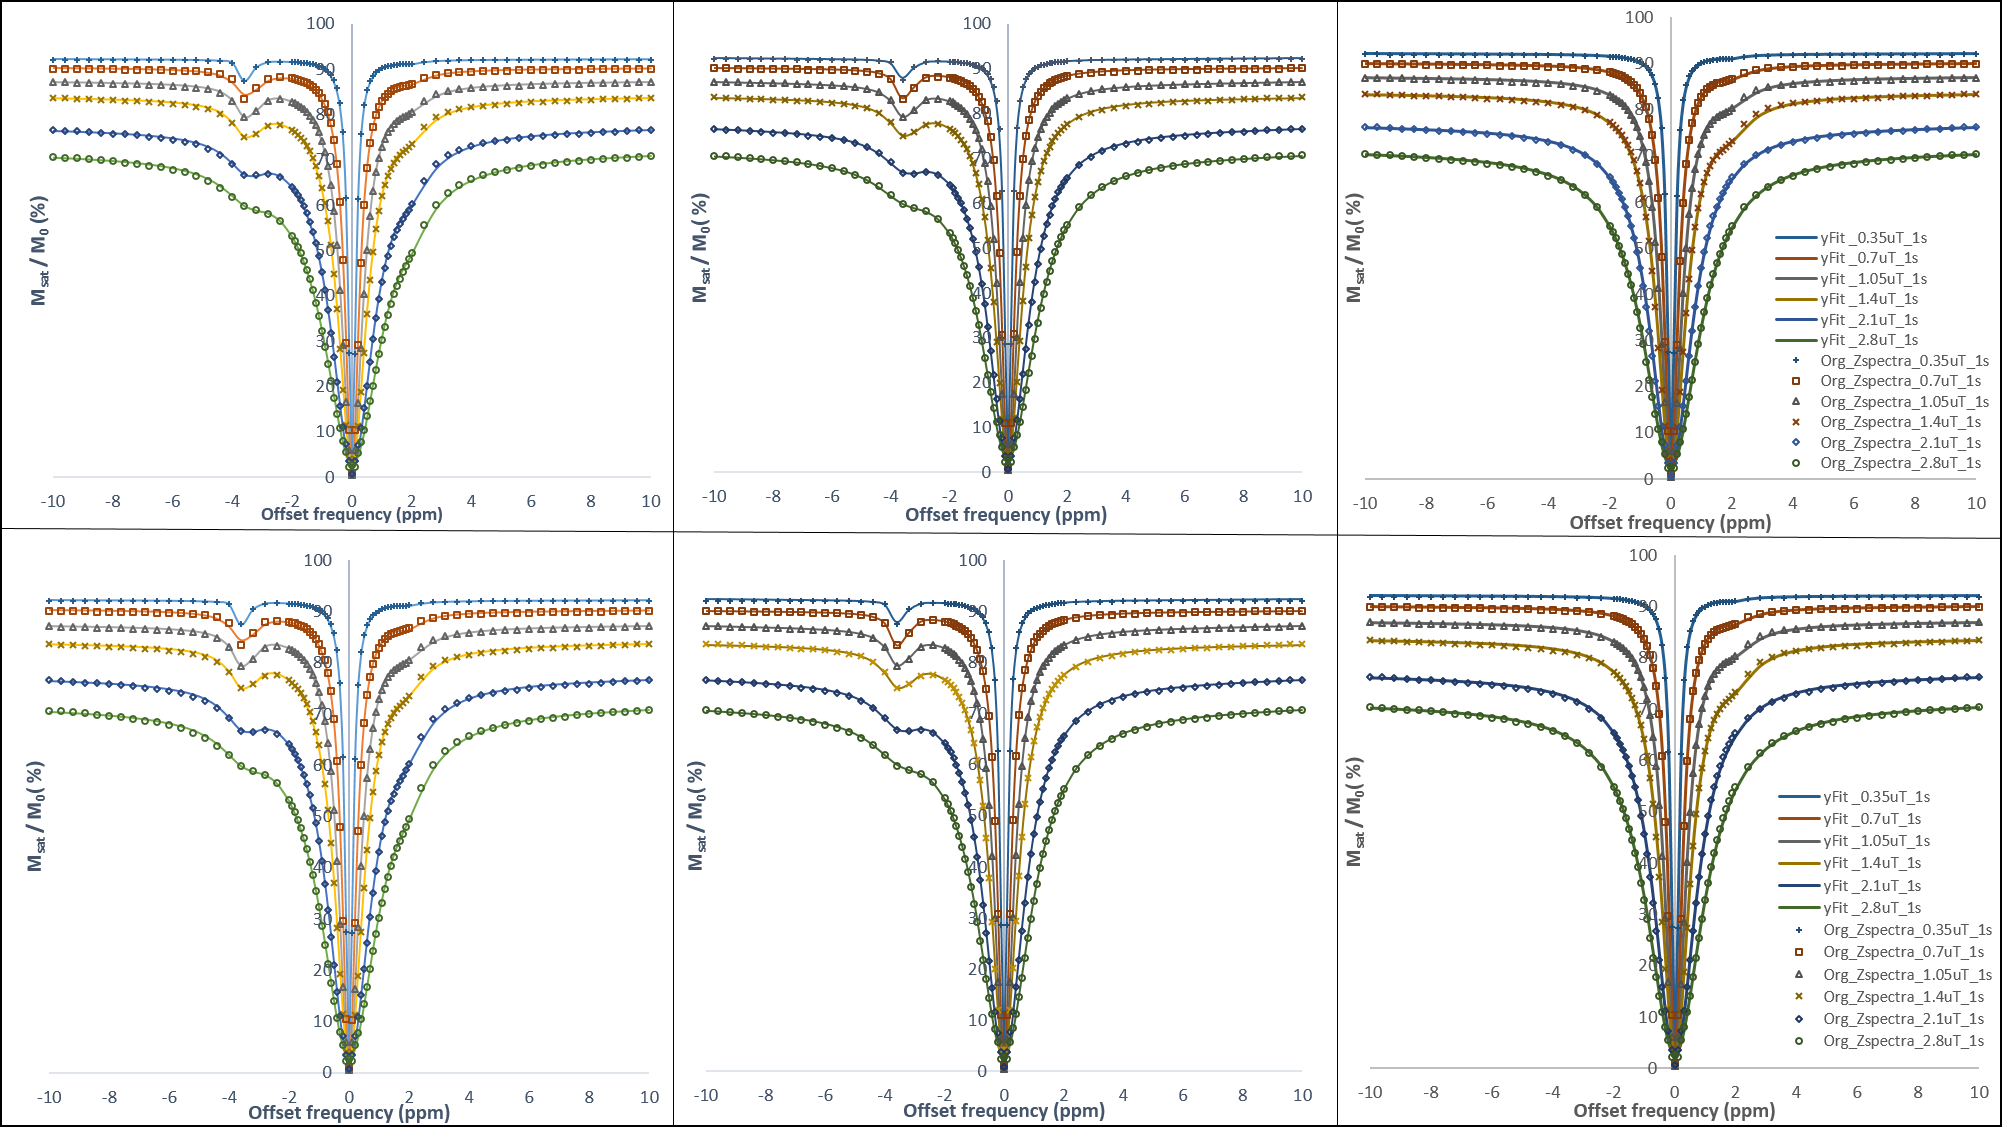
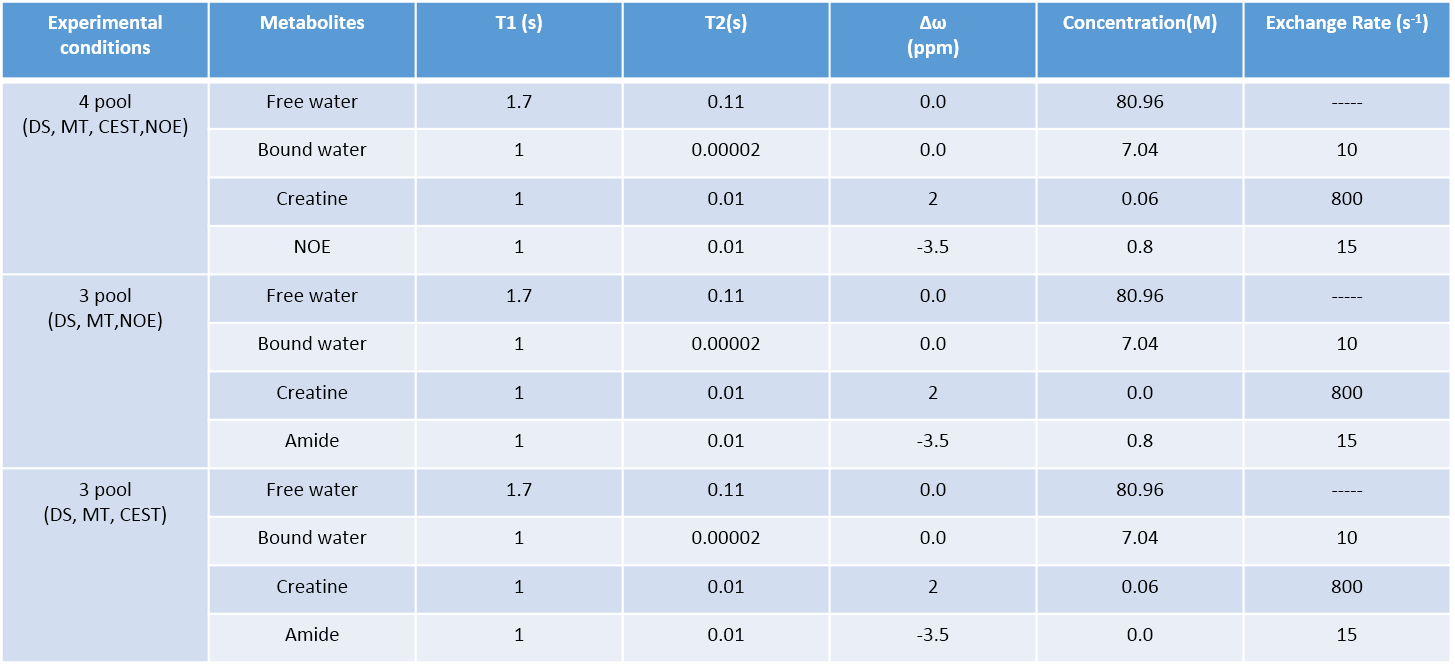
Numerical Simulation: For generating simulated Z-spectra, Bloch equation with three or four pool model was used9,15. Three types of Z-spectra were generated: Z-spectra with DS, MT, CEST, NOE ; with DS, MT, NOE ; with DS, MT, CEST for different saturation amplitude (root mean square B1 (B1rms)) (0.35 µT, 0.7 µT, 1.05 µT, 1.4 µT, 2.1 µT, 2.8µT) and duration 1s, 2s, 3s. Parameters12 for simulations are shown in Table-1.
MRI data acquisition: In-vivo MRI experiments were performed on 7T whole body human MRI scanner (Siemens, Germany) using a pulse sequence reported previously16. The study protocol consisted of the following steps: localizer, WASSR17, CEST and B1 map data collection. Data were acquired at following frequency offsets (∆ω):±0 to ±5ppm with 0.5ppm steps; ±6 to ±12 ppm with 1ppm steps. For CEST data, a saturation pulse length of 1s and multiple B1rms of 0.7 µT, 1.4 µT, 2.2 µT, 2.9µT were used.
Fitting functions and Procedures: In the current study, we fitted two types of Lorentzian functions18 to z-spectra – LPS and LS
$$ LPS = \sum_{i=1}^{N}L_i - \sum_{i=1}^{N-1}\sum_{j=i+1}^{N}L_iL_j + \sum_{i=1}^{N-2}\sum_{j=i+1}^{N-1}\sum_{k=j+1}^{N}L_iL_jL_k - \sum_{i=1}^{N-3}\sum_{j = i+1}^{N-2}\sum_{k=j+1}^{N-1}\sum_{m=k+1}^{N}L_iL_jL_kL_m +\prod_{i=1}^{N} L_i $$
$$ LS =\sum_{i=1}^{N}L_i $$
Where, Li (i=1 to 5) are the Lorentzian functions described as
$$ L (x,A,W,C) = A\times(1-(W/2)^{2}/((W/2)^{2}+(X-C)^{2}) ) $$
where A =amplitude, W=width, C =center, X =offset
Data Analysis : CEST asymmetry calculated as:
$$ CEST_{asy}(∆ω) = [(M_{sat}(-∆ω)–M_{sat}(+∆ω)) /M_{sat}(-∆ω)]\times100 $$
where Msat(±∆ω) are water magnetization obtained at ‘+’ or ‘–’ ∆ω.
All Data analysis was performed using in-house developed routines in MATLAB. At first Z-spectra fitting was performed on simulated data. Accuracy of fitting and contrast computation was evaluated by comparing with asymmetry analysis, particularly for 3-pool model. This was followed by voxel-wise fitting of human brain z-spectra data.
RESULTS
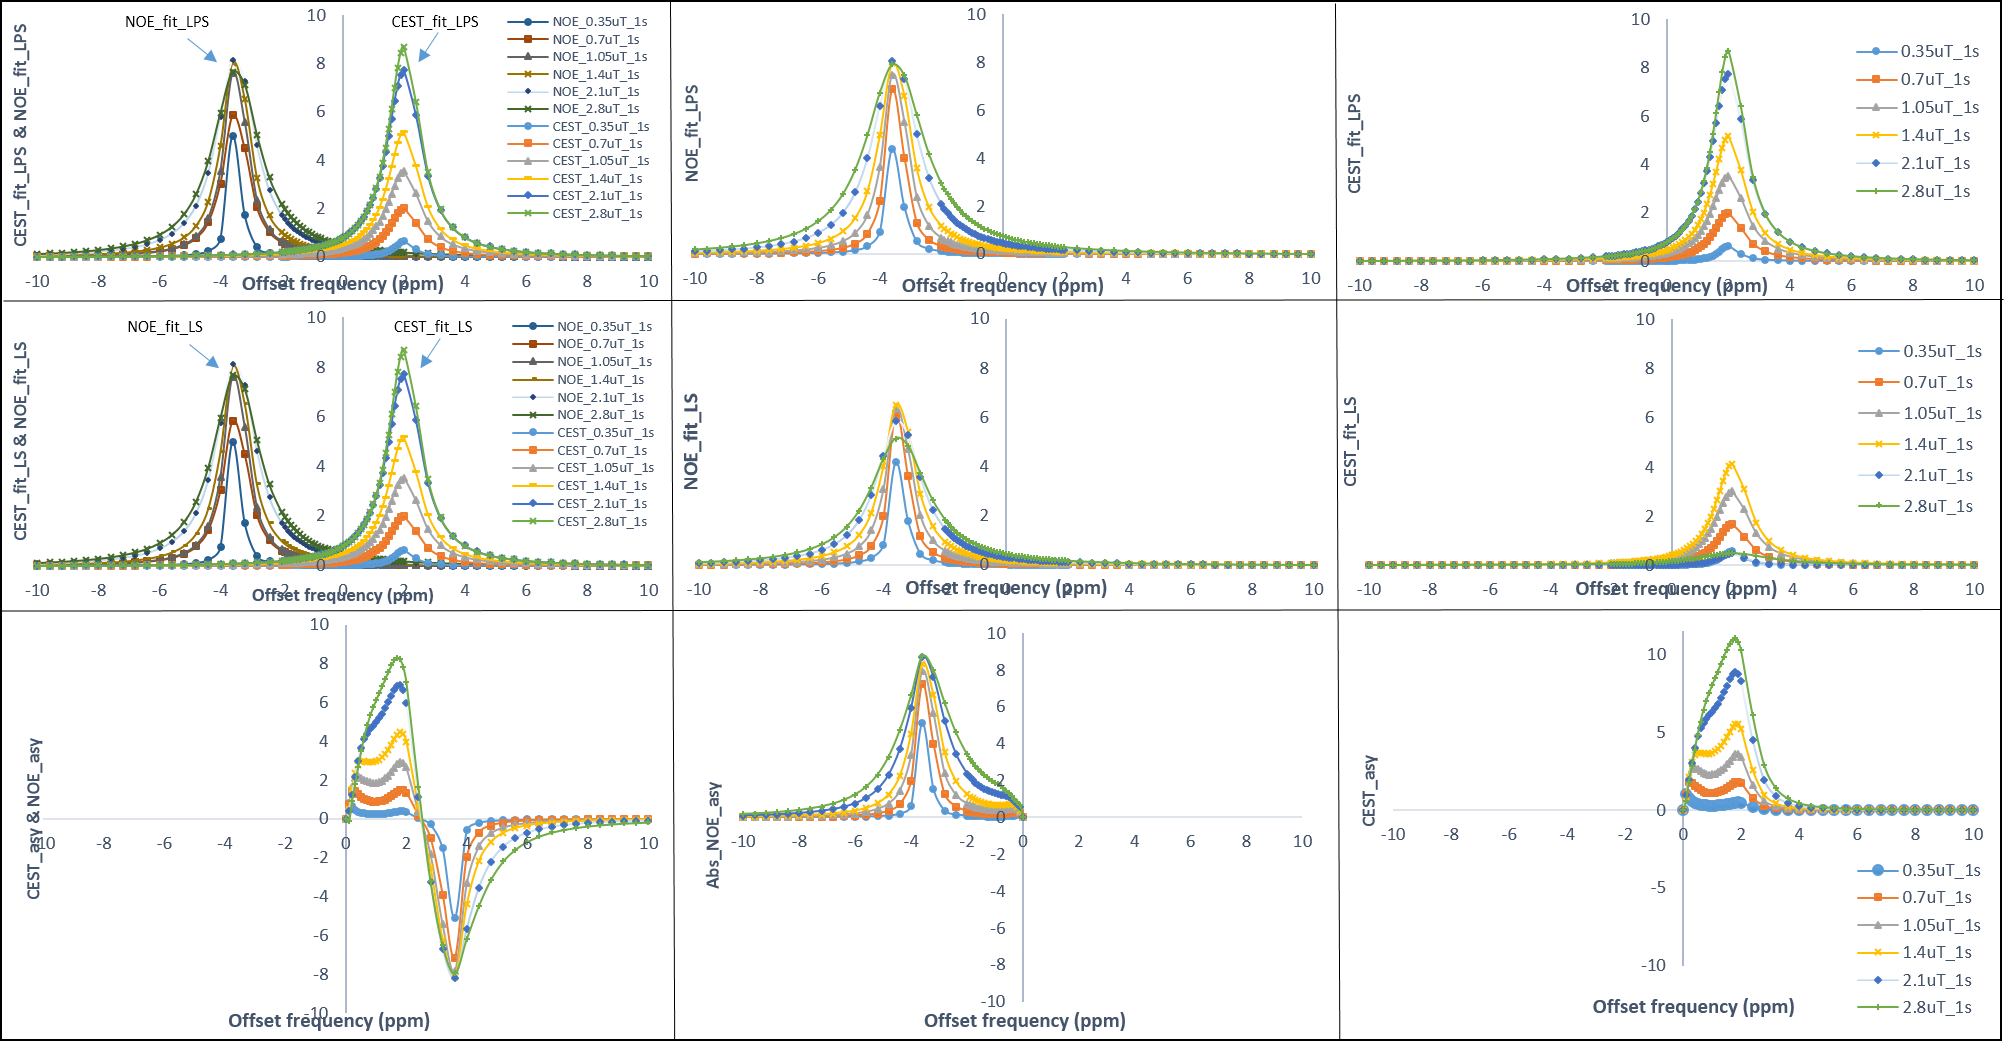
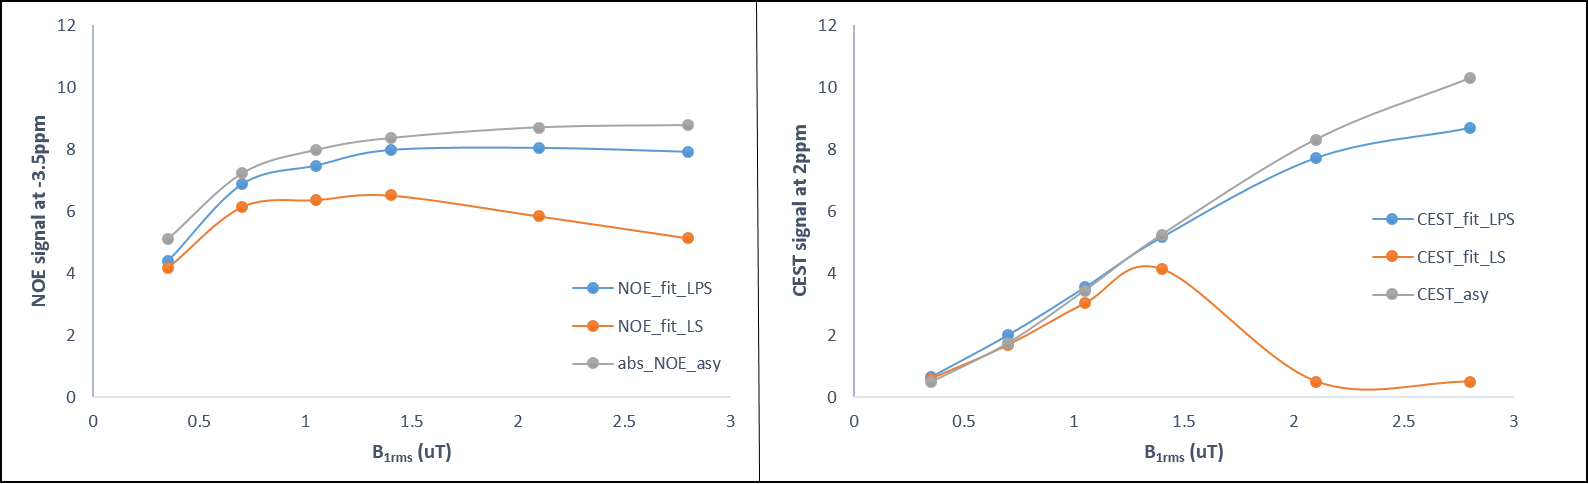
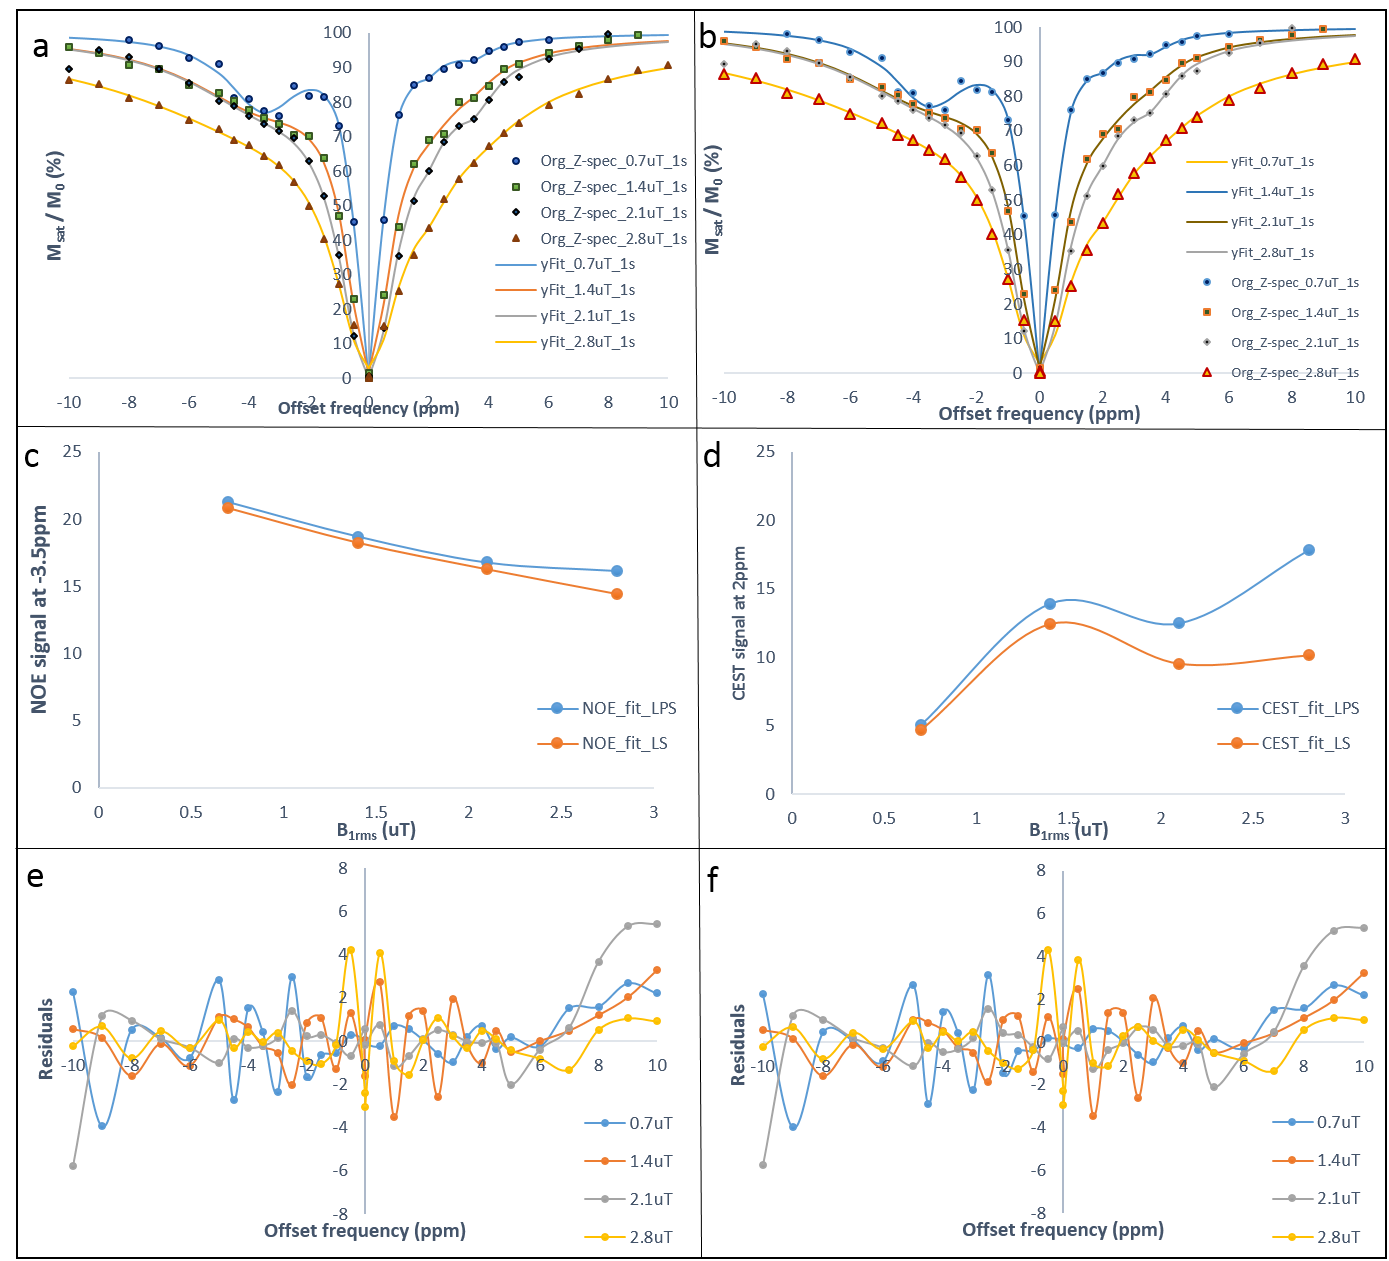
Fig.1shows that both model fits nicely (Goodness of fit (R2) ≈ 0.99) for different saturation parameters. NOE contrast using asymmetry (NOE_asy) is negative while it is positive using LPS and LS fitting approaches (Fig.2). While comparing NOE_fit with asymmetry analysis, we took absolute value of NOE_asy (abs_NOE_asy). In the case of three pool model (Fig.2, column-2), NOE contrast using LPS fitting (NOE_fit_LPS) at -3.5ppm provides almost similar values to that of abs_NOE_asy (Fig. 3). Similarly, CEST analysis, three pool model (Fig.2, column-3), from LPS is comparable to conventional CEST asymmetry (CESTasy) analysis. Results shows that LS model provides underestimation of CEST and NOE contrast compared to asymmetry analysis. Model fitted on different pulse saturation durations having same B1rms shows similar result. LPS and LS also fits well for in-vivo human data at 7T (Fig. 4, row-1). LS shows underestimation for fitting human Z-spectra (Fig. 4, row-2) data.DISCUSSION
Fitting based approaches provide separate estimation of contrast from individual pools. LPS model provide more accurate estimation of CEST and NOE contrast compared to LS. Main reason for underestimation of contrast using LS is that it considers all the pools to be mutually exclusive events (MEE). However, in Z-spectra, effect of various pools occurs simultaneously and overlaps. Therefore, assumption of MEE is wrong. On contary, LPS model make no such assumption and therefore provide accurate estimation of contrast. Another observation from CESTasy of simulated data is that part of the spectra close to water resonance deviate from the single Lorentzian line-shape (L.L). This might be due better saturation of spins close to water, which provide higher CEST effect. This asymmetric effect can be modeled by sum of two Lorentzian functions. However in this study, for demonstration purpose we have used a single CEST pool for simulation.CONCLUSION
In this study it was shown that proposed LPS based fitting for multi-pool Z-spectrum data provide better estimation of individual contrast components compared to conventional asymmetry analysis and LS fitting.Acknowledgements
The Authors acknowledge internal seed grant from IIT-Delhi; This project was partially supported by National Institute of Biomedical Imaging and Bioengineering of the NIH through Grant Number P41-EB015893 and Centre for Magnetic Resonance and Optical Imaging (CMROI), University of Pennsylvania. The Authors acknowledge Dr. Ravinder Reddy, Dr. Mohammad Haris, Dr Kejia Cai and Dr Hariharan for supporting acquisition of in-vivo human brain data.References
[1] R. G. Bryant, “No Title,” Biophys. Biomol. Struct, 1996. [2] M. Zaiss, J. Xu, S. Goerke, I. S. Khan, R. J. Singer, J. C. Gore, D. F. Gochberg, and P. Bachert, “Inverse Z -spectrum analysis for spillover- , MT- , and T 1 -corrected steady-state pulsed CEST-MRI – application to pH-weighted MRI of acute stroke,” no. October 2013, pp. 240–252, 2014. [3] R. M. Henkelman, G. J. Stanisz, and S. J. Graham, “Magnetization transfer in MRI,” pp. 57–64, 2001. [4] P. C. M. van Zijl, “Chemical Exchange Saturation Transfer (CEST): what is in a name and what isn’t?,” vol. 48, no. Suppl 2, pp. 1–6, 2010. [5] K. M. Ward, A. H. Aletras, and R. S. Balaban, “A New Class of Contrast Agents for MRI Based on Proton Chemical Exchange Dependent Saturation Transfer ( CEST ),” vol. 87, pp. 79–87, 2000. [6] J. Zhou and P. C. M. Van Zijl, “Chemical exchange saturation transfer imaging and spectroscopy,” vol. 48, pp. 109–136, 2006. [7] P. van zijl Jun Hua Johns, “In vivo 3D whole-brain pulsed steady state chemical exchange saturation transfer at 7T,” no. JUNE, 2012. [8] C. K. Jones, A. Huang, J. Xu, R. A. E. Edden, M. Sch??r, J. Hua, N. Oskolkov, D. Zac??, J. Zhou, M. T. McMahon, J. J. Pillai, and P. C. M. van Zijl, “Nuclear Overhauser enhancement (NOE) imaging in the human brain at 7T,” Neuroimage, vol. 77, pp. 114–124, 2013. [9] D. Liu1, “Quantitative Characterization of NOE and APT Effects in the Human Brain at 7 Tesla,” vol. 70, no. 4, pp. 1070–1081, 2014. [10] M. Zaiss, J. Windschuh, D. Paech, J. Meissner, S. Burth, B. Schmitt, P. Kickingereder, B. Wiestler, W. Wick, M. Bendszus, H. Schlemmer, M. E. Ladd, P. Bachert, and A. Radbruch, “NeuroImage Relaxation-compensated CEST-MRI of the human brain at 7 T?: Unbiased insight into NOE and amide signal changes in human glioblastoma,” Neuroimage, vol. 112, pp. 180–188, 2015. [11] S. A. Cai, Kejia, “CEST Signal at 2ppm (CEST@2ppm) from Z-Spectral Fitting Correlates with Creatine Distribution in Brain Tumor,” NMR Biomed, vol. 28, no. 1, pp. 1–8. [12] M. Haris, A. Singh, K. Cai, F. Kogan, J. Mcgarvey, C. Debrosse, G. A. Zsido, W. R. T. Witschey, K. Koomalsingh, J. J. Pilla, J. A. Chirinos, V. A. Ferrari, J. H. Gorman, H. Hariharan, R. C. Gorman, and R. Reddy, “A technique for in vivo mapping of myocardial creatine kinase metabolism,” Nat. Med., no. November 2012, pp. 1–7, 2014. [13] A. Singh, M. Haris, K. Cai, F. Kogan, W. R. Witschey, G. A. Zsido, J. Mcgarvey, K. Komalsingh, R. P. Nanga, and J. J. Pilla, “Z-Spectrum Fitting for CEST Contrast Computation in In Vivo Myocardium Tissue,” 2013. [14] M. Zaiß, B. Schmitt, and P. Bachert, “Quantitative separation of CEST effect from magnetization transfer and spillover effects by Lorentzian-line-fit analysis of z-spectra,” vol. 211, pp. 149–155, 2011. [15] A. X. Li, R. H. E. Hudson, J. W. Barrett, C. K. Jones, S. H. Pasternak, and R. Bartha, “Four-Pool Modeling of Proton Exchange Processes in Biological Systems in the Presence of MRI – Paramagnetic Chemical Exchange Saturation Transfer ( PARACEST ) Agents,” vol. 1206, pp. 1197–1206, 2008. [16] J. Zhou, H. Zhu, M. Lim, L. Blair, A. Quinones-Hinojosa, S. A. Messina, C. G. Eberhart, M. G. Pomper, J. Laterra, P. B. Barker, P. C. M. Van Zijl, and J. O. Blakeley, “Three-dimensional amide proton transfer MR imaging of gliomas: Initial experience and comparison with gadolinium enhancement,” J. Magn. Reson. Imaging, vol. 38, no. 5, pp. 1119–1128, 2013. [17] M. Kim, J. Gillen, B. A. Landman, J. Zhou, and P. C. M. Van Zijl, “Water Saturation Shift Referencing ( WASSR ) for Chemical Exchange Saturation Transfer ( CEST ) Experiments,” vol. 1450, pp. 1441–1450, 2009. [18] A. Singh, “Z-Spectrum Fitting for CEST Contrast Computation in In Vivo Myocardium Tissue,” in ISMRM, 2013.Figures