1974
Quantification of Multi-pool Contribution to Endogeneous CEST Effects in Global Ischemia1Massachusetts General Hospital and Harvard Medical School, Charlestown, MA, United States, 2Department of Radiology, 3rd Affiliated Hospital, Zhengzhou University, Henan, People's Republic of China
Synopsis
CEST MRI has been used for quantitative assessment of dilute metabolites and/or pH in ischemic tissue and in tumors. However, conventional asymmetry analysis (MTRasym) may be confounded by concomitant effects such as RF spillover, semisolid macromolecular MT and NOE effects. Therefore, decoupling multiple contributions is essential for elucidating the origins of in vivo CEST contrast for improved quantification. Here we used an Image Downsampling Expedited Adaptive Least-squares (IDEAL) fitting algorithm which is not strongly constrained by image SNR and initial values for fitting. It provides a closer estimation of MTRasym that calculated from acquired data than voxel-wise multi-pool Lorentzian fitting and unravels the major contributors to CEST contrasts between white and gray matters as well as to the CEST changes after global ischemia.
Purpose
Sensitive to labile protons, CEST MRI has been used for quantitative assessment of metabolic contents and microenvironment properties such as pH in ischemic tissue1-3 and in tumors4-7. However, conventional CEST quantification using asymmetry analysis (MTRasym) may be confounded by concomitant effects such as RF spillover, semisolid macromolecular magnetization transfer (MT) and nuclear overhauser effects (NOE). Therefore, decoupling multiple contributions is essential for elucidating the origins of in vivo CEST contrast for improved quantification. Voxel-wise multi-pool Lorentzian fitting has been employed to resolve contributions from APT, spillover, MT, NOE, etc8-11, but its reliability can be constrained by image signal-to-noise ratio (SNR), initial values and boundary values. In this study, we aimed to decouple the major contributors to the CEST contrasts between white and gray matters as well as to the CEST changes after global ischemia using an Image Downsampling Expedited Adaptive Least-squares (IDEAL) fitting algorithm that quantifies CEST images based on initial values from multi-Lorentzian fitting of iteratively less downsampled images.Methods
Multiparametric MRI including T1, T2, DWI and PWI were performed on adult male Wistar rats (N=6) before and after global (cardiac arrest) cerebral ischemia using a 4.7T Bruker scanner. In vivo Z-spectrum was acquired from -6ppm to 6ppm with intervals of 0.25ppm and B1=0.75/1.5µT, TR/TS/TE=10s/5s/15ms, 2 averages. Conventional voxel-wise fitting of the Z-spectrum using a five-pool Lorentzian model (water, MT, APT, amine and NOE) was performed with loosely constrained bounds between 10% and 10 times of the initial values for amplitude and linewidth, and ±20% of the corresponding linewidth for offset of each proton pool. The IDEAL fitting method uses high-SNR Z-spectrum averaged from all voxels within the brain for initial fitting with the same relaxed boundary constraints. This fitting result is then used as initial values for subsequent voxel-wise fitting of substantially downsampled CEST images (4×4) with tightly constrained bounds of ±10% these initial values for amplitude and linewidth, and ±5% of the corresponding linewidth for frequency offset. The same procedure was repeated sequentially for the CEST images downsampled to 8×8, 16×16, 32×32, etc., till the original image size of 64×64, with the initial values of each voxel determined by interpolating the fitted amplitude/linewidth/offset maps of the last downsampled images.Results and Discussion
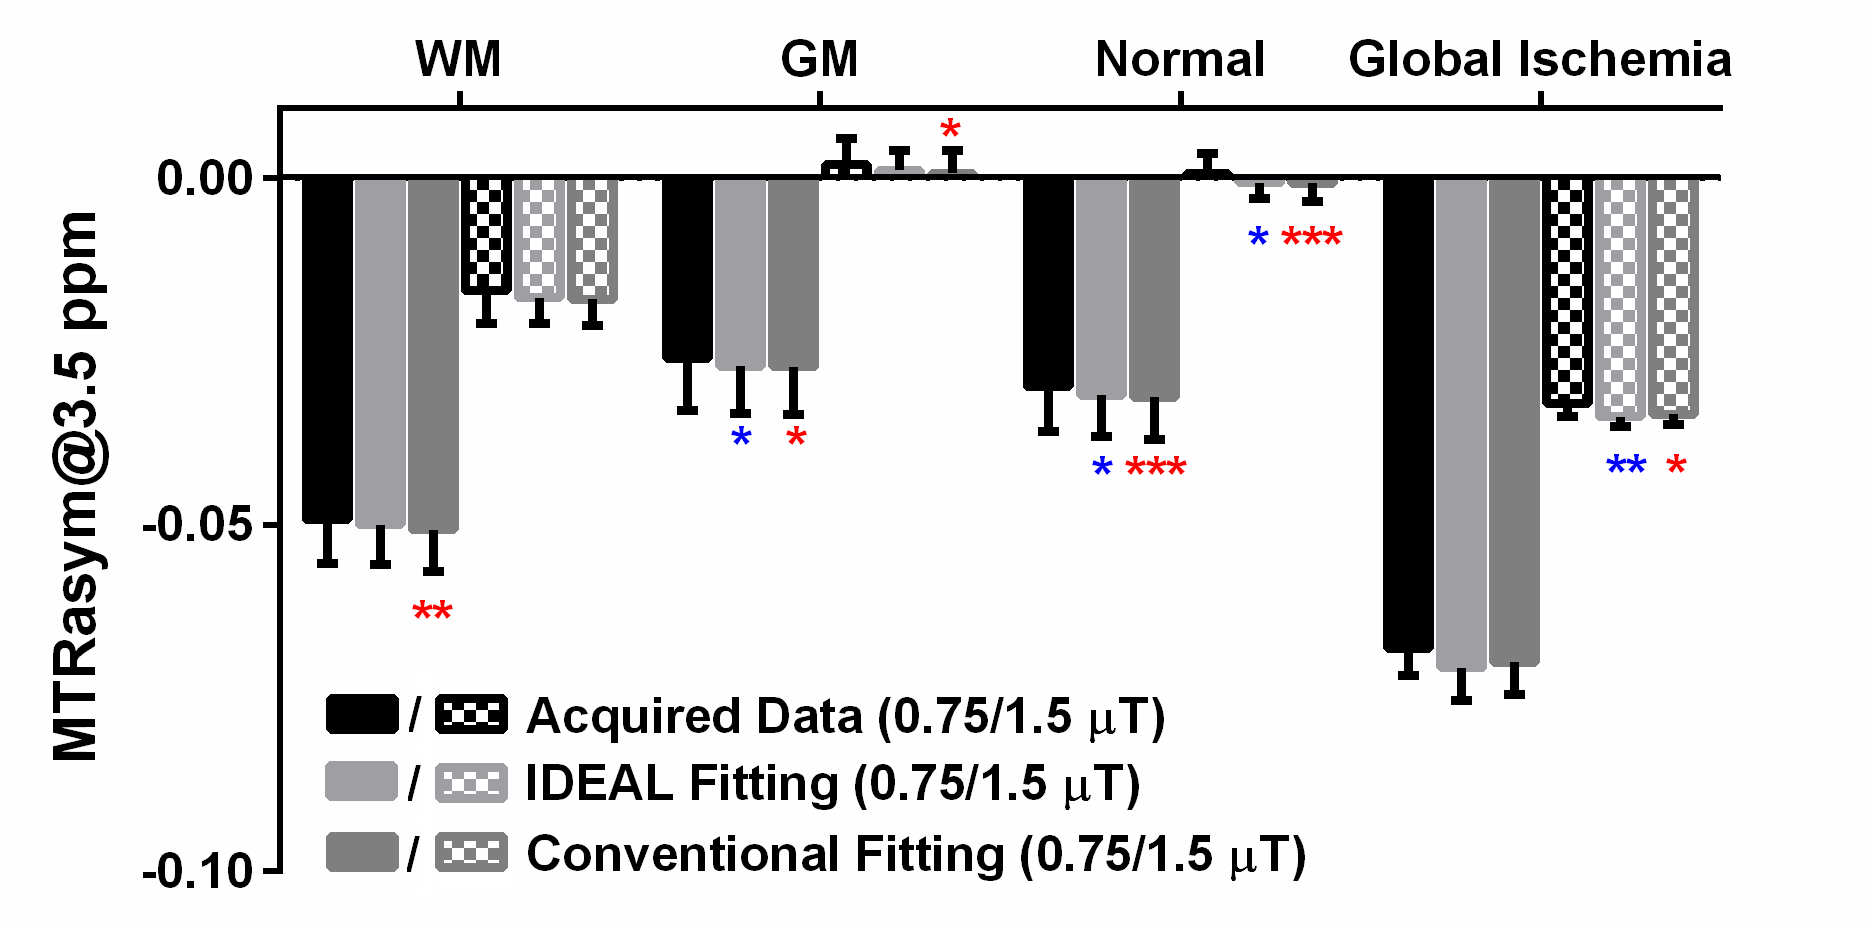
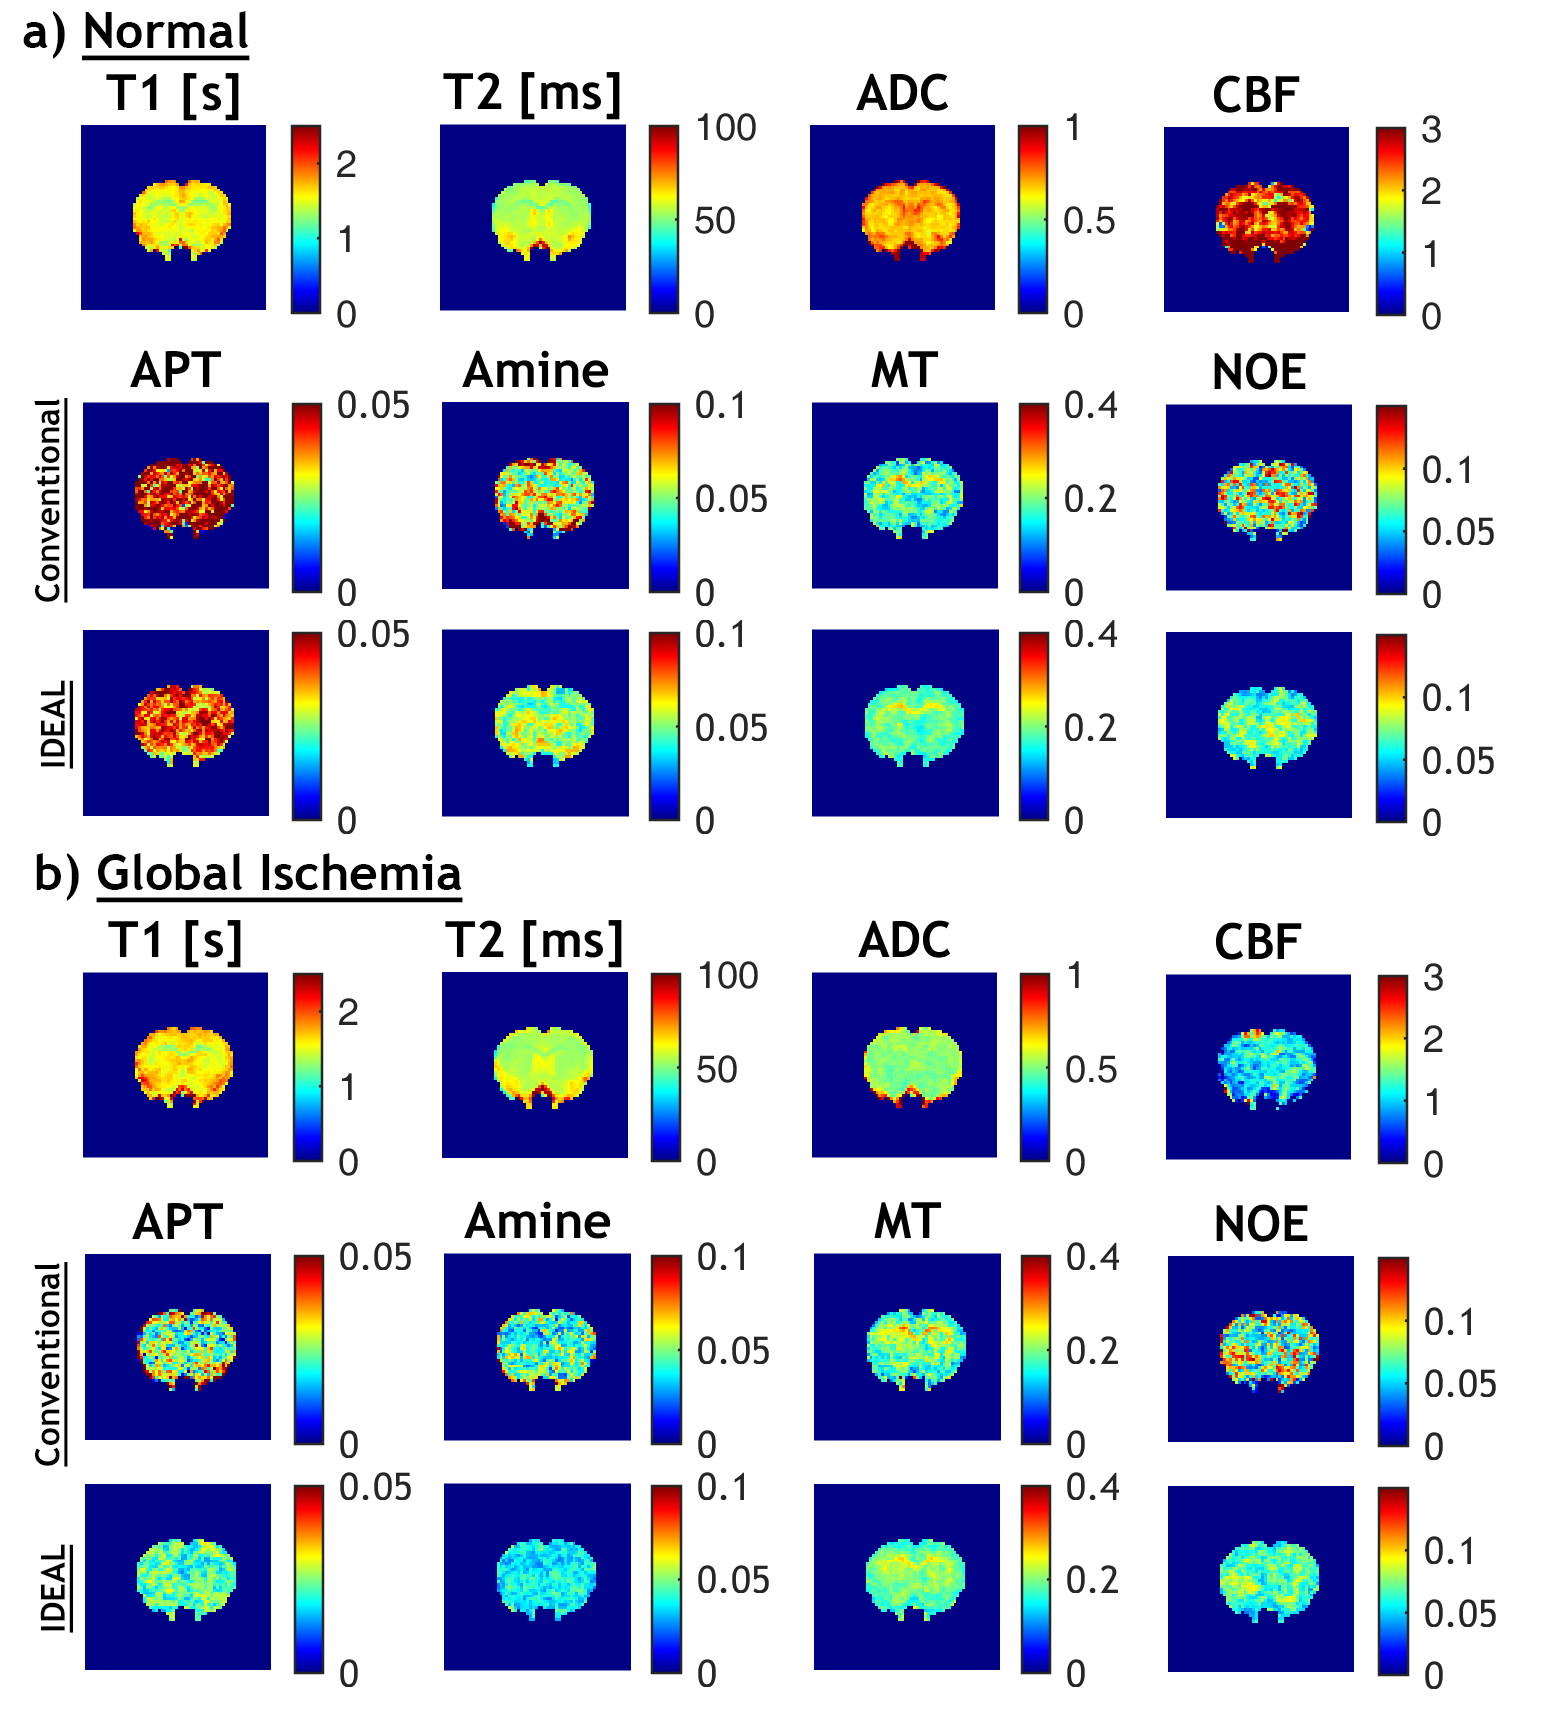
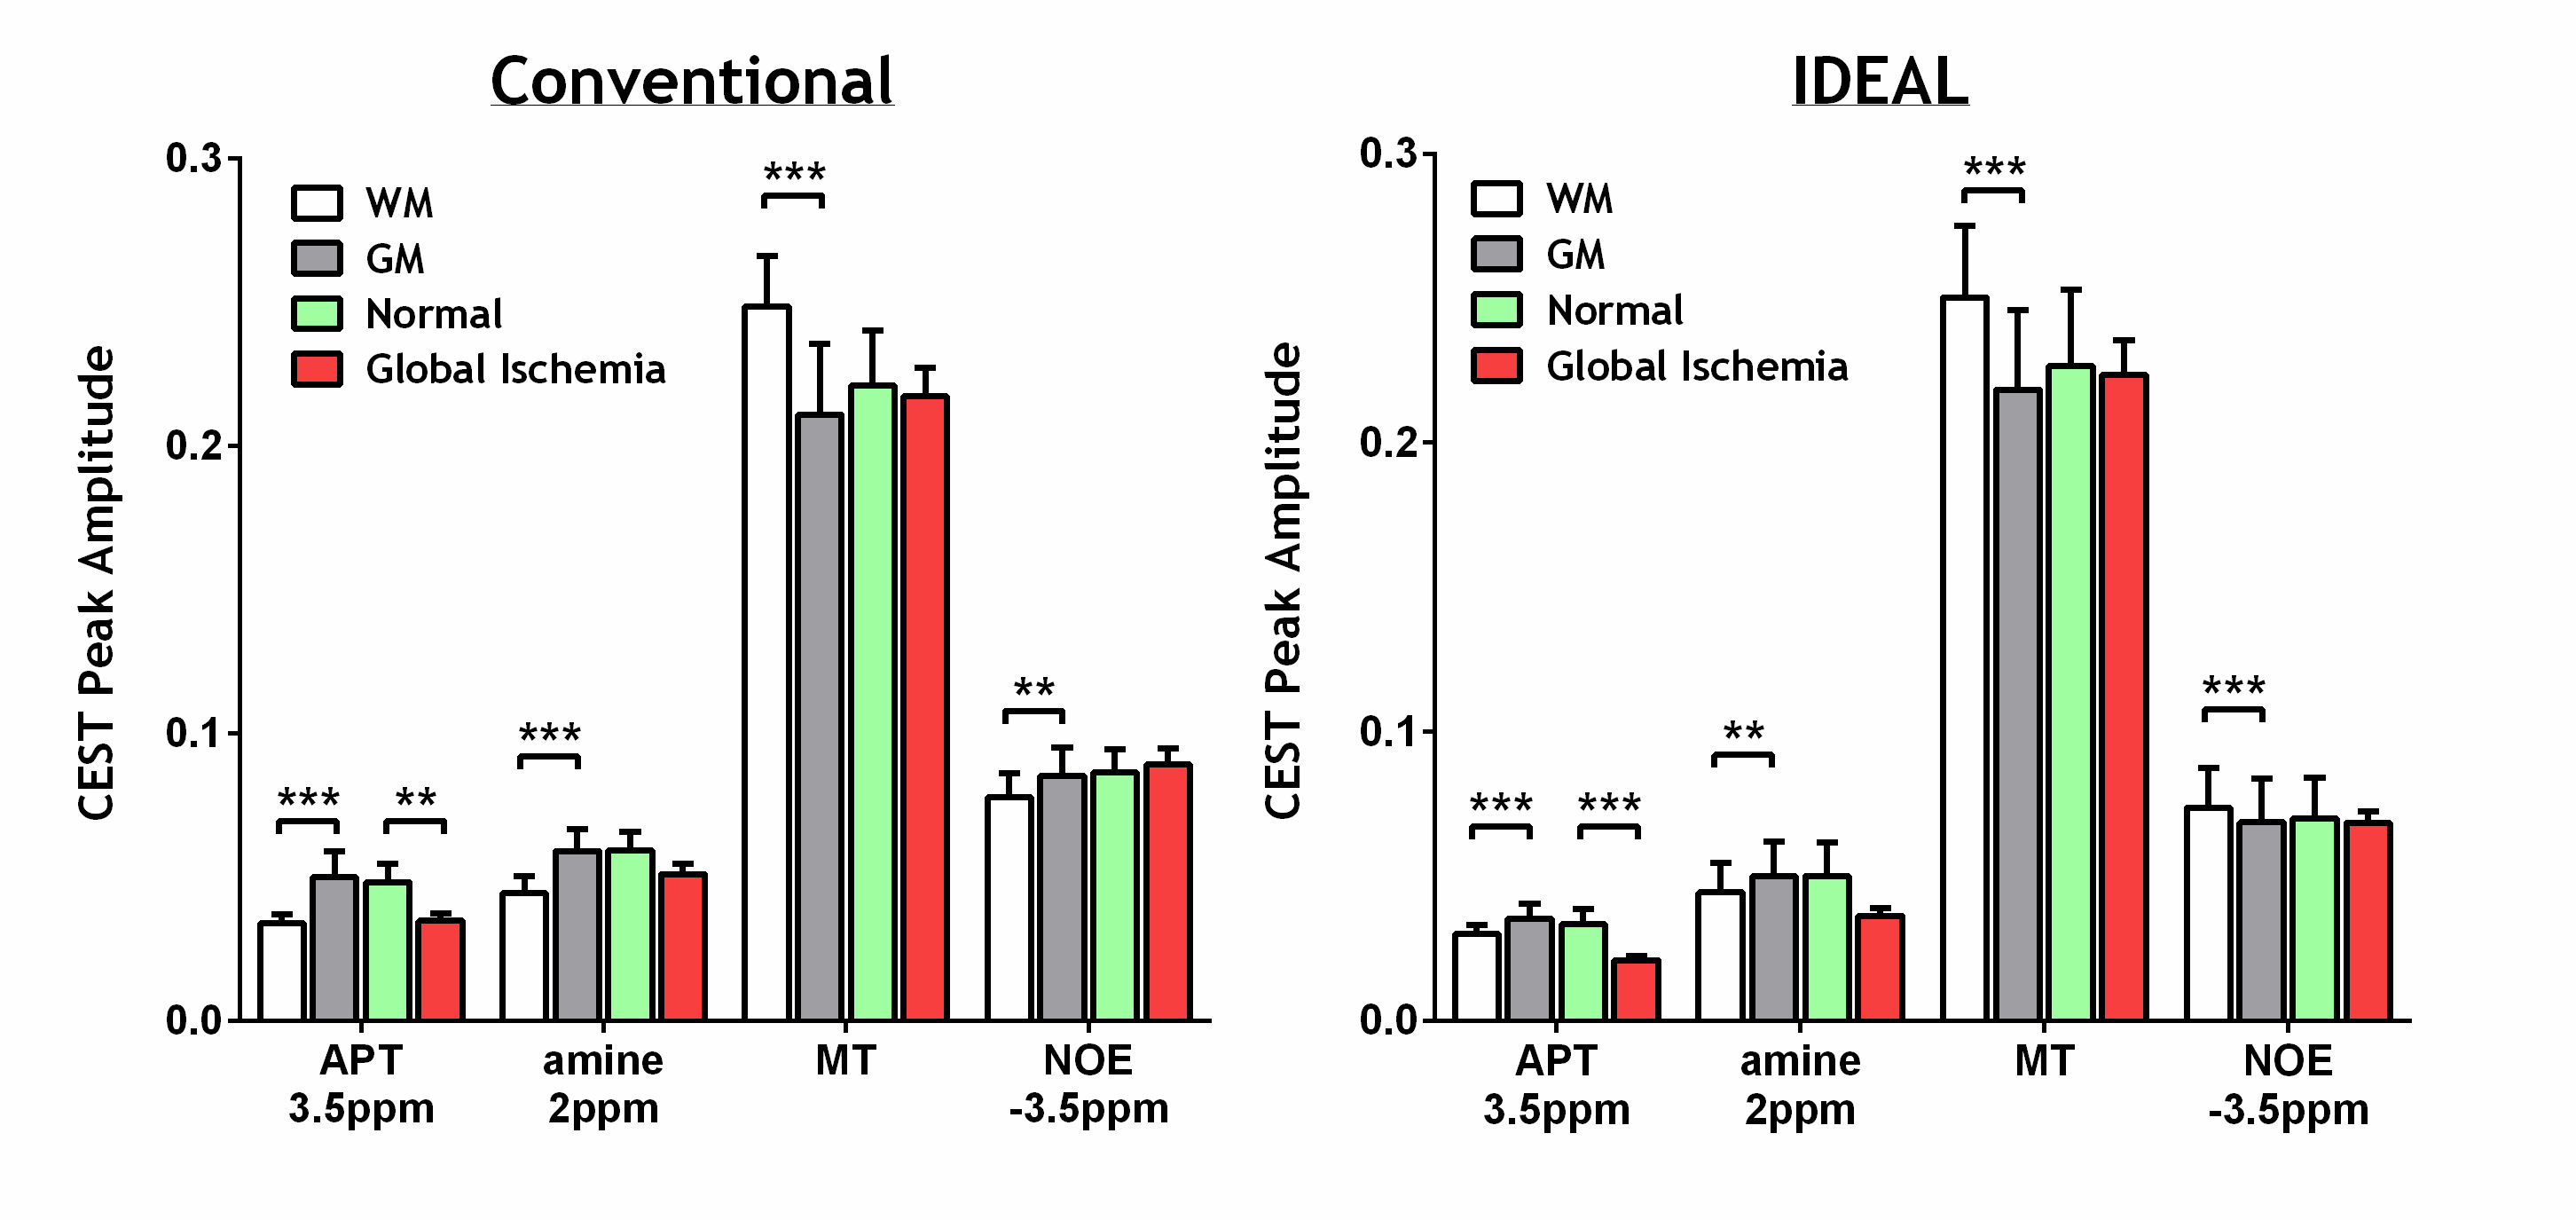
Figure 1 compares the MTRasym (3.5ppm) calculated from the acquired Z-spectrum and the fitted Z-spectrum using IDEAL or conventional fitting methods. All the measurements revealed pronounced contrasts between white matter (WM) and gray matter (GM) in normal brain as well as before and after global ischemia (p<0.001 for both B1 powers) with significantly stronger difference between normal and ischemic tissues observed at B1=0.75 µT (p<0.05). The IDEAL fitting provided a closer estimation of the MTRasym calculated from the acquired data while the conventional fitting method generally overestimated the effects. Figure 2 shows the T1, T2, ADC, CBF maps and fitted amplitude maps of each pool at B1=0.75 µT from a representative rat brain before and after global ischemia. Global ischemia resulted in significant reductions in ADC and CBF with subtle changes in T1 and T2 maps. Compared to the conventional approach, the IDEAL fitting provides significantly smaller coefficient of variation (standard deviation/mean) for all the fitted pools (p<0.001), leading to higher contrast-to-noise ratios (CNRs) between different tissue types (WM vs. GM, normal vs. ischemic). ROI analysis showed that both fitting methods revealed pronounced APT, amine, MT and NOE contrasts between WM and GM (Figure 3). However, in contrast to larger NOE in GM using conventional method, a stronger NOE was found in WM using the IDEAL method, similar to previous finding using three offset measurement12 and extrapolated MT reference approach13. In the ischemic brain, both conventional and IDEAL methods identified APT as the only pool that showed significant change in peak amplitude. Meanwhile, the change of -3.77% in MTRasym (3.5ppm) of the acquired Z-spectrum at 0.75 µT is dominated by contributions from APT (-1.49%, -1.12%), MT (-1.29%, -1.62%) and amine (-0.85%, -1.36%) as estimated by conventional and IDEAL methods, respectively. In summary, IDEAL fitting method provides an alternative means to resolve multi-pool contributions to CEST contrast with improved CNR.Acknowledgements
No acknowledgement found.References
[1] Sun PZ, et al. J Cereb Blood Flow Metab 2007;27:1129-36.
[2] Sun PZ, et al. J Cereb Blood Flow Metab 2011;31:1743-50.
[3] Zaiss M, et al. NMR in biomedicine 2014;27:240-52.
[4] Xu J, et al. NMR in biomedicine 2014;27:406-16.
[5] Desmond KL, et al. Magn Reson Med 2014;71:1841-53.
[6] Chen LQ, et al. Magn Reson Med 2014;72:1408-17.
[7] Sagiyama K, et al. Proc Natl Acad Sci U S A 2014;111:4542-7.
[8] Zaiss M, et al. NeuroImage 2015;112:180-8.
[9] Windschuh J, et al. NMR in biomedicine 2015;28:529-37.
[10] Jones CK, et al. NeuroImage 2013;77:114-24.
[11] Zaiss M, et al. J Magn Reson 2011;211:149-55.
[12] Jin T, et al. Magn Reson Med 2013;69:760-70.
[13] Heo HY, et al. Magn Reson Med 2016;75:137-49.
Figures