1973
The comparison of different strategies for transmit field inhomogeneity correction of Amide-CEST and NOE effects at 7T1Department of Radology, University Medical Center Utrecht, Utrecht, Netherlands, 2Division of Medical Physics in Radiology, Deutsches Krebsforschungszentrum (DKFZ) [German Cancer Research Center], Heidelberg, Germany, 3Spinoza Center for Neuroimaging, Amsterdam, Netherlands, 4Scheffler, Max Planck Institute for Biological Cybernetics, Tübingen, Germany
Synopsis
We compared three methods for B1 correction of relaxation-compensated Amide-CEST and Nuclear Overhauser Enhancement (NOE) effects at 7T: (1) a linear model; (2) the eight-point interpolation method; and (3) Bloch-McConnell equations (BE) correction algorithm. In the low B1 regime of 0.10 - 0.50 µT, a simple linear model is sufficient to mitigate B1 inhomogeneity of Amide-CEST and NOE effects at 7T.
Target audience.
Those interested in the application of Chemical Exchange Saturation Transfer (CEST).Introduction.
B1 inhomogeneity correction is vital for high-field CEST-MRI applications. In this work, we compared three methods for B1 correction of relaxation-compensated Amide-CEST and Nuclear Overhauser Enhancement (NOE) effects at 7T: (1) a linear model; (2) the eight-point interpolation method [1]; and (3) Bloch-McConnell equations (BE) correction algorithm.Methods. Data acquisition.
The experiments were performed on a 7 T MR whole-body system (Siemens, Erlangen, Germany). All data was acquired from the same consented volunteer. Z-spectra were acquired at eight B1 levels (average power [2] 0.14, 0.29, 0.43, 0.50, 0.58, 0.65, 0.72, and 0.80 µT) and sampled at 66 frequency offsets using a train of 120 (15ms, duty-cycle 60%) GR-spoiled Gaussian-shaped pulses for saturation. The readout was a single-shot 2D gradient-echo sequence (GRE) with GRAPPA factor 2, TR/TE/FA=7.4ms/3.6ms/10°, matrix 128x128, slice thickness 5mm. Total scan time was 4min07s [3]. WASSR method was used for B0 correction [4]. A relative B1 map was generated using a single-shot GRE sequence. White matter (WM) and grey matter (GM) masks were generated in FSL (FMRIB v6.0, UK). The apparent exchange dependent relaxation (AREX or relaxation compensated MTRRex) [5,6], was not calculated, since the B1 dependency remains the same for MTRRex and AREX.Methods. Data processing.
Z-spectra were fitted using six-pool (water, Amide-CEST, NOE, magnetization transfer, Amine-CEST [1] and NOE* [7] BE at a single B1 level (the only fixed parameter in the fit and defined as B1,nominal•B1,relative) at any given time. Amide-CEST effect size was quantified using the inverse metrics to suppress the effects of direct water saturation and traditional magnetization transfer [5,6]:
MTRRex,Amide = 1/Lab - 1/Ref (1)
where Lab = Mz(Δω, Mb = 1)/M0 and Ref = Mz(Δω, Mb = 0)/M0 are the signals in the Z-spectrum at Δω = 3.5 ppm, M0 is the equilibrium magnetization (Δω = 500 ppm) and Mb is the amplitude (Mb = 0 and Mb = 1 for the system without and with Amide-CEST pool, respectively). A similar equation applies to the NOE pool (MTRRex,NOE) at Δω =-3.5 ppm. Both the linear and BE B1 correction algorithms are explained in Fig. 1. The eight-point contrast-based interpolation B1 correction (the golden standard used as a reference) was implemented by interpolating between all contrast maps (MTRRex,Amide or MTRRex,NOE) at all B1 levels to a B1 of 0.43 µT [1].
Results and Discussion.
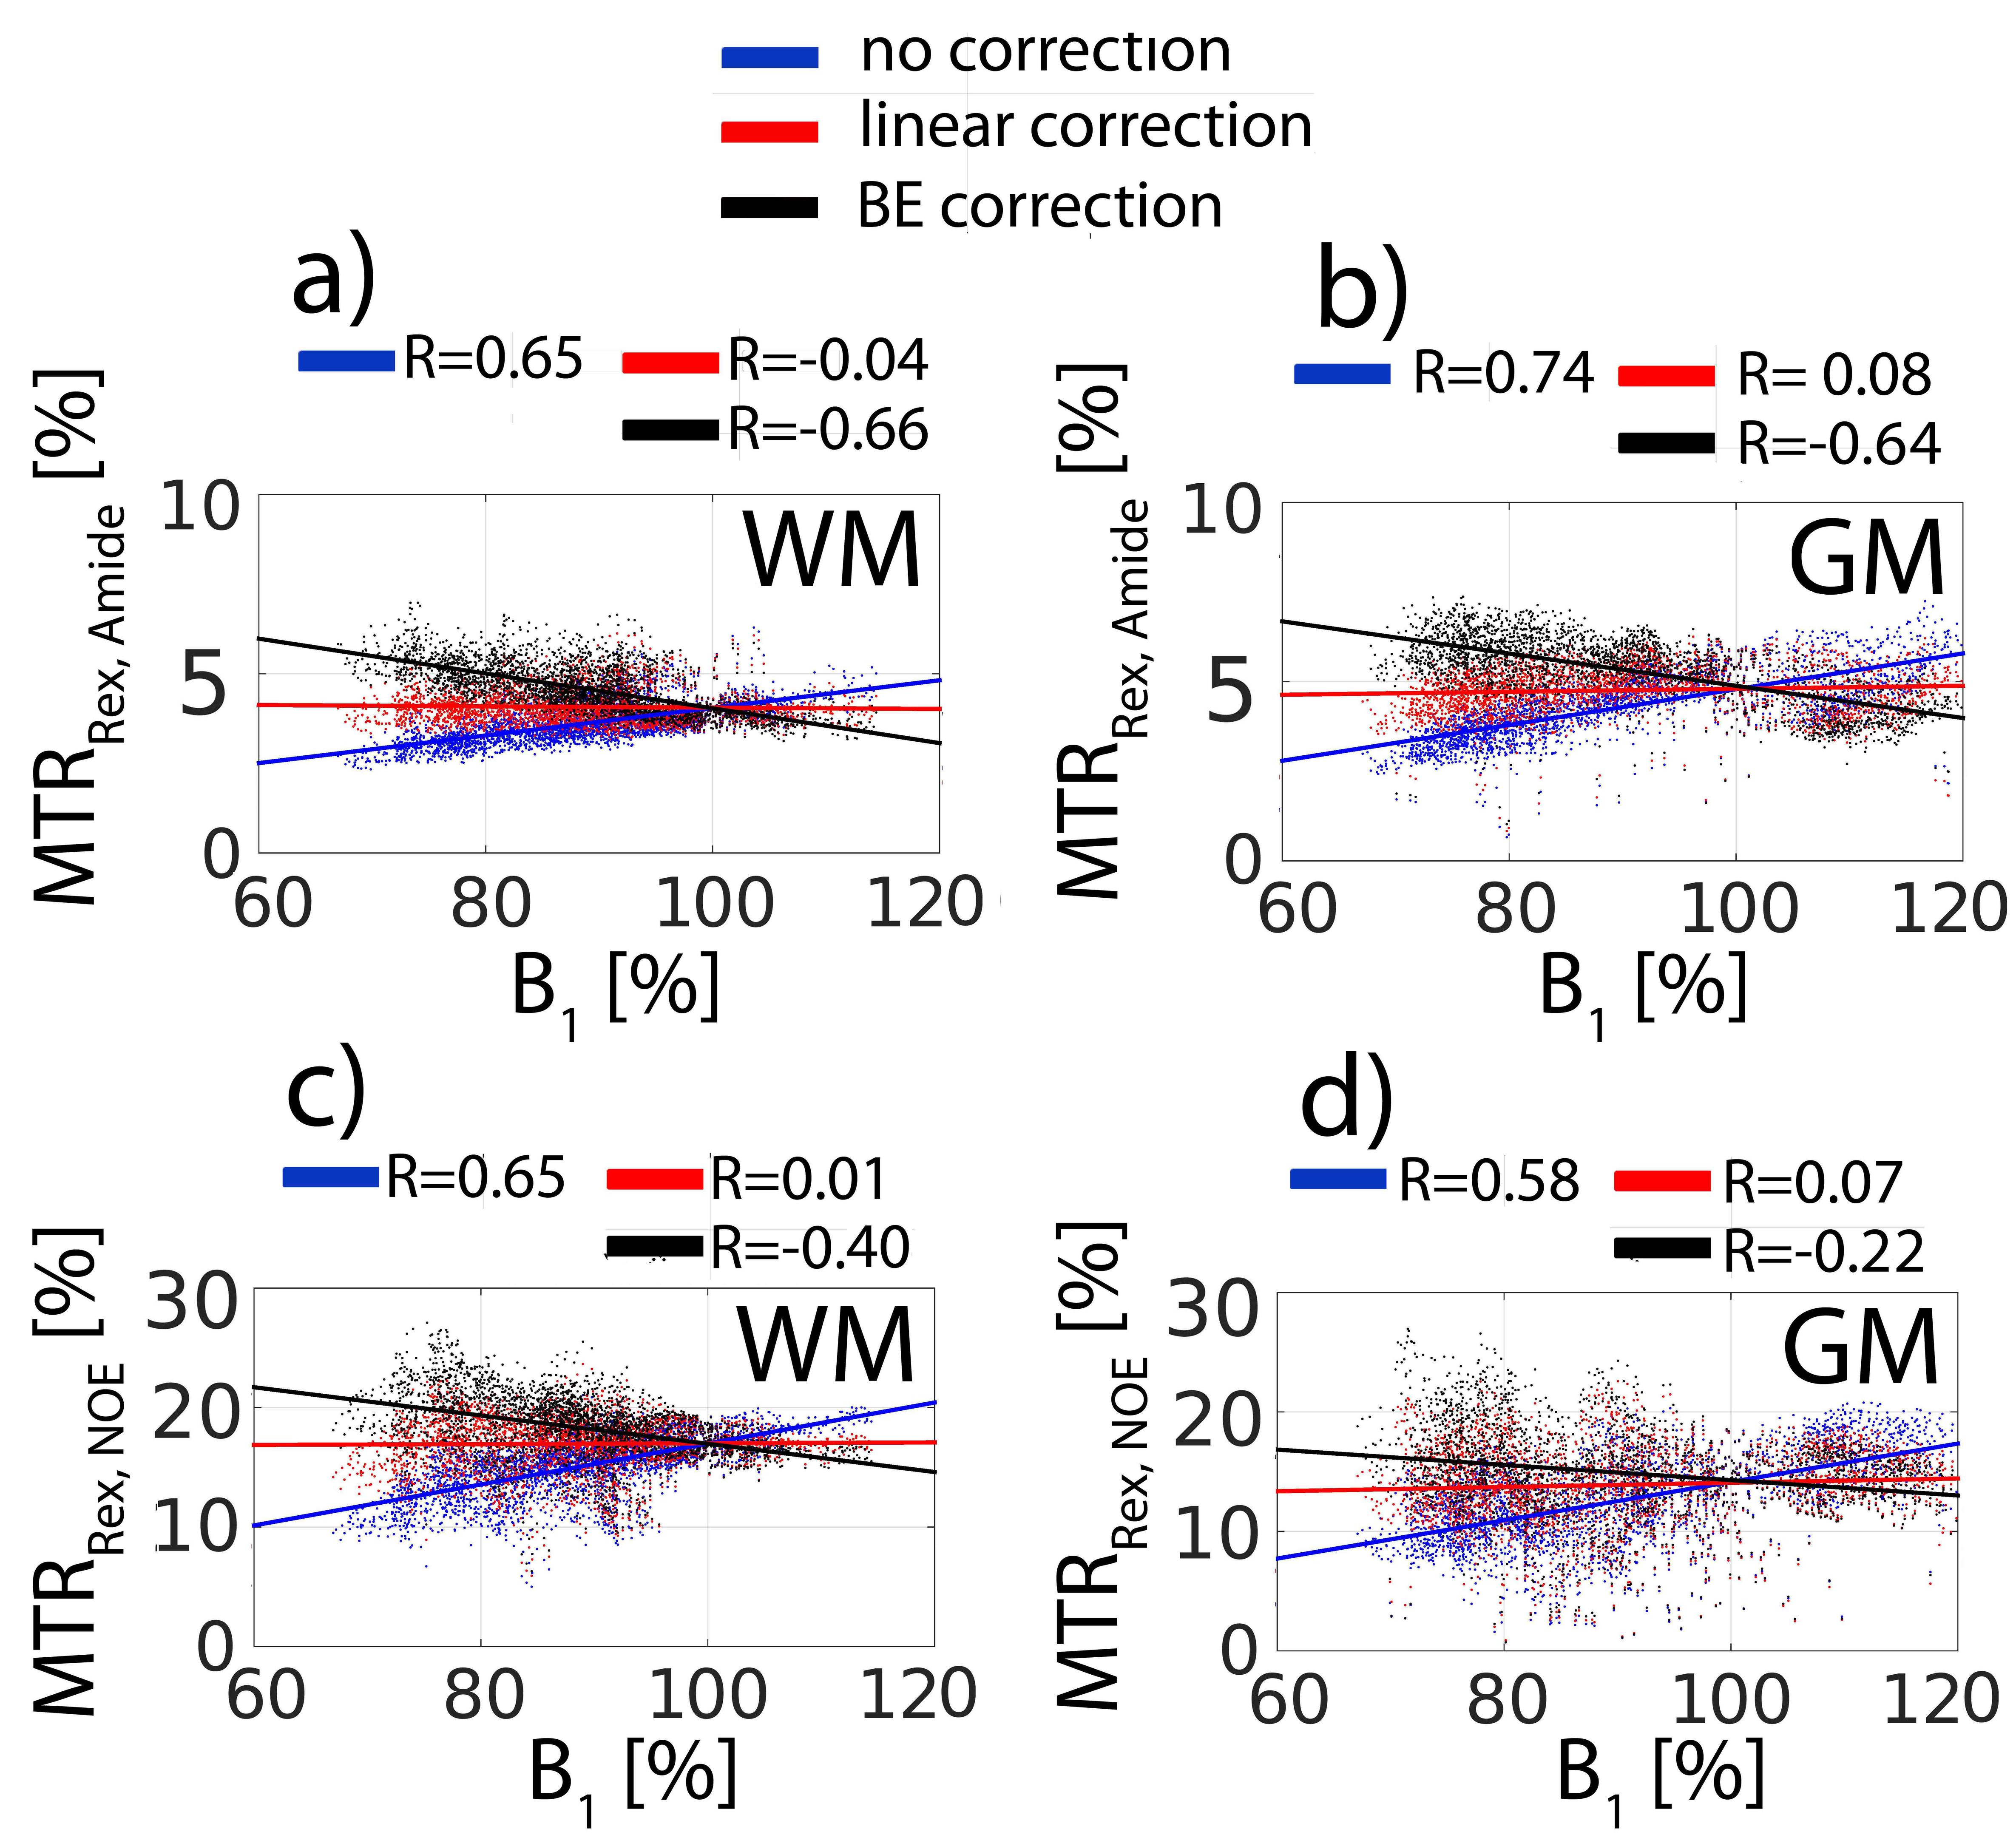
All three B1 correction algorithms were compared at a nominal B1 level of 0.43 µT, the actual B1 values (60 - 120% inhomogeneity) of which are in the linear regime (Fig. 2a). The linear relationship of both MTRRex,Amide and MTRRex,NOE metrics with B1 in the low B1 regime (0.1 – 0.5 µT) opens a possibility of a simple linear B1 correction. In Fig. 3, BE B1 correction was applied to the in vivo data. The CEST spectra were well fitted with BE (Fig. 3b). The overlap of BE B1 corrected spectra (Fig. 3c) suggests that BE may alleviate B1 inhomogeneity.The linear B1 correction improved image quality and the B1 corrected contrast (both MTRRex,Amide and MTRRex,NOE) resembles that of the interpolation B1 correction method (the reference method), whereas BE B1 correction resulted in over- and under correction at low and high B1, respectively (Fig. 4). In addition, the linear B1 correction method virtually nullified contrast correlation with B1, whereas BE B1 correction clearly over-compensated contrast at low B1 values (Fig. 5). The results of this work are also applicable to other methods used for the quantification of Amide and NOE CEST effects such as the three-point method [8] (data now shown) and multiple-Lorentzian fitting approach [1] (data not shown).Conclusions.
In the low B1 regime of 0.10 - 0.50 µT, a simple linear model is sufficient to mitigate B1 inhomogeneity of Amide-CEST and NOE effects at 7T.Acknowledgements
The financial support of the European Commission under FP7 Marie Curie Actions (FP7-PEOPLE-2012-ITN-316716) is gratefully acknowledged.References
[1] Windschuh J, Zaiss M, Meissner JEE, Paech D, Radbruch A, Ladd ME, Bachert P. Correction of B1-inhomogeneities for relaxation-compensated CEST imaging at 7T. NMR in biomedicine. 2015;28(5):529–537.
[2] Zu Z, Li K, Janve VA, Does MD, Gochberg DF. Optimizing pulsed-chemical exchange saturation transfer imaging sequences. Magn Reson Med. 2011;66(4):1100–1108.
[3] Schmitt B, Zaiß M, Zhou J, Bachert P. Optimization of pulse train presaturation for CEST imaging in clinical scanners. Magn. Reson. Med. 2011; 65: 1620–1629.
[4] Kim M, Gillen J, Landman BA, Zhou J, van Zijl PC. Water saturation shift referencing (WASSR) for chemical exchange saturation transfer (CEST) experiments. Magn Reson Med. 2009;61(6):1441–1450.
[5] Zaiss M, Xu J, Goerke S, Khan IS, Singer RJ, Gore JC, Gochberg DF, Bachert P. Inverse Z-spectrum analysis for spillover-, MT-, and T1-corrected steady-state pulsed CEST-MRI – application to pH-weighted MRI of acute stroke. NMR Biomed. 2014;27(3):240–252.
[6] Zaiss M, Windschuh J, Paech D et al. Relaxation-compensated CEST-MRI of the human brain at 7T: Unbiased insight into NOE and amide signal changes in human glioblastoma. NeuroImage. 2015;112:180–188.
[7] Zhang XY, Xie J, Xu J, Li H, Gore JC, Zu Z. Assessment of membrane fluidity using nuclear overhauser enhancement mediated magnetization transfer (NOE-mediated MT). ISMRM 2015, Toronto, Canada. 1747.
[8] Jin T, Wang P, Zong X, Kim SG. MR imaging of the amide-proton transfer effect and the pH-insensitive nuclear overhauser effect at 9.4 T. Magn Reson Med. 2013;69(3):760–770.
Figures