1970
Highly Accelerated Chemical Exchange Saturation Transfer (CEST) Imaging by Combining Parallel Imaging and Compressed Sensing at 3T1Bio-Imaging Research Team, Korea Basic Science Institute, Cheongju, Korea, Republic of, 2Bio-Analysis Science, University of Science and Technology, Daejeon, Korea, Republic of, 3University of Southern California, Los Angeles, CA, United States, 4Philips Healthcare Korea, Seoul, Korea, Republic of, 5Biomedical Engineering, Vanderbilt University, Nashville, TN, United States, 6Radiology and Radiological Sciences, Vanderbilt University, Nashville, United States, 7Opthamology, Vanderbilt University, Nashville, TN, United States
Synopsis
Chemical Exchange Saturation Transfer (CEST) imaging is an emerging molecular MRI method. It has been difficult for CEST imaging to adopt into clinical routine since CEST imaging is required relatively long scan time due to multiple saturation offsets. Here, we propose a novel, highly accelerated 3D CEST reconstruction technique by combining parallel imaging and compressed sensing.
Introduction
Chemical exchange saturation transfer (CEST) is a novel MRI contrast enhancement technique that allows indirect detection of metabolites with exchangeable protons. The CEST effects of amide protons (-NH) were first introduced1, and APT imaging has been widespread for a range of applications and differentiates the brain tumor regions from peritumoral edema and normal appearing white matter2. However, this CEST imaging technique including amide protons, amine protons (-NH2), and hydroxyl protons (-OH) has been relatively limited into clinical routine by long scan time due to the use multiple saturation offsets, even including performance of 3D imaging for increasing SNRs. In this work, we propose a novel, highly accelerated 3D CEST reconstruction technique by combining parallel imaging and compressed sensing and thus demonstrate the feasibility of this method (up to 4-fold).
Methods
The 4D CEST data sets were reconstructed by using the SparseSENSE signal model3,4 with varying RF saturate offset and applying three $$${\ell1}$$$-norm penalties. As a vector form, images (m) were reconstructed by minimizing the following unconstrained convex optimization problem5,6 below,
\begin{align*} x = argmin_m \|\tilde{F}_Ω\tilde{S}m - y\|_{\ell_2}^2 + λ_1\|Vm\|_{\ell_1} + λ_2\|Ψm\|_{\ell_1} + λ_3\|T_v m\|_{\ell_1} \end{align*}
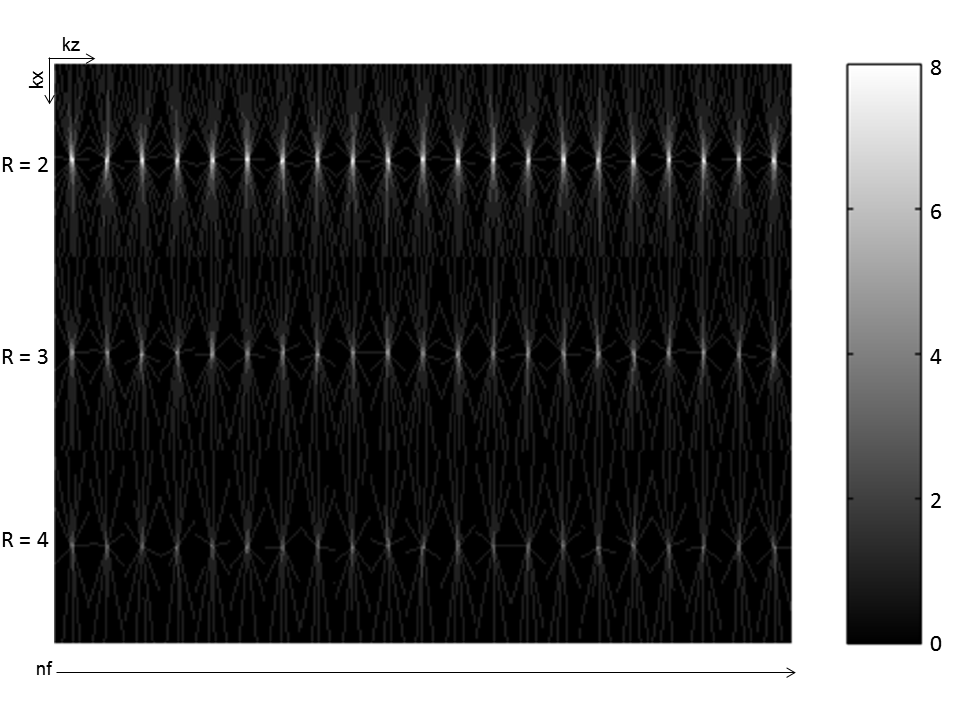
where $$$\tilde{F}_Ω = [\tilde{F_0}, \ldots, 0; 0, \dots, \tilde{F}_{n_f -1}] \in {C}^{n_f n_c n_v \times n_f n_c n_v}$$$ is the undersampled Fourier operator, $$$\tilde S = [\tilde S_0, \ldots, 0; 0, \ldots,\tilde S_{n_f-1}] \in {C}^{n_f n_c n_v \times n_f n_v}$$$ is the sensitivity matrix, $$$y = [y_0, \ldots, y_{n_f-1}]^T \in {C}^{n_f n_c n_k}$$$ is the acquired 4-D k-space data, V is a 1D spectral high-pass filter along the saturation frequency dimension and applied a symmetric window given by [0.06 0.44, 1, 0.44, 0.06], $$$\Psi$$$ is a 4-D wavelet transform, and $$$T_v$$$ is a 3-D spatial finite-differences transform. The regularization factors ($$$λ_{1, 2, 3}$$$) were set to $$$λ_1 = 6.5 \times 10^{-3}, λ_2 = 5.7 \times 10^{-3}$$$, and $$$λ_3 = 5.1 \times 10^{-3}$$$. The 3D sensitivity maps for each 3D image of a 4D CEST dataset were separately estimated from a fully sampled region in the center of 3D k-space using a 3D extension of the eigenvalue problem approach to sensitivity maps (calibration region: [13, 6, 4], kernel size: [7, 2, 2])7. An image vector $$$m_v \in {C}^{n_f n_v}$$$ of $$$n_v = nv_y \times nv_x \times nv_z (row \times column \times slice)$$$ voxels denotes a vector representation of a 3D discrete image acquired at the $$$v^{th}$$$ frequency offset. The CEST data were retrospectively undersampled by GOCART8 3D MRI with the acceleration factors (R = 2, 3, and 4) along the saturation offset direction. The study was performed on a healthy volunteer with a 8-channel receive head coil and acquired on a 3T. A fully sampled CEST imaging data was acquired with a 3D multi-shot turbo field echo (TFE)9,10 with TFE factor/echo time/flip angle(α) = 11/ 3.7 ms/ 10°, parallel imaging, a 1-3-3-1 binomial pulse for fat suppression, the offset frequency of irradiation from -5 to 5 at intervals of 0.5 ppm with a saturation power of 0.8 µT, and plus an unsaturation pulse for CEST normalization. The total scan time for acquiring whole-brain with 16 slices was 22 min. 27 s.
Results and Discussions
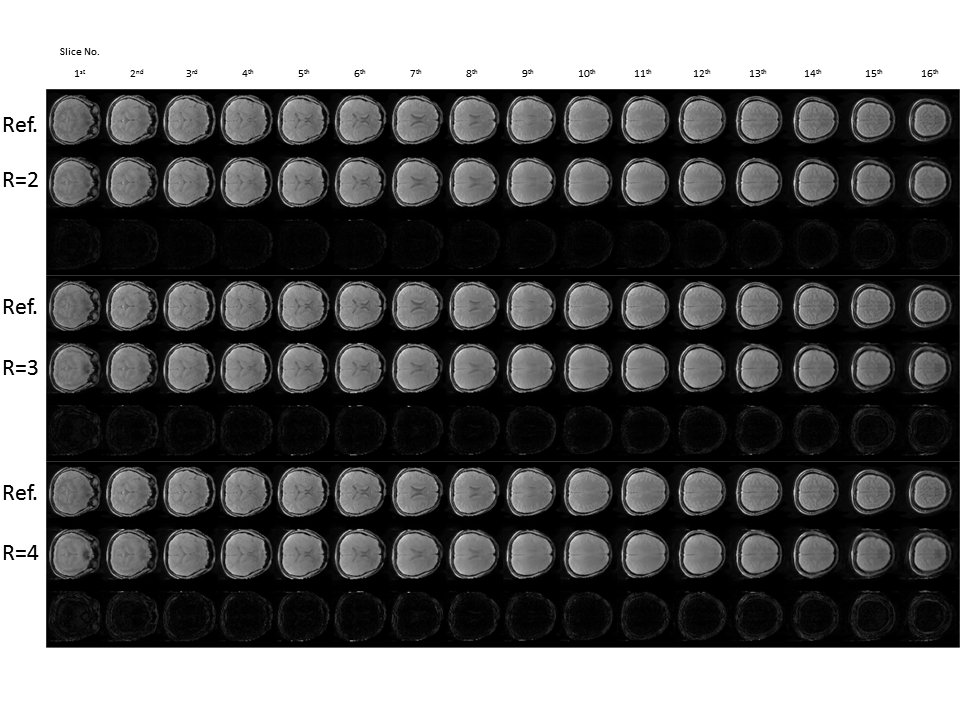
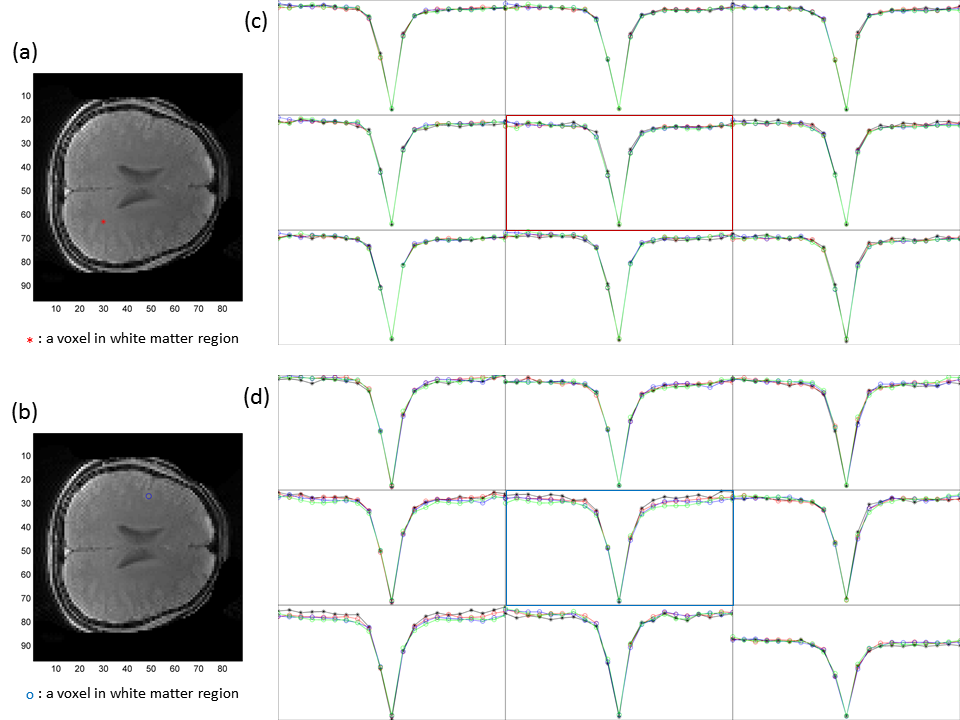
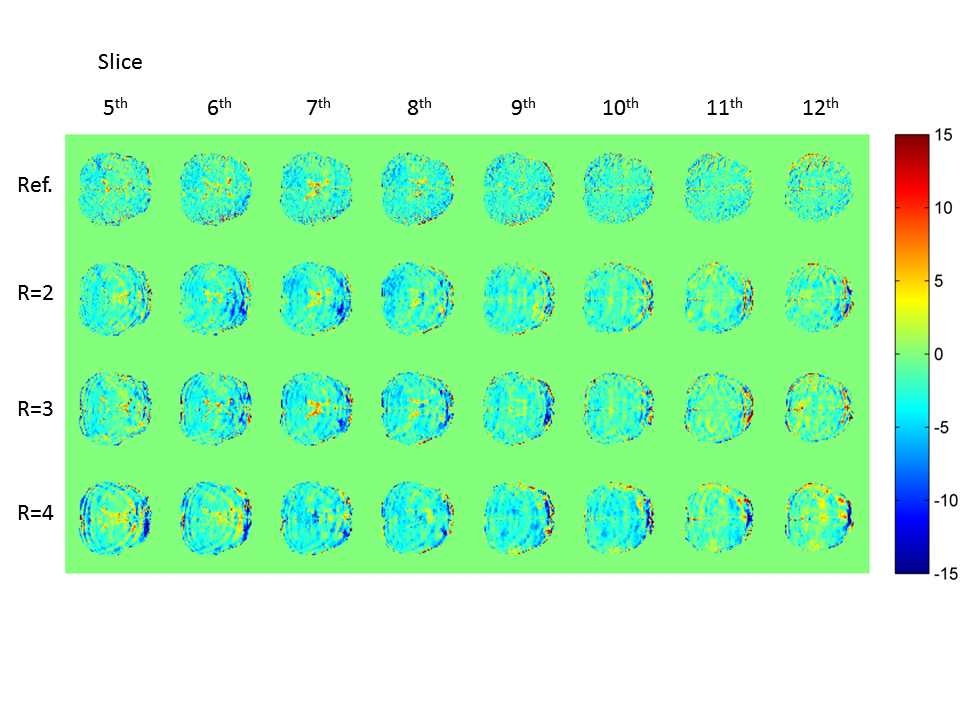
Figure 2 shows the difference images between a 3D full data set and reconstructed data sets in a normal control, retrospectively. As the acceleration rate increased, difference images (bottom row in each frame) show the substantial signal changes. Figure 3 clearly shows the z-spectra of randomly selected voxel on the normal appearing white and grey matter region, with different acceleration factors. The CEST spectrum was fitted using a 12th-order polynomial on a voxel-by-voxel basis to correct for field inhomogeneity effects. and APT weighted images are shown in figure 4.Conclusion
We proposed a novel, highly accelerated 4D CEST reconstruction technique by combining parallel imaging and compressed sensing. We evaluated the feasibility of accelerated CEST imaging on a healthy volunteer at 3T, retrospectively. Although the shape of z-spectrum and APT weighted images generated by reconstruced images with various acceleration factors are very similar to the fully sampled reference, proper regularization parameters would be needed to enhance the accuracy of z-spectra on multiple regions of brain.
Acknowledgements
This work was supported by KBSI research program (T36240).References
1. Jinyuan Zhou, Jean-Francois Payen, David A Wilson, Richard J Traystman, Peter C M van Zijl. Using the amide proton signals of intracellular proteins and peptides to detect pH effects in MRI. Nature Medicine 9, 1085–1090 (2003).
2. Jinyuan Zhou, Jaishri O. Blakeley, Jun Hua, Mina Kim, John Laterra, Martin G. Pomper, Peter C.M. van Zijl. Practical data acquisition method for human brain tumor amide proton transfer (APT) imaging. Magnetic Resonance in Medicine 60, 842–849 (2008).
3. Bo Liu, Yi Ming Zou, Leslie Ying. Sparsesense: Application of compressed sensing in parallel MRI. (2008)
4. King K. Combining compressed sensing and parallel imaging. In Proceedings 16th Annual Meeting of ISMRM, Toronto, Canada, (2008).
5. Robert Marc Lebel, Jesse Jones, Jean-Christophe Ferre, Meng Law, Krishna S. Nayak. Highly accelerated dynamic contrast enhanced imaging. Magnetic Resonance in Medicine 71, 635–644 (2013)
6. Michael Lustig, David Donoho, John M. Pauly. Sparse MRI: The application of compressed sensing for rapid MR imaging. Magnetic Resonance in Medicine 58, 1182–1195 (2007).
7. Martin Uecker, Peng Lai, Mark J. Murphy, Patrick Virtue, Michael Elad, John M. Pauly, Shreyas S. Vasanawala, Michael Lustig. ESPIRiT-an eigenvalue approach to autocalibrating parallel MRI: Where SENSE meets GRAPPA. Magnetic Resonance in Medicine 71, 990–1001 (2013).
8. Yinghua Zhu, Yi Guo, Sajan Goud Lingala, R. Marc Lebel, Meng Law, Krishna S. Nayak. GOCART: GOlden-angle CArtesian randomized time-resolved 3D MRI. Magnetic Resonance Imaging 34, 940–950 (2016).
9. Anna Tietze, Jakob Blicher, Irene Klaerke Mikkelsen, Leif , Megan K. Strother, Seth A. Smith, Manus J. Donahue. Assessment of ischemic penumbra in patients with hyperacute stroke using amide proton transfer (APT) chemical exchange saturation transfer (CEST) MRI. NMR in Biomedicine 27, 163–174 (2013)
10. Adrienne N. Dula, Lori R. Arlinghaus, Richard D. Dortch, Blake E. Dewey, Jennifer G. Whisenant, Gregory D. Ayers, Thomas E. Yankeelov, Seth A. Smith. Amide proton transfer imaging of the breast at 3 T: Establishing reproducibility and possible feasibility assessing chemotherapy response. Magnetic Resonance in Medicine 70, 216–224 (2012)
Figures