1969
A singular value decomposition approach to quantitative magnetization transfer1NMR Unit, Max Planck Institute for Human Cognitive and Brain Sciences, Leipzig, Germany, 2FMRIB Centre, Nuffield Department of Clinical Neurosciences, University of Oxford, Oxford, United Kingdom
Synopsis
Quantitative magnetization transfer experiments require extensive sampling of the off-resonance spectrum to obtain information of the relaxation properties of non-water protons. To reduce the acquisition times, the off-resonance sampling has been optimized in previous works based on the stability of approximate biophysical model fits. Here, we use a singular value decomposition approach for the analysis of the principal components. In particular we propose a data-driven optimization method for the acquisition scheme and we discuss the potential impact of applying this analysis for parameter estimations, including potential extensions of the classical biophysical models.
Purpose
Quantitative Magnetization Transfer (MT) is an MRI technique for investigating relaxation and exchange properties of multiple spin pools simultaneously. The typical experiment consist of a series of off-resonance saturation pulses with varying amplitude and frequency offsets (the z-spectrum) followed by standard imaging acquisitions. The resulting acquisition can be very long, and some research went into optimization techniques1. The quantitative information is usually obtained by fitting approximate biophysical models of the signals2,3,4. These models consider a certain number of spin pools and their mutual interactions. However, the number of modeling parameters increases exponentially with the number of pools and thus limiting the efficacy of direct fits with more accurate models. On the other hand, some of the parameters may not be relevant for imaging as their variance over the image might be too low and hence below noise levels. Here, we use singular value decomposition (SVD) to define an optimal z-spectrum sampling for reducing the acquisition.Methods
We acquired images of a post-mortem full human brain using a Siemens MAGNETOM 7T MRI scanner, a circularly polarized Tx / 32-Channel Rx head coil, and modified FLASH sequence ($$$T_R=70\;\mathrm{ms}$$$, $$$T_E=7.88\;\mathrm{ms}$$$, $$$\alpha=30\mathrm{°}$$$, resolution: $$$1\;\mathrm{mm}$$$ isotropic) with a saturation pulse before the acquisition of each k-space line. The saturation pulse was tuned logarithmically in the frequency offset range $$$100\mathrm{-}100000\mathrm{Hz}$$$ with varying power level corresponding to nominal on-resonance flip angles of $$$200°,\,300°,\,400°,\,500°,\,800°,\,1100°$$$, with an additional acquisition without saturation pulse.
The aforementioned simulations were performed using a binary spin bath model and matrix-algebra-based solutions of the Bloch equations5, and typical values for post-mortem white matter.
To investigate a data-driven optimal sequence for magnetization transfer mapping we iteratively found the best (i.e. introducing the largest variance) z-spectrum point to include to a given MT dataset.
Specifically, we proceeded to:
- construct a matrix M using as columns the data reshaped (due to memory limits only a single central slice was used) corresponding to different z-spectrum points;
- start with only one column containing data without the saturation pulse;
- look for the optimal marginally larger z-spectrum sub-sampling by adding a single z-spectrum point to the matrix and perform an SVD to obtain the principal linear components; the data point adding the largest eigenvalue (normalized) is the one with more variance with the original dataset;
- once the marginally optimal acquisition is included in the matrix, repeat the procedure until all data is included.
To obtain the desired reduced dataset, a threshold value on the marginal variance can be chosen, for example, from signal-to-noise ratio considerations.
Results
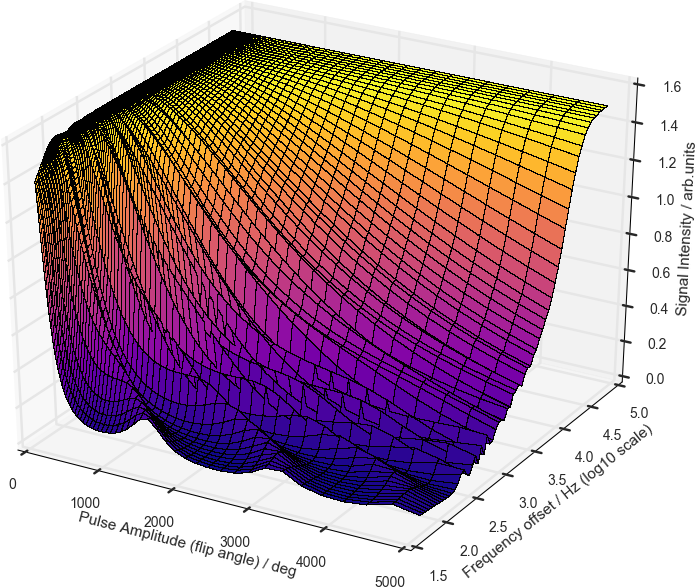
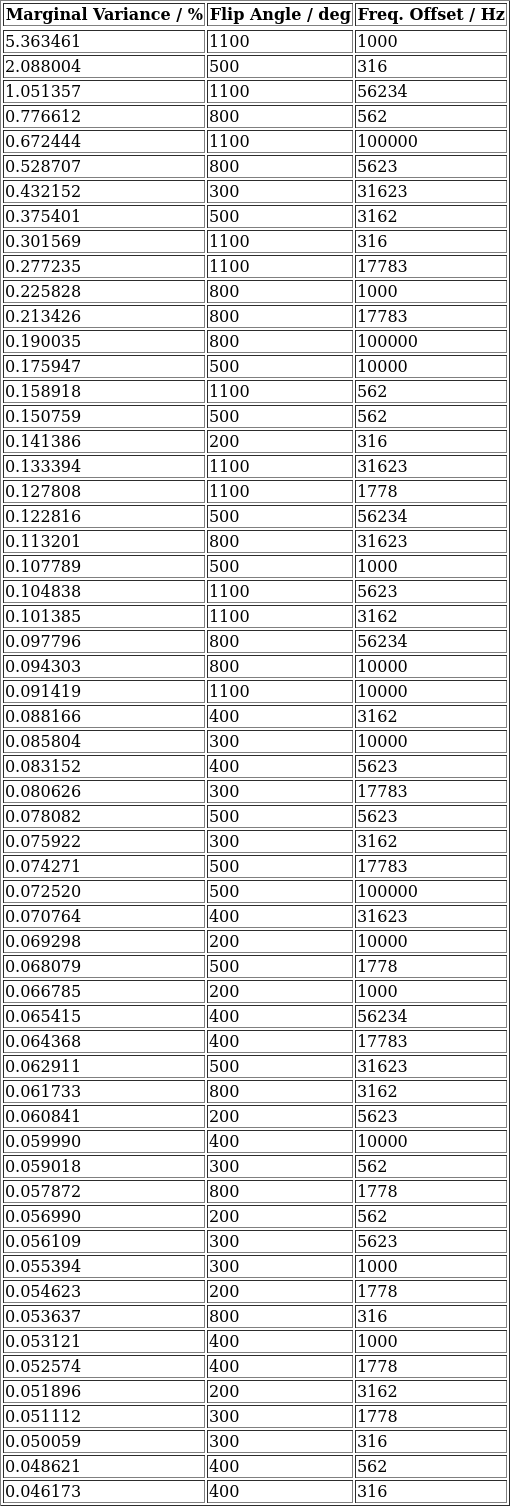
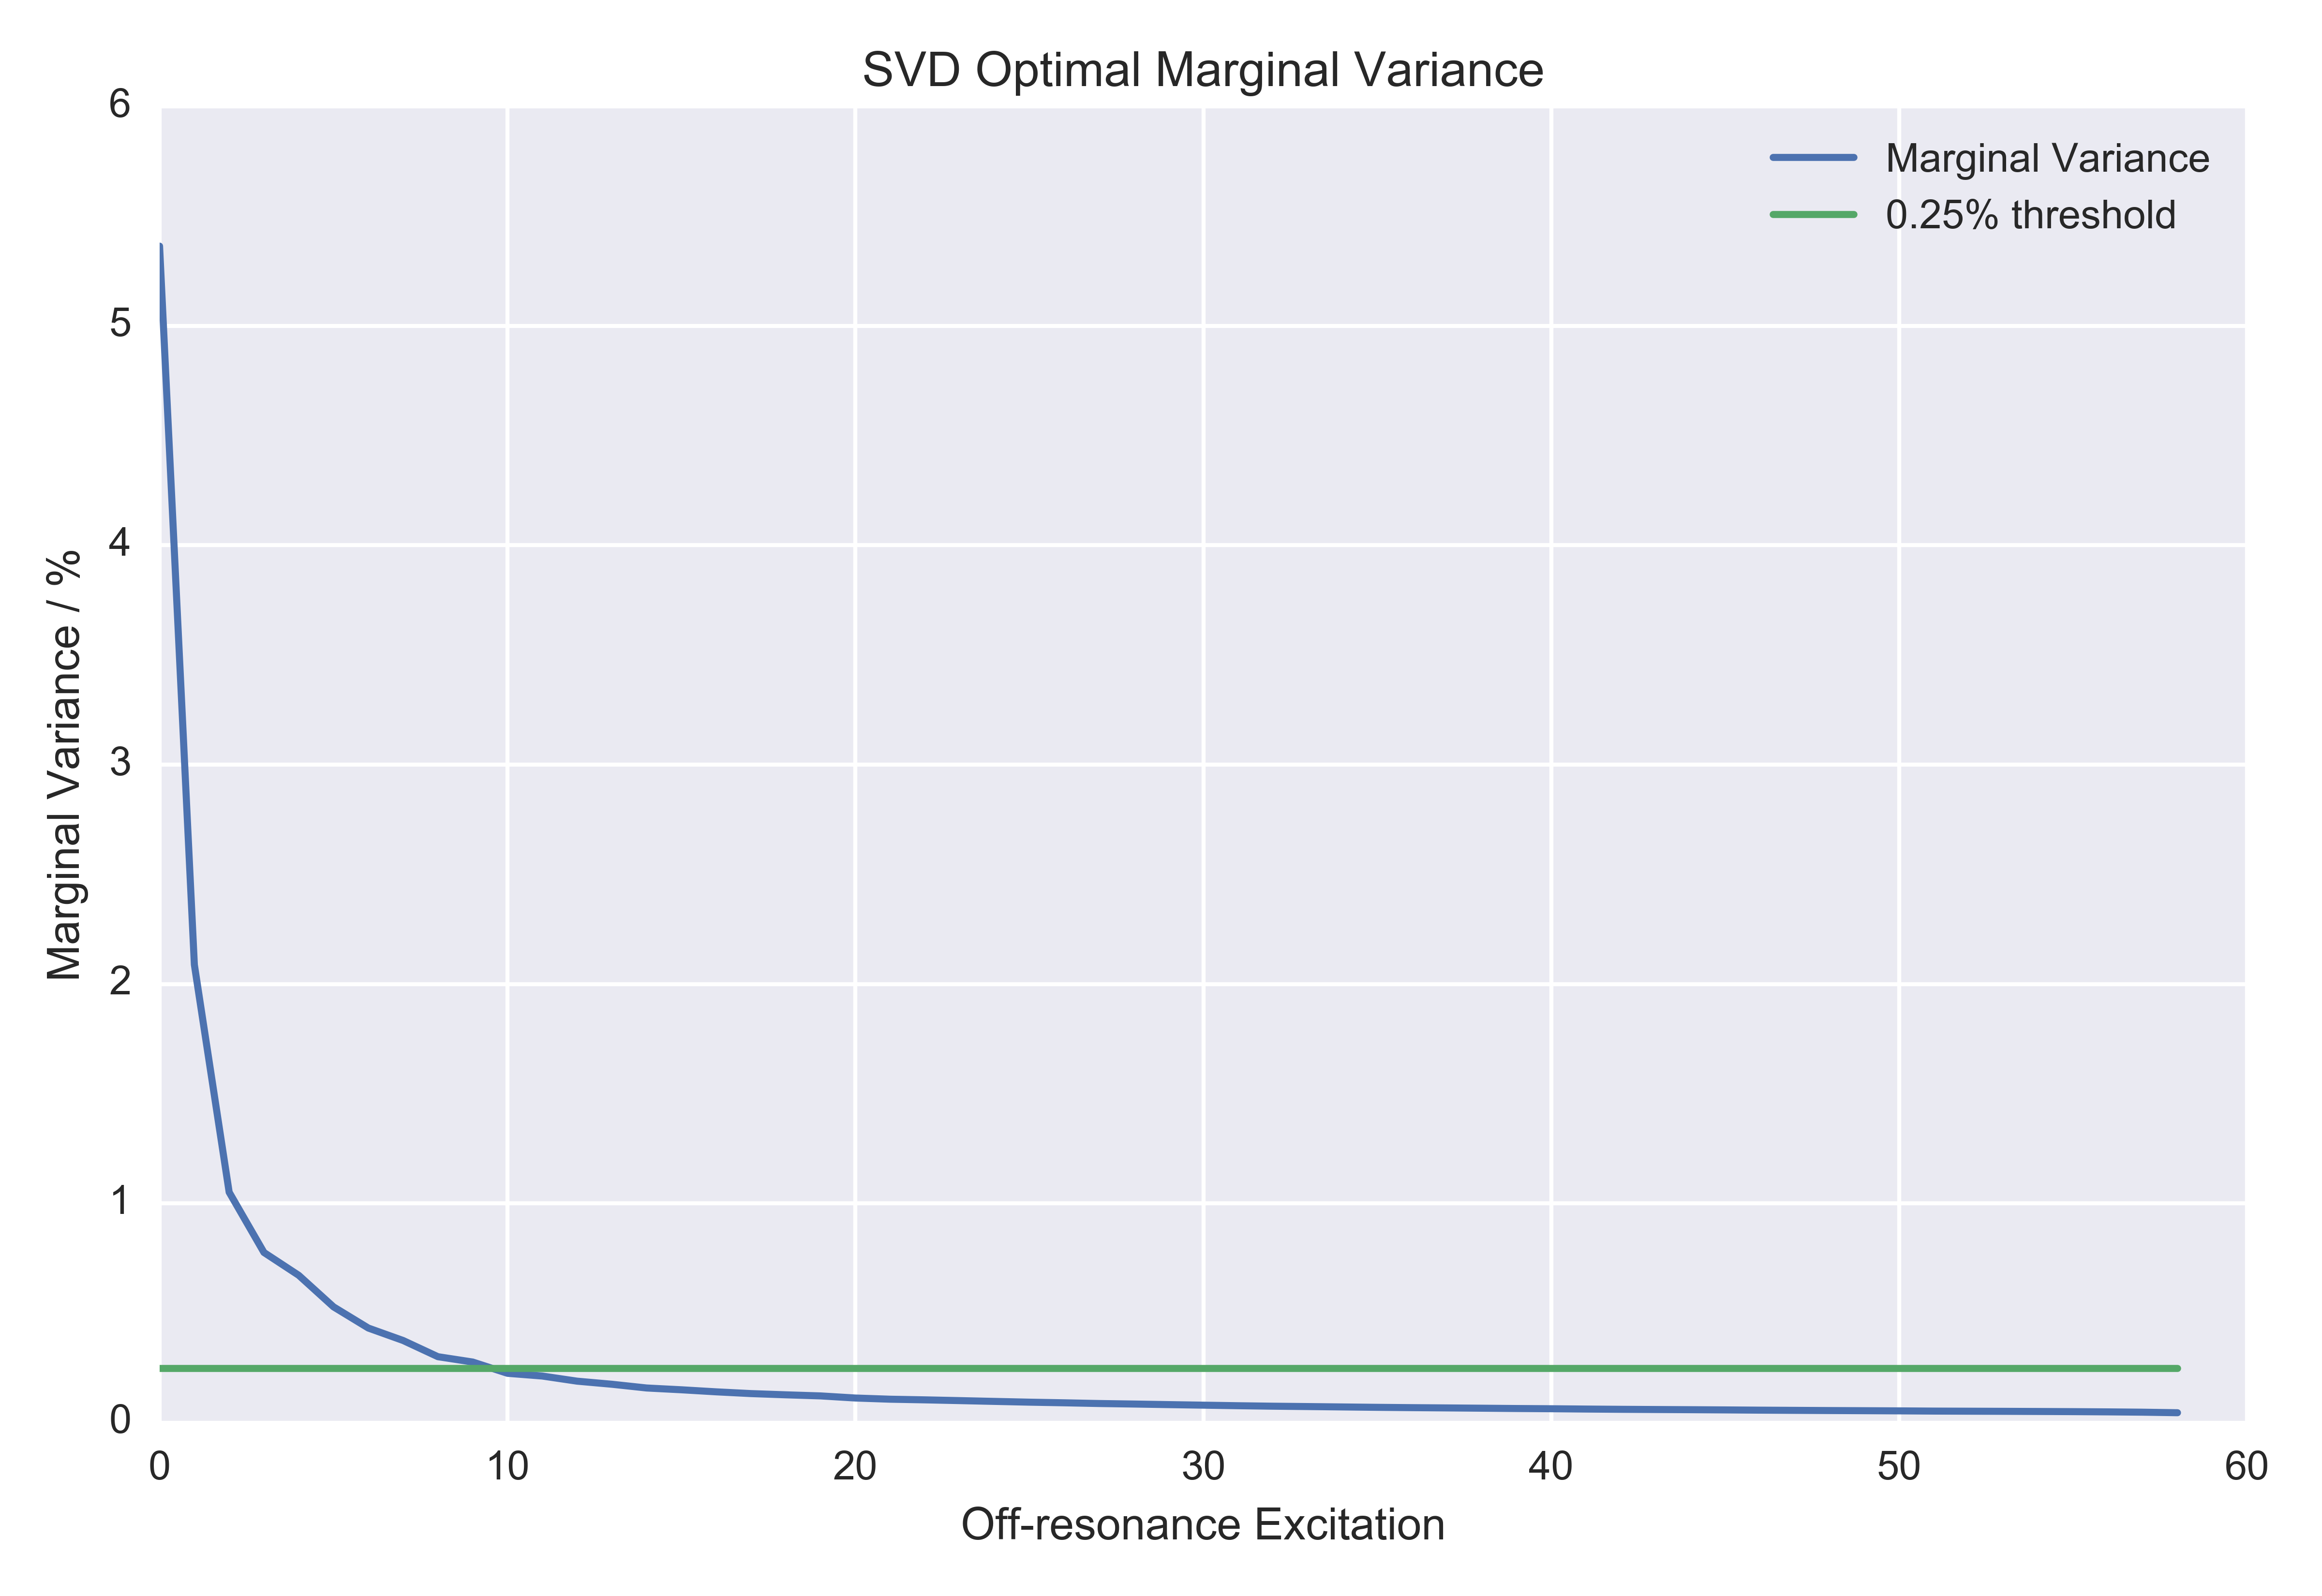
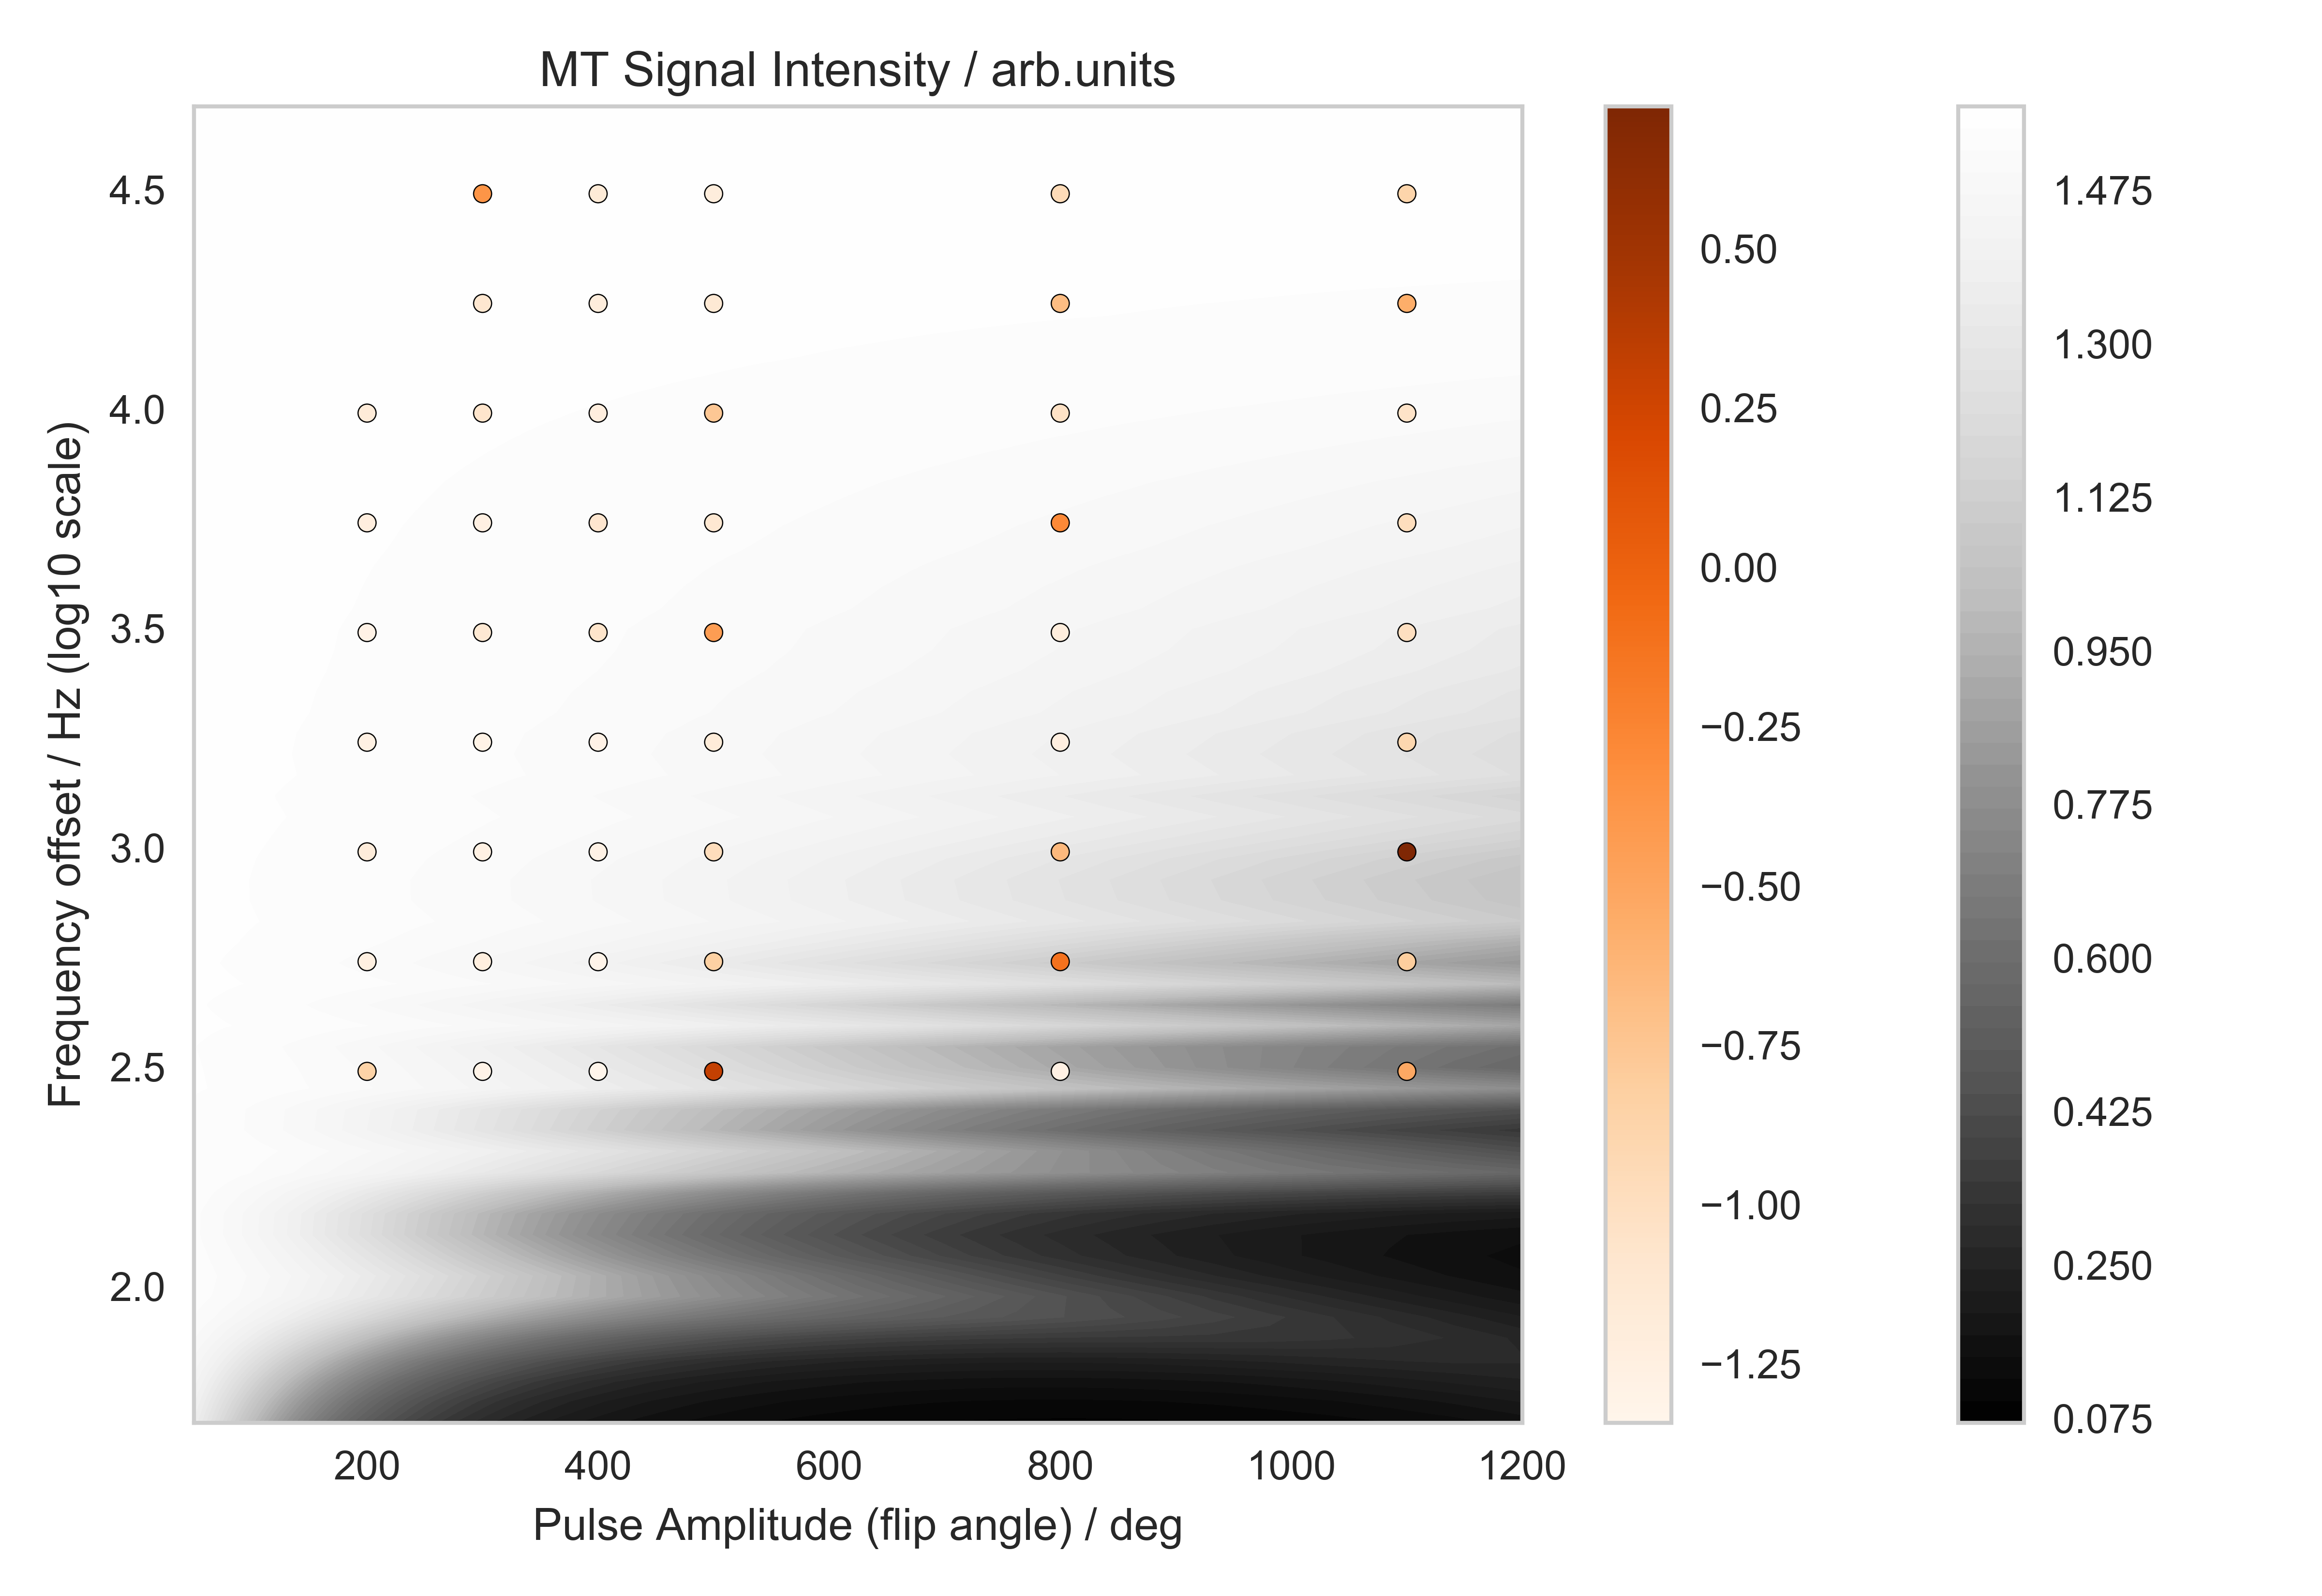
A reasonably expected signal behavior obtained from the Bloch simulations is reported in Fig.[1]. The measured z-spectrum is reported in Fig.[2] along with the obtained optimal off-resonance marginal variance results, additionally plotted in Fig.[3],[4]. Note that the percentage of explained variance is monotonically decreasing and the optimal data points correspond to the larger z-spectrum variations observed in the simulations.Discussion
The list in Fig.[2],[3],[4] can be used directly to progressively measure (depending on acquisition time) the most relevant z-spectrum points.
The SVD technique performs well for principal component analysis under the assumption of linearity, which may not be satisfied for all components. Other analyses, for example those based on different statistical metrics, may yield different - and possibly more accurate - results. Additionally, the choice of the most relevant z-spectrum points may prove valuable for obtaining MT fits using biophysical models with comparable quality as when more data points are acquired. This was postponed in this work due to the relatively long computation times of these fits. The SVD analysis can also be used to make predictions on the number of components that can be extracted using biophysical models. For example, it is possible to use Otsu's method6 to define a variance-optimum threshold for signal/noise separation, and use that for thresholding the largest eigenvalues.
Finally, in the presence of a linear formulation of the biophysical model, i.e. $$$S = YX$$$, where $$$S$$$ is the measured data, $$$Y$$$ is the matrix of unknown parameters and $$$X$$$ is the biophysical model matrix, the SVD approach can reduce the fitting procedure to the determination of a rotation matrix $$$T$$$ mapping the (reduced) right-singular matrix $$$\tilde{V}^\dagger$$$ into the model $$$X$$$:$$S=U\Sigma{}V^\dagger\approx{}\tilde{U}\tilde{\Sigma}\tilde{V}^\dagger=\tilde{U}\tilde{\Sigma}T^{-1}T\tilde{V}^\dagger$$with $$$Y=\tilde{U}\tilde{\Sigma}T^{-1}$$$ and $$$X=T\tilde{V}^\dagger$$$ and the $$$\tilde{\phantom{x}}$$$ symbol indicate the truncated SVD matrices (largest eigenvalues and corresponding eigenvectors) matching the biophysical model considered.
Conclusion
We obtained an optimally sorted list of off-resonance excitation in a linear principal component analysis sense. Future work will investigate the relationship between the independent components analysis and the classical biophysical models used in qMT.Acknowledgements
We would like to thank the following people: Henrik Marschner, Tobias Lenich, Feng Qi, Sean Foxley for helpful discussions and support. Funded by: EU through the 'HiMR' Marie Curie ITN (FP7-PEOPLE-2012-ITN-316716), the Max Planck Society through IMPRS NeuroCom, and the Helmholtz Alliance 'ICEMED'.References
1. Cercignani, M., Alexander, D.C., 2006. Optimal acquisition schemes for in vivo quantitative magnetization transfer MRI. Magn. Reson. Med. 56, 803–810. doi:10.1002/mrm.21003
2. Henkelman, R.M., Huang, X., Xiang, Q.-S., Stanisz, G.J., Swanson, S.D., Bronskill, M.J., 1993. Quantitative interpretation of magnetization transfer. Magn. Reson. Med. 29, 759–766. doi:10.1002/mrm.1910290607
3. Sled, J.G., Pike, G.B., 2000. Quantitative Interpretation of Magnetization Transfer in Spoiled Gradient Echo MRI Sequences. Journal of Magnetic Resonance 145, 24–36. doi:10.1006/jmre.2000.2059
4. Barta, R., Kalantari, S., Laule, C., Vavasour, I.M., MacKay, A.L., Michal, C.A., 2015. Modeling T1 and T2 relaxation in bovine white matter. Journal of Magnetic Resonance 259, 56–67. doi:10.1016/j.jmr.2015.08.001
5. Müller, D.K., Pampel, A., Möller, H.E., 2013. Matrix-algebra-based calculations of the time evolution of the binary spin-bath model for magnetization transfer. Journal of Magnetic Resonance 230, 88–97. doi:10.1016/j.jmr.2013.01.013
6. Otsu, N., 1979. A Threshold Selection Method from Gray-Level Histograms. IEEE Transactions on Systems, Man, and Cybernetics 9, 62–66. doi:10.1109/TSMC.1979.4310076
Figures