1968
Functional and structural ex vivo “MRI staining” using manganese-enhanced MRI (MEMRI), Gd-DTPA and Mn-Gd mixture1Molecular Imaging and Theranostics, National Institute of Radiological Sciences, QST, Chiba, Japan, 2Department of Nutrition, Faculty of Medical and Health Sciences, Tsukuba International University, 3Anatomy and Neuroscience, The University of Melbourne, 4The Florey Institute of Neuroscience and Mental health
Synopsis
To reveal brain 3D microstructures noninvasively and microscopically using MRI, we developed “ex vivo MEMRI” and Mn-Gd double-contrast methods, and then compared them with conventional ex vivo Gd-DTPA-doped contrast. Because MEMRI sample loses contrast after perfusion fixation, we examined the stability of Mn2+ accumulation in ex vivo tissue samples. In addition, we tried to improve the contrast of MEMRI in combination with Gd-DTPA. The Mn-Gd double-contrast showed novel contrast and improved visibility. The functional “MRI staining” methods we developed in this study will be useful for visualizing whole brain 3D microstructures with a higher throughput compared to histological staining.
Introduction
Manganese-enhanced magnetic resonance imaging (MEMRI) has been reported to be in vivo functional and structural imaging methods allowing the depolarization-dependent functional imaging, neural tract tracing and anatomical imaging in vivo [1-5]. MEMRI contrast depends on Mn2+ transportation through Ca2+ channels [6] in living animals. Thus, MEMRI does not provide specific contrast in dead subjects. Although in vivo imaging has the advantage of functional and kinetic detection, it is difficult to obtain high-resolution 3D images due to involuntary movement in subjects, respiratory and cardiac motion, and limited scanning time. Recently, to achieve 3D micro-imaging, an ex vivo MRI with a long scanning time is also an option [7-9]. We tested two novel ex vivo approaches based on MEMRI. First, for ex vivo high-resolution 3D scanning using MEMRI, we examined the stability of Mn2+ accumulation in ex vivo samples. Second, we tried to improve the contrast of MEMRI in combination with Gd-DTPA. The Mn-Gd double-contrast agents may induce novel contrast through a different distribution and the interaction of the relaxivities between Mn2+ and Gd3+. Therefore, to reveal brain 3D microstructures noninvasively and microscopically using MRI, we developed “ex vivo MEMRI” and Mn-Gd double-contrast methods, and compared them with ex vivo Gd-DTPA-doped contrast.Methods
Six mice (C57BL/6, male, 8-10weeks) were used in this study. First, 50mM MnCl2 (100mg/kg B.W., 250μl/h) was infused intravenously via the tail vein. The in vivo MEMRI was obtained using a 7-tesla MRI with a cooled RF coil 24h after manganese administration. Mice received perfusion fixation by PFA and were divided into 2 groups: one for ex vivo MEMRI (n=3) and one for Mn-Gd double-contrast agents, which received soaking in 0.2mM Gd-DTPA (n=2, Mn-Gd double-contrast) after fixation. One mouse without MnCl2 administration also received fixation followed by soaking in 2mM Gd-DTPA (n=1, Gd-DTPA). To remove signal contamination from the surrounding solution, the samples were immersed into a fluorine compound. The ex vivo images were also obtained using the same 7T-MRI as for the in vivo study.
MRI parameters
An in vivo T1-weighted 3D image was obtained using the RARE sequence: TR/TE=400/8.65ms, RARE factor=2, FOV=12.5x8x15mm3, matrix=160x108x100, voxel size=0.075x0.075x0.15, and NEX=1. An ex vivo T1-weighted 3D image was obtained using the FLASH sequence: TR/TE=200/9ms, FOV=7.5x10x7.5mm3, matrix=300x400x300, voxel size=0.025x0.025x0.025, and NEX=2. T1/T2 map: TR=200, 400, 800, 1500, 3000, 5000ms, TE=11, 33, 55, 77, 99ms, FOV=19.2x19.2mm2, and acquisition matrix=256x256.
Results and Discussions
First, to examine the effects of perfusion fixation for manganese-enhanced tissue samples, we tested the alteration and optimized the MEMRI method for ex vivo samples. The signal intensity and contrast in ex vivo MEMRI were attenuated after perfusion fixation (Fig. 1). Moreover, 1 week after perfusion, the signal intensity and contrast in ex vivo MEMRI, especially in the cortex was attenuated (Fig. 2C and D), suggesting a diffusion of the accumulated Mn into the medium after fixation. However, the contrast in hippocampal cell layers improved (Fig. 2E and 2F). Although details of the tissue-specific contrast mechanism are unknown, the hippocampal cell layers may have a tight conjugation with Mn. These results suggest that Mn2+ is actively accumulated in the brain tissue and retained within specific structures in vivo. Although the extracted manganese-enhanced tissue gradually lost contrast over time, most of the contrast was maintained immediately after fixation and some specific cell layers were maintained 7days after fixation.
Second, we combined the Gd-DTPA contrast agent with the ex vivo MEMRI method, and showed interesting novel contrast (Fig. 3). In the cortex, we observed positive enhancement of layer structures both in MEMRI and Gd-DTPA with a different contrast distribution, respectively. However, the Mn-Gd lost contrast in the cortex, which suggested leakage of Mn2+ and/or the compensation of the layer distribution between Mn and Gd. Interestingly, the CA3 pyramidal cell layer showed layer-specific negative contrast in Mn-Gd samples (Fig. 3I), although Gd-DTPA showed strong negative contrast with a susceptibility effect (Fig. 3H). We could observe not only large bundles but also small fibers of the thalamus in Mn-Gd that had negative contrast similar to ex vivo MEMRI (Fig. 3A-C, J-L).
Conclusions
The ex vivo “MRI staining” methods presented in this study will be useful to visualize whole brain 3D microstructures with a higher throughput than histological staining. The “MRI staining” method may use not only microstructures but also depolarization-dependent functional imaging and tract tracing. The Mn-Gd double-contrast method allowed new contrast for ex vivo MRI observation, although additional studies are necessary to explain the contrast mechanism. Our results support cellular mapping using MRI, which is an approach we call “MRI staining”.Acknowledgements
This research is partially supported by the program for Brain Mapping by Integrated Neurotechnologies for Disease Studies (Brain/MINDS) from Japan Agency for Medical Research and development, AMED, and by JSPS KAKENHI Grant Number 24300167.References
1. Silva, A.C. and N.A. Bock, Manganese-enhanced MRI: an exceptional tool in translational neuroimaging. Schizophr Bull, 2008. 34(4): p. 595-604.
2. Pautler, R.G., A.C. Silva, and A.P. Koretsky, In vivo neuronal tract tracing using manganese-enhanced magnetic resonance imaging. Magn Reson Med, 1998. 40(5): p. 740-8.
3. Aoki, I., et al., In vivo detection of neuroarchitecture in the rodent brain using manganese-enhanced MRI. Neuroimage, 2004. 22(3): p. 1046-59.
4. Massaad, C.A. and R.G. Pautler, Manganese-enhanced magnetic resonance imaging (MEMRI). Methods Mol Biol, 2011. 711: p. 145-74.
5. Chan, K.C., et al., In vivo visuotopic brain mapping with manganese-enhanced MRI and resting-state functional connectivity MRI. Neuroimage, 2014. 90: p. 235-45.
6. Lin, Y.J. and A.P. Koretsky, Manganese ion enhances T1-weighted MRI during brain activation: an approach to direct imaging of brain function. Magn Reson Med, 1997. 38(3): p. 378-88.
7. Song, S.K., et al., Demyelination increases radial diffusivity in corpus callosum of mouse brain. Neuroimage, 2005. 26(1): p. 132-40.
8. Thiessen, J.D., et al., Quantitative MRI and ultrastructural examination of the cuprizone mouse model of demyelination. NMR Biomed, 2013. 26(11): p. 1562-81.
9. Zhang, J., et al., In vivo and ex vivo diffusion tensor imaging of cuprizone-induced demyelination in the mouse corpus callosum. Magn Reson Med, 2012. 67(3): p. 750-9.
Figures
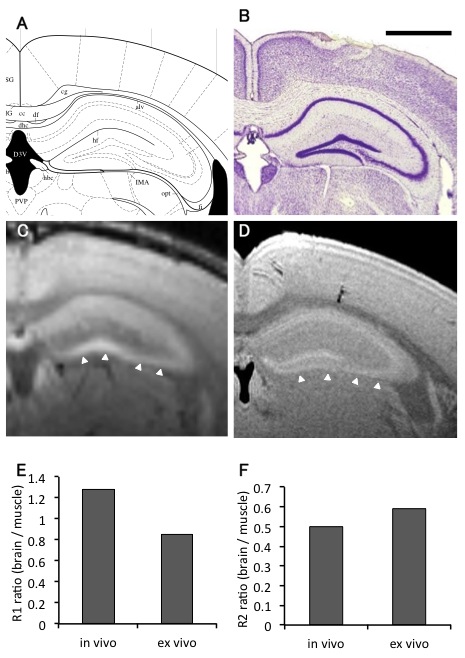
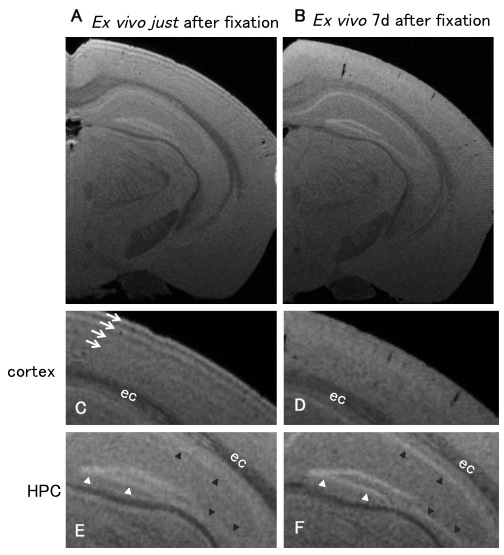
Figure 2. Contrast alteration of ex vivo MEMRI after fixation.
We observed differences in ex vivo manganese-enhanced samples immediately (A, C, and E) and 7 days (B, D, and F) after perfusion fixation. Magnified images in the cortex (C and D), and hippocampus (HPC) (E and F) are shown. White arrows in C indicate tangential signal rows observable on the superficial layer of the cortex. White arrowheads in E and F show the granular layer of the dentate gyrus, and black arrowheads show the pyramidal cell layer of the Ammon's horn. ec; external capsule.
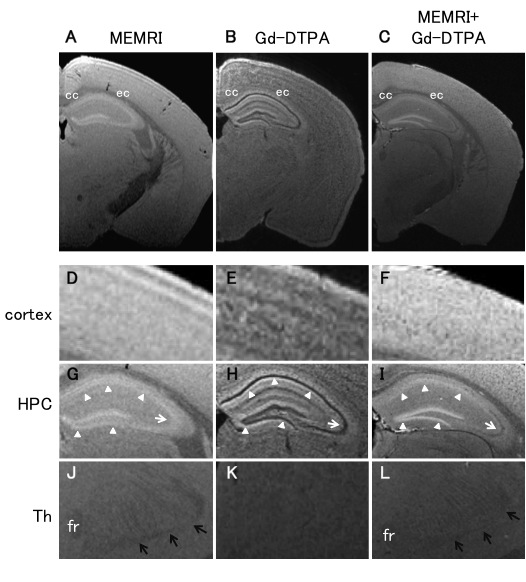
Figure 3. Contrast differences among ex vivo MEMRI, Gd-DTPA, and Mn-Gd double-contrast.
In the cortex(D-F), we observed different contrast distributions among MEMRI, Gd-DTPA and those two combinations. The Mn-Gd lost the contrast while sustaining positive contrasts in the hippocampus and negative in subcortical white matter. In the CA3 pyramidal cell layer(G-I, white-arrow), MEMRI showed positive enhancement, Mn-Gd showed moderate negative contrast, and Gd-DTPA showed strong negative contrast. White arrowheads(G-I) show the hippocampal cell layers. The medial lemniscus was visible as strongly-negative contrast in both MEMRI and Mn-Gd(black-arrows), but not with the Gd-DTPA(K). cc;corpus callosum, ec;external capsule, HPC;hippocampus, Th;thalamus, fr;fasciculus retroflexus.