1965
Assessment of melanin content and its influence on susceptibility contrast in melanoma metastases1Department of Medical Physics in Radiology, German Cancer Research Center (DKFZ), Heidelberg, Germany, 2Institute of Radiology, University Hospital Erlangen, Erlangen, Germany, 3Department of Radiology, German Cancer Research Center (DKFZ), Heidelberg, Germany, 4Department of Neuropathology, Institute of Pathology, University of Heidelberg, Heidelberg, Germany, 5German Cancer Consortium (DKTK), CCU Neuropathology, German Cancer Research Center (DKFZ), Heidelberg, Germany, 6Department of Neuroradiology, University of Heidelberg, Heidelberg, Germany
Synopsis
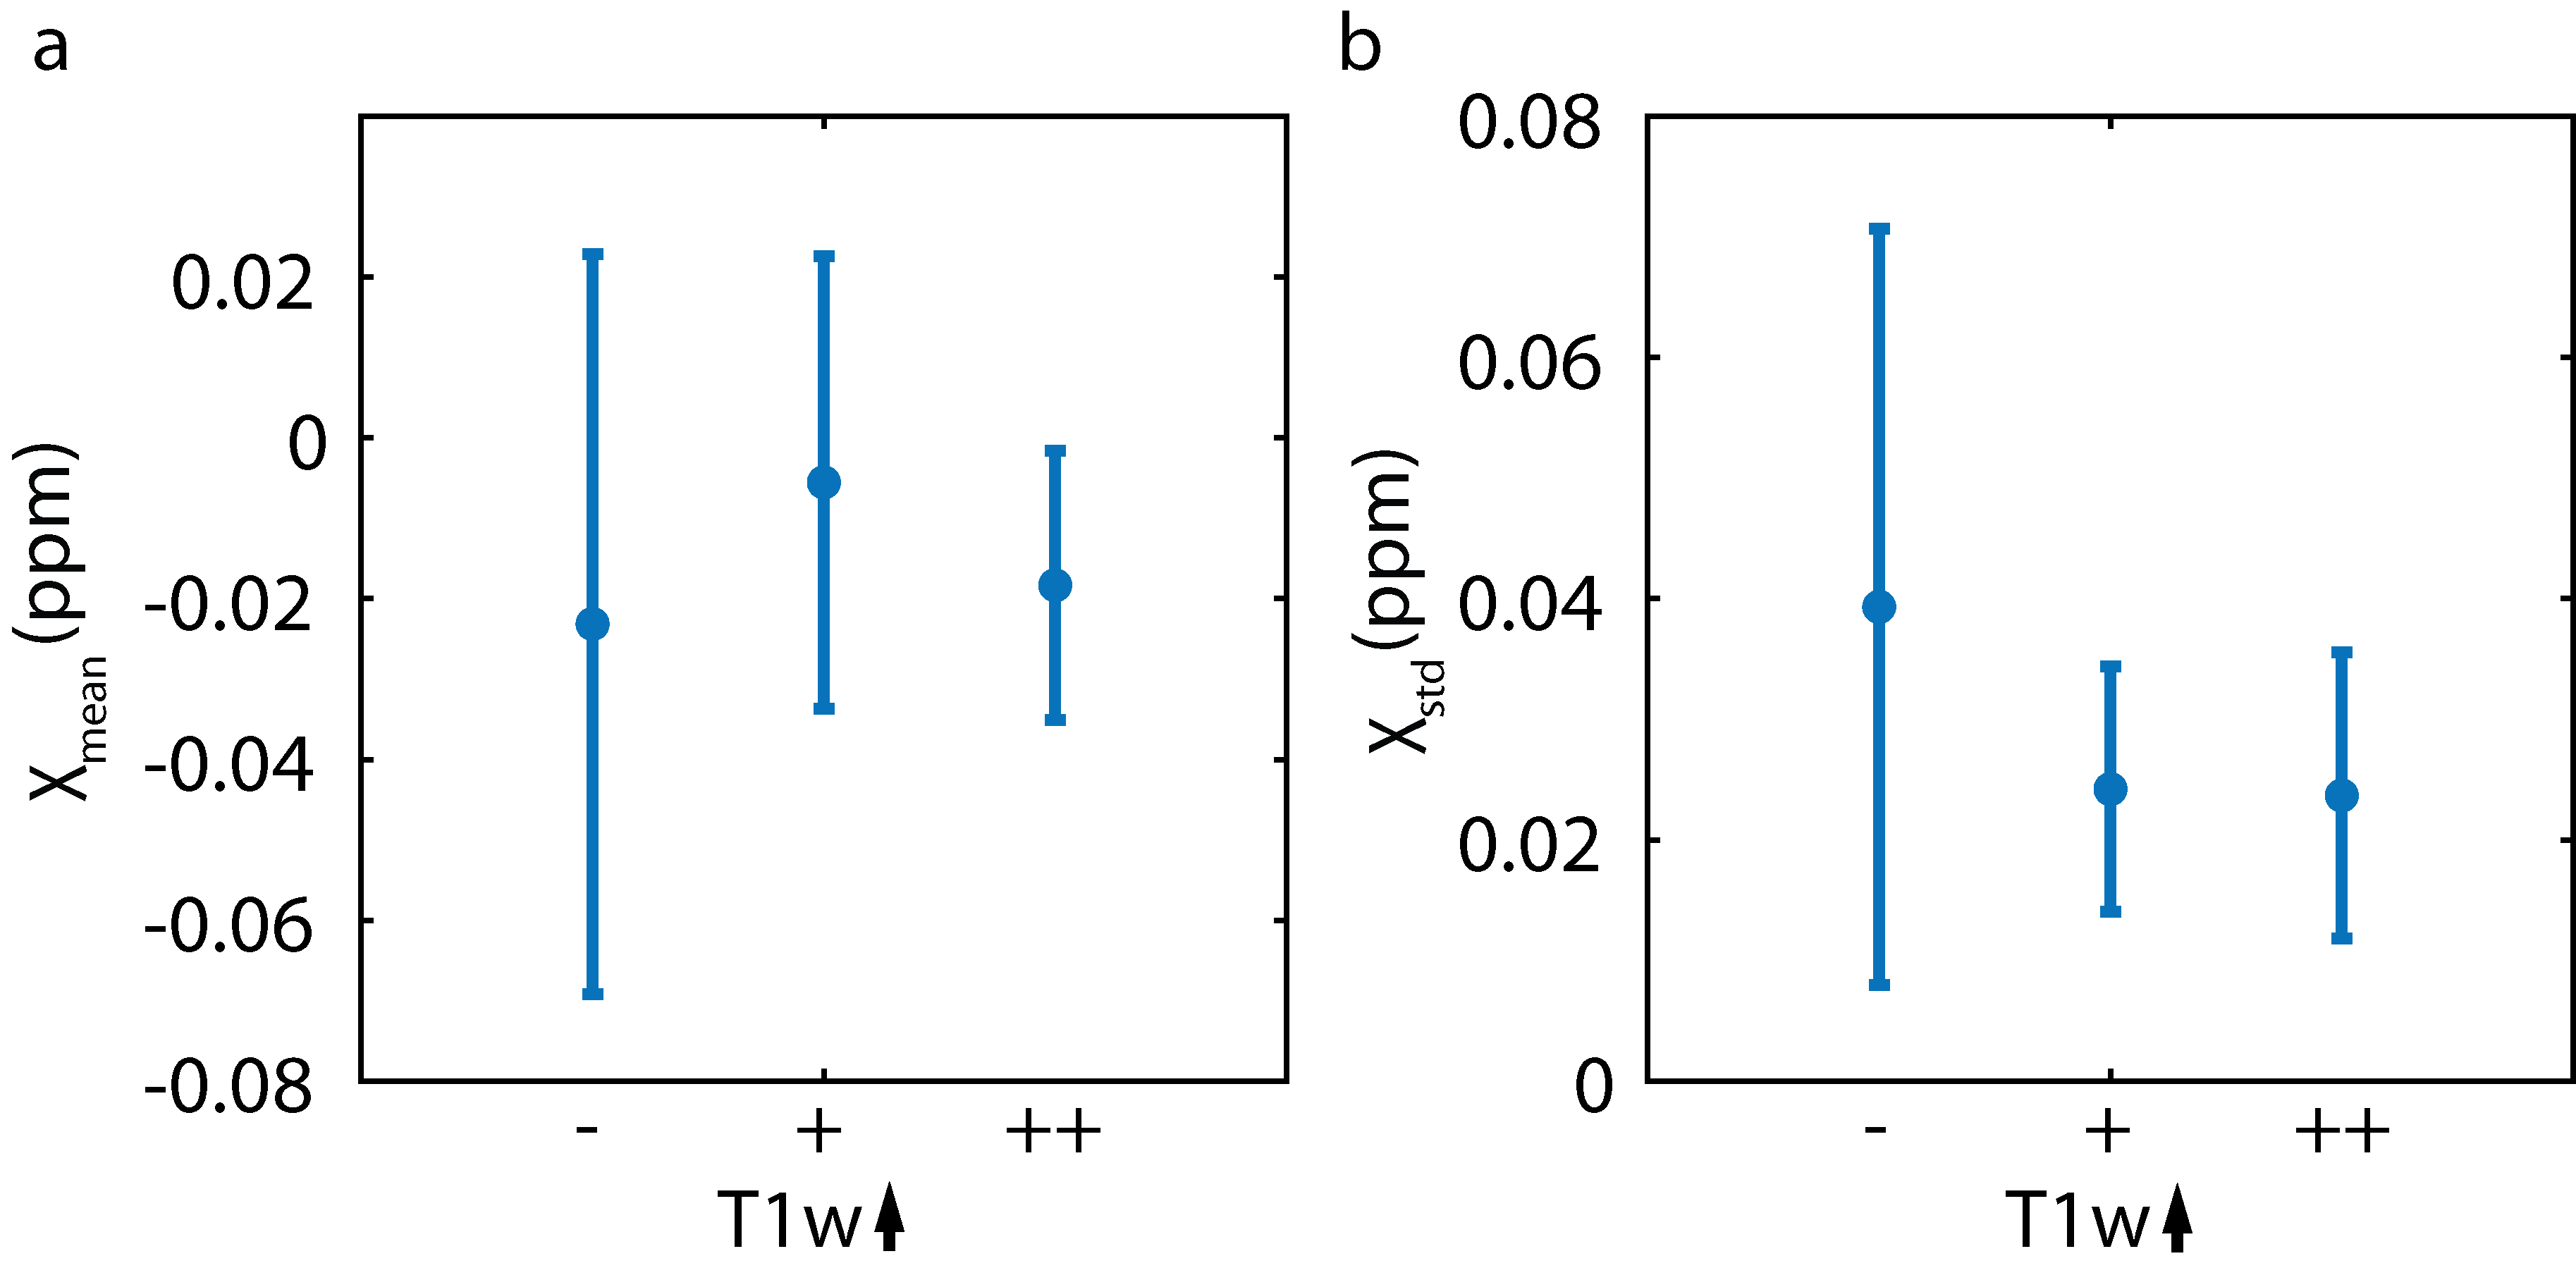
Melanoma metastases can be classified as melanotic or amelanotic based on their T1-weighted magnetic resonance signal. However, the underlying contrast mechanisms have remained unclear and have been attributed to melanin and/or blood products. In this study, non-hemorrhagic cerebral melanoma metastases were investigated using quantitative susceptibility mapping. Susceptibility values for metastases with no, small or high melanin content were very similar (‑0.023±0.046 ppm / -0.006±0.02 ppm / -0.018±0.017 ppm). Non-hemorrhagic melanoma metastases show weakly diamagnetic susceptibility values and melanin is not a source of strong susceptibility.
Purpose
To quantify the influence of melanin content in melanoma metastases on tissue susceptibility.Methods
The study was conducted in accordance with the Declaration of Helsinki. Institutional review board approval was obtained and all subjects provided written informed consent. Twenty stage IV melanoma patients (27-79 years; mean age 59.4 ± 14.2 years) with non-hemorrhagic brain metastases were included. Twenty-three metastases in these patients were evaluated.
Nineteen patients were scanned on a 1.5 T whole-body MR system (Magnetom Symphony, Siemens Healthcare, Erlangen, Germany) with a 12-channel head-matrix coil. A 3D gradient-echo sequence (pre-contrast) and a T1-weighted spin-echo sequence (pre- and post-contrast) were acquired during routine clinical workup with a clinical protocol. Acquisition parameters for the 3D gradient echo sequence were: flip angle = 15°, TR/TE = 49/40 ms, acquisition matrix = 320x250x72, voxel size = 0.75x0.88x1.9 mm³, readout bandwidth 80 Hz/pixel, partial parallel imaging (generalized autocalibrating partially parallel acquisitions, GRAPPA (1)) with an acceleration factor R = 2 and 24 reference lines and acquisition time of 5:39 min. The T1-weighted sequences (pre-/ post-contrast) were acquired with the following imaging parameters: flip angle = 90°, TR/TEpre/TEpost = 500/15/17 ms, acquisition matrix = 320x230x35, voxel size = 0.7x0.8x4 mm³, readout bandwidth 100/130 Hz/pixel, and acquisition time of 4:00 min. One patient was measured on a 3 T whole body MR system (Biograph mMR, Siemens Healthcare, Erlangen, Germany) using a similar protocol. Phase images from different coils were combined using the vendor-provided adaptive combine method (2). Brain masks were generated from the magnitude images using FSL-BET (3). Phase images were unwrapped using a Laplacian-based phase unwrapping (4, 5, 6) and the background field was removed with V-SHARP (5, 6) (with kernel size up to 25 mm). Susceptibility maps were calculated in Matlab (The MathWorks, Inc., Natick, MA, USA) using the iLSQR method (4, 7). Susceptibility maps were referenced with cerebrospinal fluid from the atrium of the lateral ventricles. T1-weighted pre- and post-contrast images were co-registered to the gradient echo magnitude images for each patient using affine registration in FSL-FLIRT (8). Non-hemorrhagic melanoma metastases were identified based on post-contrast T1-weighted images and susceptibility maps. Masks for the reference regions/ metastases were drawn on the magnitude/ T1-weighted images using the Medical Imaging Interaction Toolkit (MITK) (9, 10). Metastases’ size was computed from these masks.
Metastases were grouped in three groups according to their appearance in pre-contrast T1-weighted images to be hypo-/isointense (amelanotic pattern), slightly hyperintense and strongly hyperintense (melanotic pattern) (11, 12). Susceptibility values were calculated with Matlab as mean values over each mask.
Histology data was obtained from two patients.
Results
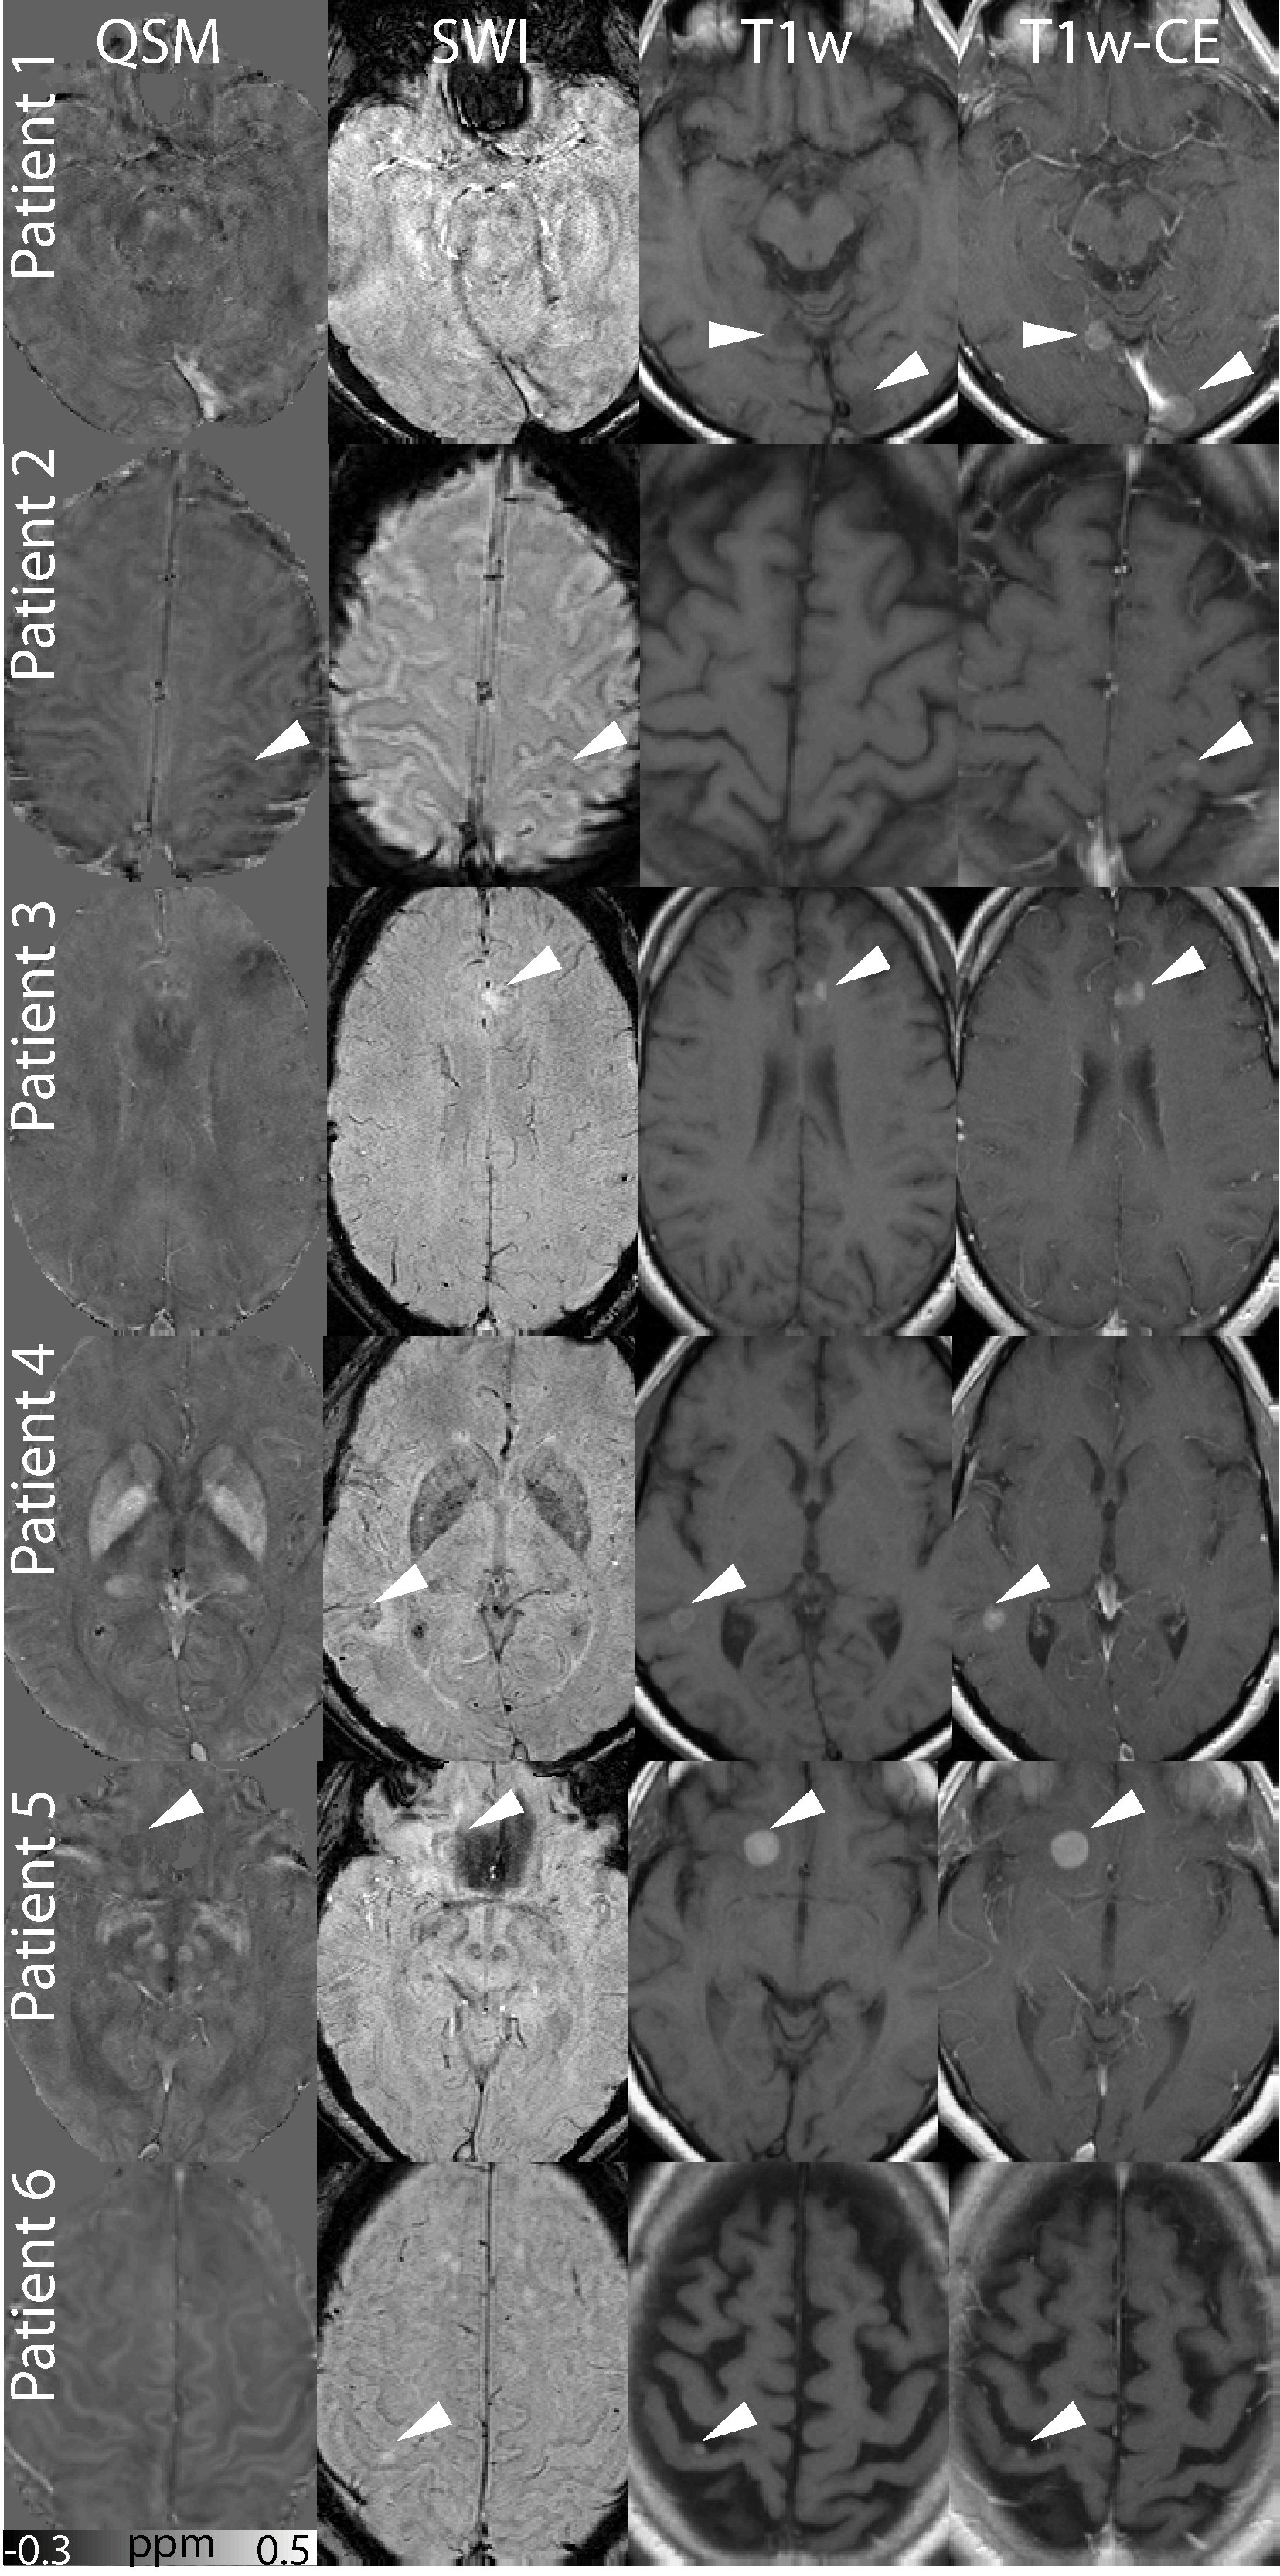
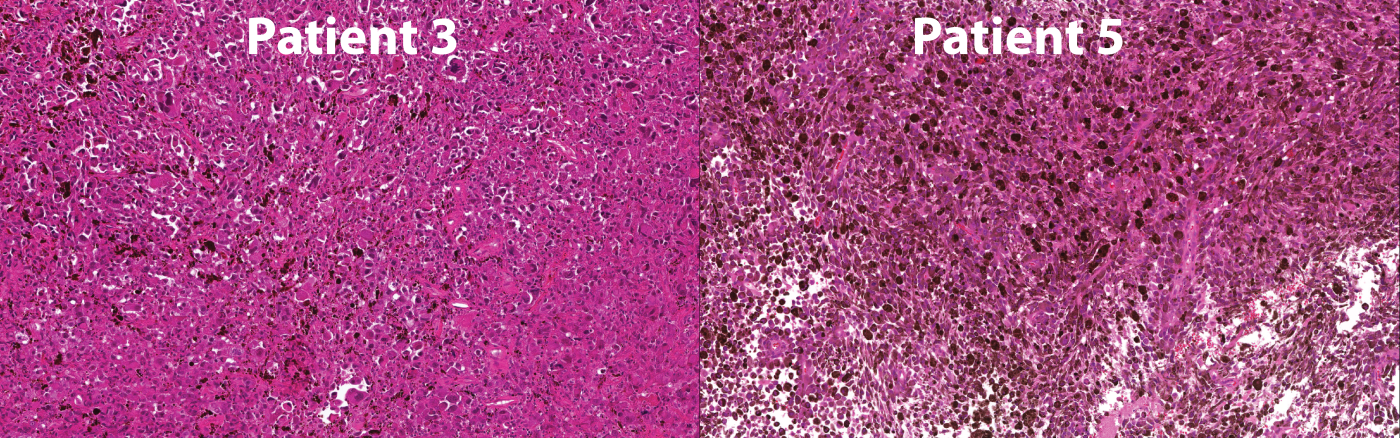
The mean size of metastases in this study was 490±423 mm³ and the size of the 23 metastases varied between 54 and 1618 mm³. Figure 1 shows seven contrast enhancing metastases in six patients. Three metastases show an amelanotic pattern (Patient 1-2) and four show a melanotic pattern (Patient 3-6). In QSM and SWI, some metastases are visible as dark and bright spots (arrow heads), respectively; other metastases are nearly indistinguishable from the surrounding brain tissue. Melanoma metastases which were hypo- or isointense (11 metastases) in T1-weighted images showed mean susceptibility values of ‑0.023±0.046 ppm, metastases which were slightly hyperintense (7 metastases) -0.006±0.028 ppm and strongly hyperintense (5 metastases) -0.018±0.017 ppm (Figure 2). Patient 3 shows only moderate melanin content, whereas Patient 5 shows strong melanin content (Figure 3).Discussion
According to (13) and Fig. 1 and 3, melanin content histologically corresponds to hyperintensities in T1-weighted pre-contrast images. Moreover, melanoma metastases, especially metastases with high melanin content have been associated to paramagnetic behavior (11), but it has been argued whether melanin or blood products are the guiding force for the paramagnetism observed (12). In this study, a weakly diamagnetic behavior of melanoma metastases independent of their melanin content was observed. Melanoma metastases show a high propensity to be hemorrhagic (14, 15), therefore, it is likely that previously reported paramagnetism in melanoma metastases originated from interlesional blood products.
Restricting this study to non-hemorrhagic metastases reduced the number of metastases and patients included as well as the available histology information. However, this restriction is necessary, since it is not possible to compute susceptibility values of the metastatic tissue itself when blood and blood products with strong susceptibility effects are present within the lesion (16).
Conclusion
Melanin is no strong source of susceptibility in melanoma metastases. Susceptibility of melanoma metastases is weakly diamagnetic and slight susceptibility differences between individual melanoma metastases and their visibility in susceptibility maps seem not to be primarily governed by their melanin content.Acknowledgements
No acknowledgement found.References
1. Griswold MA, Jakob PM, Heidemann RM, Nittka M, Jellus V, Wang JM, Kiefer B, Haase A. Generalized autocalibrating partially parallel acquisitions (GRAPPA). Magn Reson Med 2002;47(6):1202–1210.
2. Prock T, Collins DJ, Dzik-Jurasz ASK, Leach MO. An algorithm for the optimum combination of data from arbitrary magnetic resonance phased array probes. Phys Med Biol 2002;47(2):N39-N46.
3. Smith SM. Fast robust automated brain extraction. Human Brain Mapping 2002;17(3):143-155.
4. Li W, Wu B, Liu CL. Quantitative susceptibility mapping of human brain reflects spatial variation in tissue composition. Neuroimage 2011; 55(4):1645-56.
5. Li W, Avram AV, Wu B, Xiao X, Liu CL. Integrated Laplacian-based phase unwrapping and background phase removal for quantitative susceptibility mapping. Nmr Biomed. 2014;27(2):219-227.
6. Wu B, Li W, Guidon A, Liu CL. Whole brain susceptibility mapping using compressed sensing. Magn Reson Med 2012;67(1):137-147.
7. Li W, Wang N, Yu F, Han H, Cao W, Romero R, Tantiwongkosi B, Duong TQ, Liu CL. A method for estimating and removing streaking artifacts in quantitative susceptibility mapping. Neuroimage 2015;108:111-122.
8. Patenaude B, Smith SM, Kennedy D, Jenkinson M. A Bayesian Model of Shape and Appearance for Subcortical Brain. Neuroimage 2011;56(3):907-922.
9. Maleike D, Nolden M, Meinzer HP, Wolf I. Interactive segmentation framework of the Medical Imaging Interaction Toolkit. Comput Meth Prog Bio 2009;96(1):72-83.
10. Nolden M, Zelzer S, Seitel A, Wald D, Müller M, Franz AM, Maleike D, Fangerau M, Baumhauer M, Maier-Hein L, Maier-Hein KH, Meinzer HP and Wolf I, The Medical Imaging Interaction Toolkit: challenges and advances, Int J Comput Assist Radiol Surg. 2013;8(4):607-620.
11. Escott JE. A Variety of Appearances of Malignant Melanoma in the Head: A Review. RadioGraphics 2001; 21:625–639.
12. Woodruff WWJr, Djang WT, McLendon RE, Heinz ER, Voorhees DR. Intracerebral malignant melanoma: high-field-strength MR imaging. Radiology 1987;165:209–213.
13. Isiklar I, Leeds NE, Fuller GN, Kumar AJ. Intracranial Metastatic Melanoma: Correlation Between MR Imaging Characteristics and Melanin Content. AJNR 1995;165:1503-1512.
14. McGann G, Platts A. Computed tomography of cranial metastatic malignant melanoma: features, early detection and unusual cases. Br J Radiol. 1991;64:310–3.
15. G Sze, G Krol, WL Olsen, PS Harper, JH Galicich, LA Heier, RD Zimmerman, MD Deck. Hemorrhagic neoplasms: MR mimics of occult vascular malformations. AJR Am J Roentgenol 1987;149(6):1223-30.
16. Deistung A, Schweser F, Wiestler B, Abello M, Roethke M, Sahm F, Wick W, Nagel AM, Heiland S, Schlemmer HP, Bendszus M, Reichenbach JR, Radbruch A. Quantitative susceptibility mapping differentiates between blood depositions and calcifcations in patients with glioblastoma. Plos One 2013;8(3):1-8.
Figures