1964
Quantification of Dendronized Superparamagnetic Iron Oxide Nanoparticles in Rat Liver Using Quantitative Susceptibility Mapping1InBrain Lab, Department of Physics, Faculty of Philosophy, Sciences and Letters of Ribeirão Preto, University of Sao Paulo, Ribeirão Preto, SP, Brazil, Brazil, 2Laboratoire des sciences de l’ingénieur, de l’informatique et de l’imagerie (ICube), UMR 7357, Fédération de Médecine Translationnelle de Strasbourg, Université de Strasbourg/CNRS, Illkirch, France, 3Department of Physiology, Biophysics and Systems Biology, Weill Cornell Medicine, Cornell University, New York, United States
Synopsis
Quantitative Susceptibility Mapping was environment independent to quantify iron of SPIONs compared with R2*.
Introduction:
Quantitative susceptibility mapping (QSM) have been used to identify superparamagnetic iron oxide nanoparticles (SPIONs) in different animal model studies: in vivo brain rat (1), acute inflammation on post-mortem animal (2), to differentiate SPIONs deposition and air regions (3). However, QSM has not been yet used as a quantitative technique to calculate SPIONs concentration in the animal body. In this study, we quantify dendronized SPIONs in rat livers and correlate with iron concentration determined by Inductively Coupled Plasma by Atomic Emission Spectroscopy (ICP-AES).Materials and Methods:
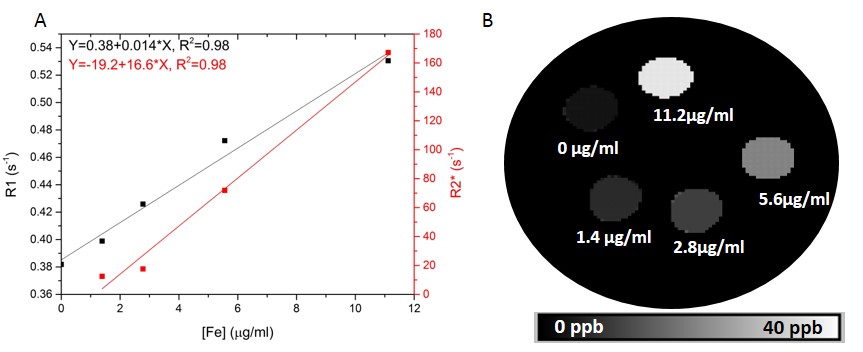
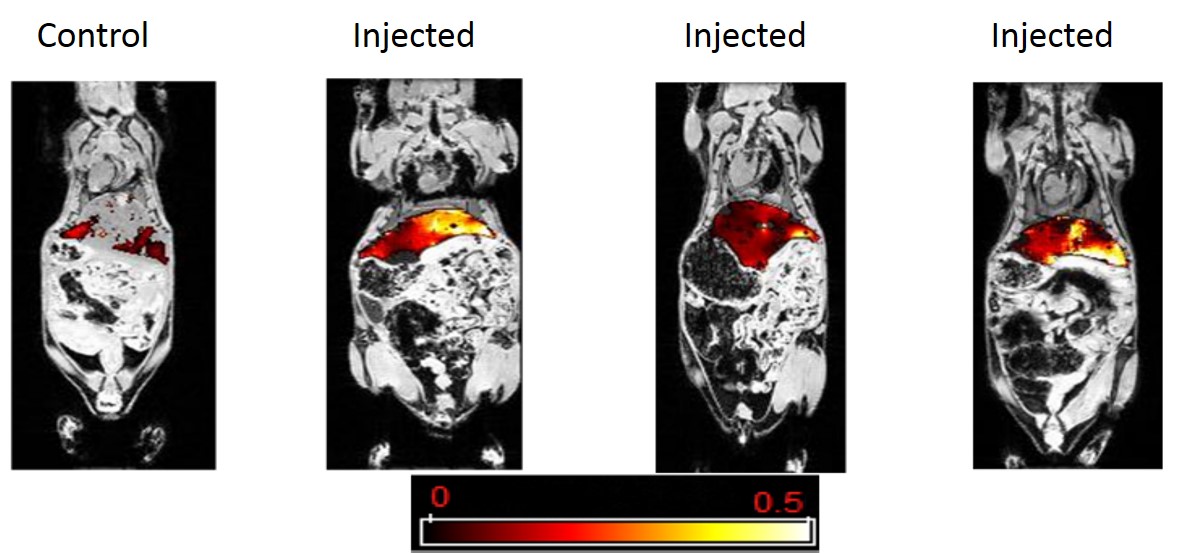
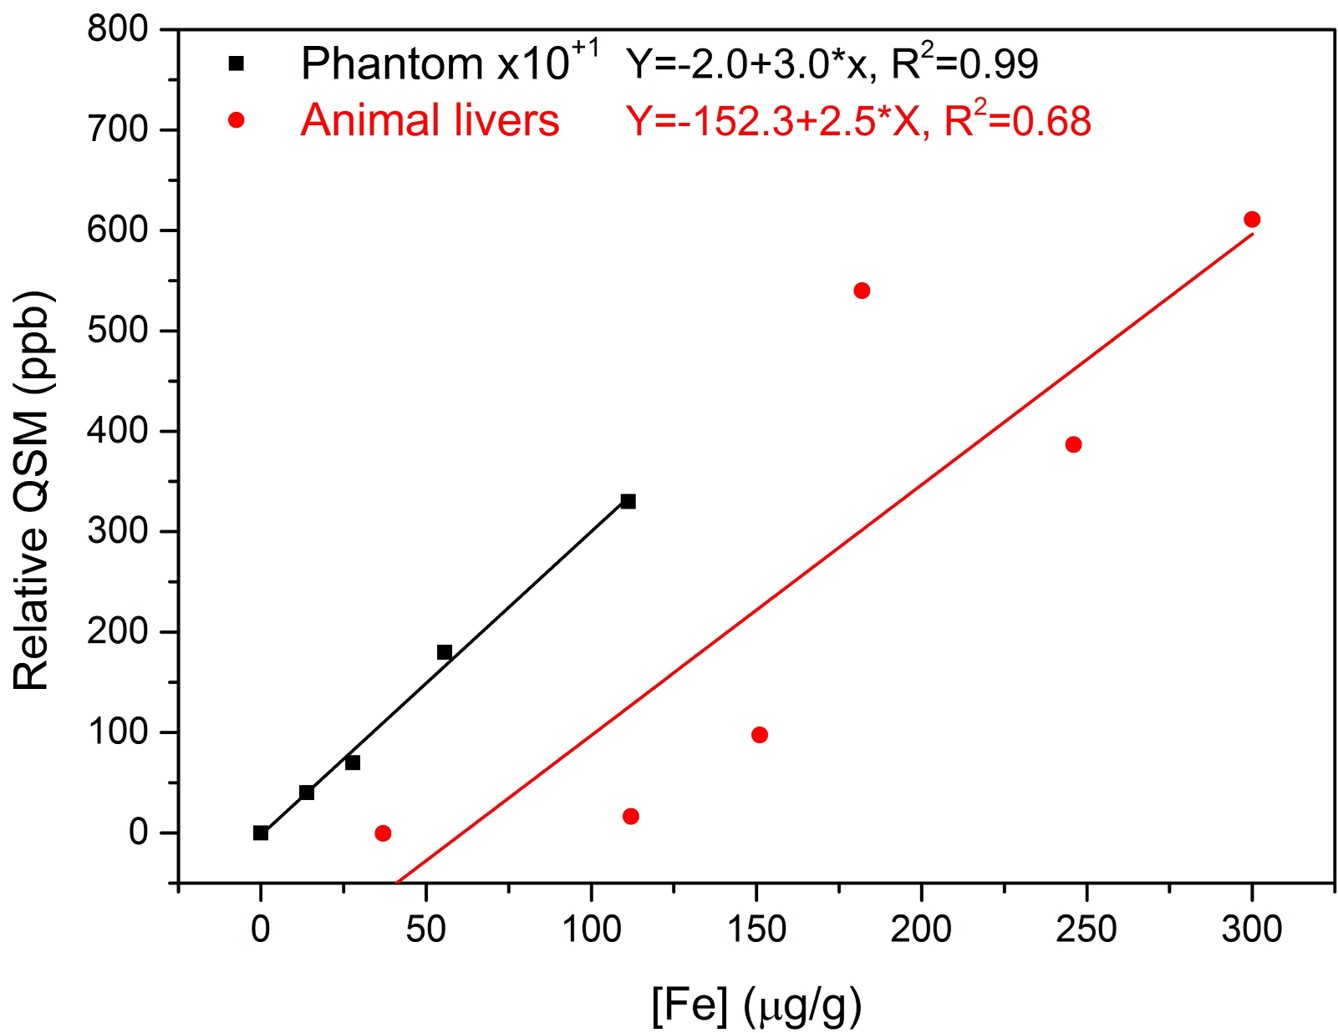
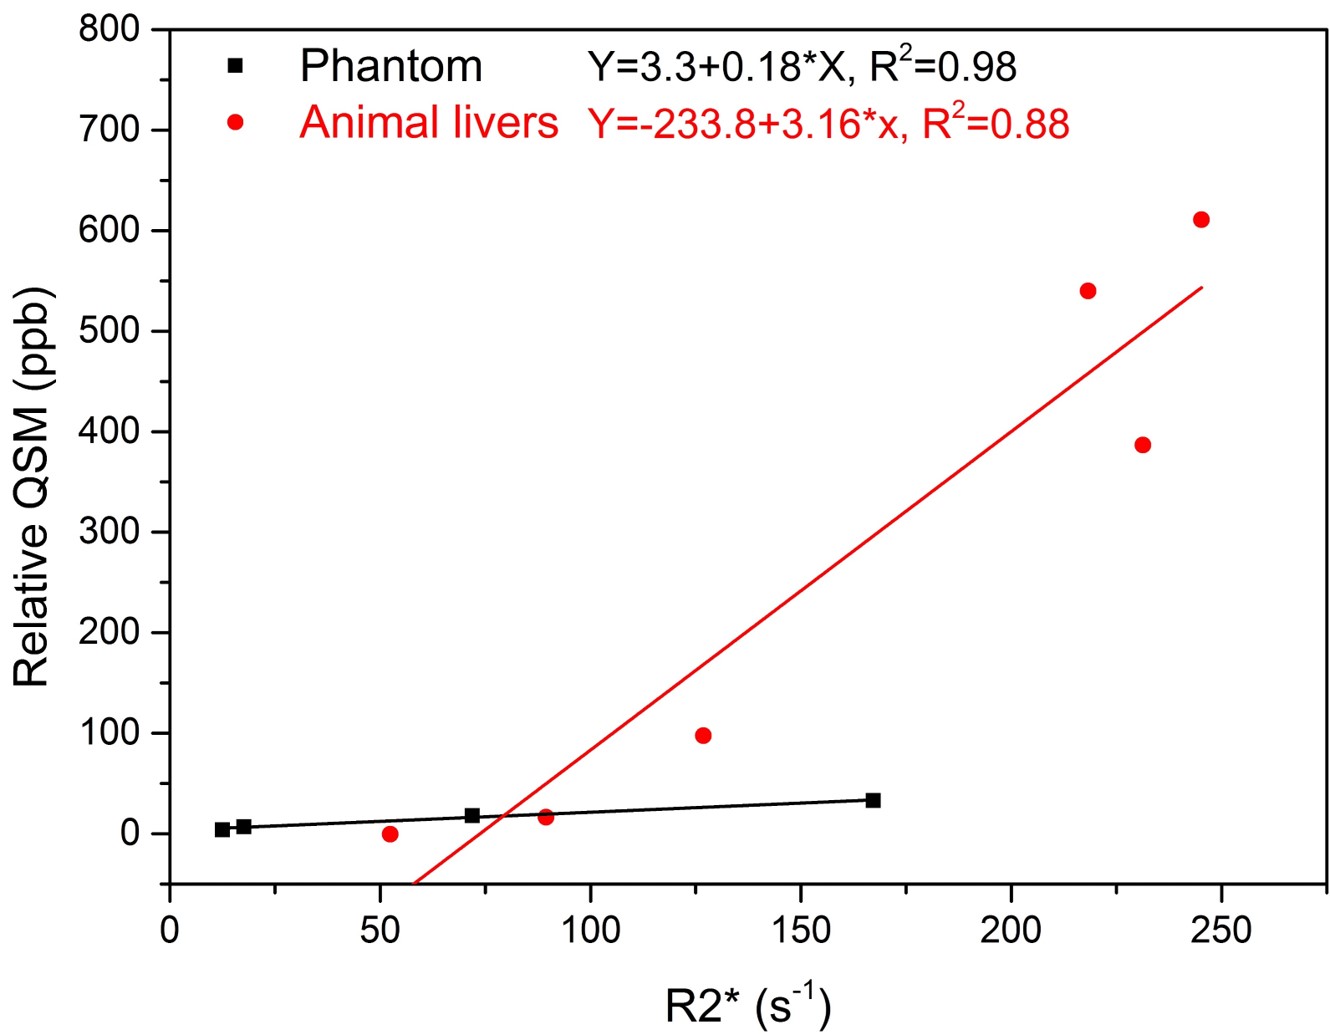
Five latex balloons (length~9 cm, diameter=6mm) were filled with solution of dendronized SPIONs with different concentrations: 0, 1.4, 2.8, 5.6, 11.2 µgFe/ml. A phantom was made fixing all the balloons inside of a cylindrical container (diameter=30 mm, length=115 mm) in a gelatin matrix (6%). 300 microliters at 3.4 mM dendronized SPIONs (4) were injected into tail vein of four swiss white mice (~30 g, 7 weeks), followed of euthanizing after 1 (n=1), 3 (n=1) and 24 (n=2) hours. Magnetic resonance images were acquired on 7T scanner (Bruker, BioSpin) from the phantom and the euthanized animals: two controls and four injected animals. Multi-Gradient-Echo images (TR=40ms, TE=3.4, 8.4 13.4, 18.4, 23.4 and 28.4 ms, BW=232 Hz/pixels, matrix 256x128x80, N averages=4 and isotropic resolution 0.3 mm) were used to calculate susceptibility and R2* maps. Field map estimation was performed using a non-linear least squares fit to the complex MR data (5). The SPURS graph cut algorithm was used to perform phase unwrapping and water/fat separation of the field map (6). A mask for QSM reconstruction was created by applying region-growing algorithm to the magnitude image in the ITK-Snap image processing software (7). The QSM map was then constructed by preconditioned total field dipole inversion (8) of the corrected field map. A mask for the preconditioner was created by thresholding the noise standard deviation map to approximately identify air, tissue regions with contrast agent and tissue regions without contrast agent, with voxel values greater than 1 were set to 30, values greater than 0.5 set to 10 and values less than 0.5 set to 1. Values outside the preconditioner mask were set to 1000. In the phantom, QSM processing was similarly reported by Zheng et al. (2013). R2* maps were reconstructed by applying the Auto-Regression on Linear Operations algorithm to the absolute value of the complex MR data (10). Iron concentration of nanoparticle solutions and liver tissue samples were quantified by a standard procedure used in ICP-AES. In addition, T1 RARE images (TR=208, 400, 800, 1500, 3000 and 3500 ms; TE=14 ms; matrix 64x64, isotropic resolution 0.3 mm) were acquired to generate a R1 map in the phantom.Results:
Dendronized SPIONs showed r1, r2* and susceptibility rates for iron concentration of 0.014 s-1/mgFe/ml, 16.6 s-1/mgFe/ml and 3.0 ppb/ml, respectively (Fig.1). Liver QSM maps show a non-uniform nanoparticule distribution in the injected mice (Fig.2). Similar linear trends between relative QSM values and iron concentration were observed in the phantom (slope: 3.0 ppb/mgFe/g) and the animal livers (slope: 2.5 ppb/mgFe/g) (Fig. 3). Figure 4 shows very different slope coefficients between relative susceptibility versus R2* values in the phantom (slope: 0.18 ppb/s-1) and animal livers (slope: 3.16 ppb/s-1).Discussion and Conclusion:
The high relaxivity ratio (r2*/r1 = 1186) indicates our dendronized SPIONs as a negative T2* contrast agent (Fig.1). QSM technique was able to estimate SPIONs concentration distribution in animal livers to assess the dynamic bio-distribution (Fig.2). The relationship between QSM values and iron concentrations in the animal livers was weaker compared to the phantom results (Fig.3); a possible error source is the discrete sampling of the ICP-AES measurement, more animals could increase the power of our result. The slope coefficient for relative susceptibility versus R2* values in the phantom was around 17 times bigger than in the livers (Fig.4). A possible reason for the phantom and in vivo differences is the cell internalized fraction, as described in a previous in vitro study (11). These findings suggest that QSM value is more environment independent to quantify iron of SPIONs compared with R2*. Therefore, QSM mapping showed robustness as a positive contrast to quantify dendronized superparamagnetic iron oxide nanoparticles in mouse livers.Acknowledgements
We want to thank INTERREG IV Oberrhein Project (A21).References
1. DeRochefort L, Liu T, Guillemiller M, et al. Quantitative susceptibility imaging of the rat brain using a dedicated setup allowing different orientations along B0. Proc Intl Soc Mag Reson Med. 2010. p. 1134.
2. Wong R, Chen X, Wang Y, Hu X, Jin MM. Visualizing and quantifying acute inflammation using ICAM-1 specific nanoparticles and MRI quantitative susceptibility mapping. Ann Biomed Eng [Internet]. 2012;40(6):1328–38.
3. Liu T, Spincemaille P, de Rochefort L, Wong R, Prince M, Wang Y. Unambiguous identification of superparamagnetic iron oxide particles through quantitative susceptibility mapping of the nonlinear response to magnetic fields. Magn Reson Imaging [Internet]. 2010;28(9):1383–9.
4. Basly B, Felder-Flesch D, Perriat P, Pourroy G, Bégin-Colin S. Properties and suspension stability of dendronized iron oxide nanoparticles for MRI applications. Contrast Media Mol Imaging [Internet]. 2010;6(3):132–8.
5. Liu T, Wisnieff C, Lou M, Chen W, Spincemaille P, Wang Y. Nonlinear formulation of the magnetic field to source relationship for robust quantitative susceptibility mapping. Magn Reson Med [Internet]. 2013;69(2):467–76.
6. Dong J, Liu T, Chen F, et al. Simultaneous phase unwrapping and removal of chemical shift (SPURS) using graph cuts: application in quantitative susceptibility mapping. IEEE Trans Med Imaging [Internet]. 2015;34(2):531–40.
7. Yushkevich PA, Piven J, Hazlett HC, et al. User-guided 3D active contour segmentation of anatomical structures: significantly improved efficiency and reliability. Neuroimage [Internet]. 2006;31(3):1116–28.
8. Liu Z, Kee Y, Zhou D, Wang Y, Spincemaille P. Preconditioned total field inversion (TFI) method for quantitative susceptibility mapping. Magn Reson Med [Internet]. 2016;
9. Zheng W, Nichol H, Liu S, Cheng Y, Haacke E. Measuring iron in the brain using quantitative susceptibility mapping and X-ray fluorescence imaging. Neuroimage [Internet]. 2013;78:68–74.
10. Pei M, Nguyen TD, Thimmappa ND, et al. Algorithm for fast monoexponential fitting based on Auto-Regression on Linear Operations (ARLO) of data. Magn Reson Med [Internet]. 2015;73(2):843–50.
11. Girard OM, Ramirez R, McCarty S, Mattrey RF. Toward absolute quantification of iron oxide nanoparticles as well as cell internalized fraction using multiparametric MRI. Contrast Media Mol Imaging [Internet]. 2012;7(4):411–7.
Figures