1960
Evaluation of Quantitative Susceptibility Mapping for the visualization of the Globus Pallidus Internus and Subthalamic Nucleus at 3T and 7T1State Key Laboratory of Brain and Cognitive Science, Beijing MRI Center for Brain Research, Institute of Biophysics, Chinese Academy of Sciences, Beijing, People's Republic of China, 2Graduate University, Chinese Academy of Sciences, Beijing, People's Republic of China, 3Center for Magnetic Resonance Research, University of Illinois at Chicago, Chicago, IL, United States, 4Stevens Neuroimaging and Informatics Institute, University of Southern California, Los Angeles, CA, United States
Synopsis
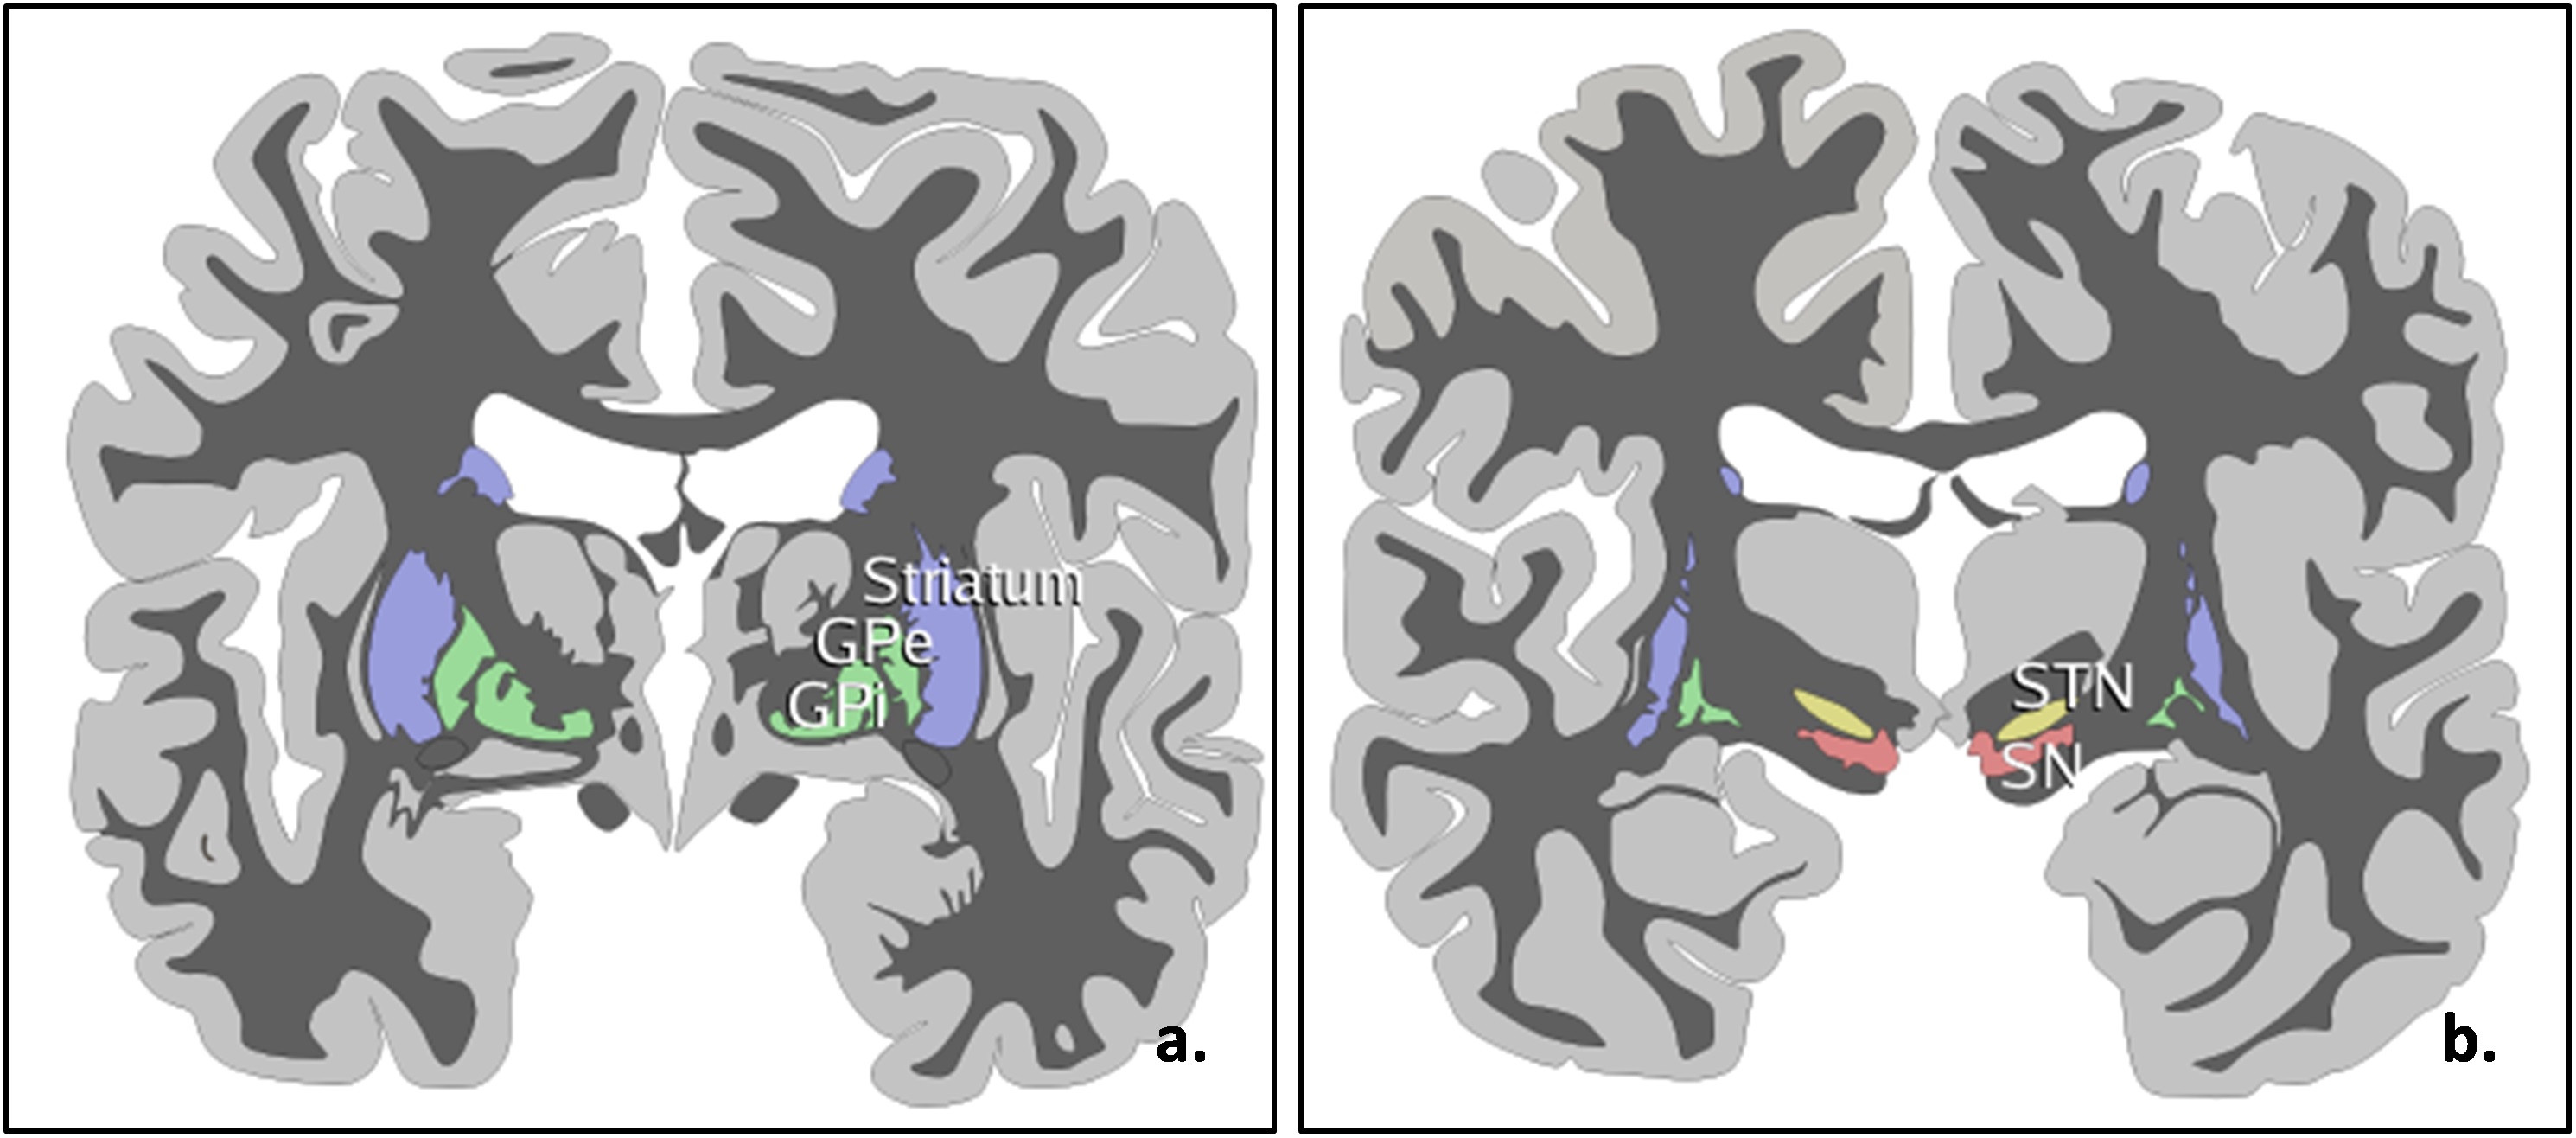
The globus pallidus internus (GPi) and subthalamic nucleus (STN) (Figure 1) were the commonly used nuclei in deep brain stimulation (DBS) for the treatment of the Parkinson disease. In this study, we evaluated the QSM, T2* weighted and SWI methods for the visualization the GPi and STN on both 3T and 7T scanners. Our results showed the QSM at 7T displayed an excellent delineation of the GPi and STN, compared with T2* and SWI images.
Introduction
Deep brain stimulation (DBS) of the globus pallidus internus (GPi) as well as the subthalamic nucleus (STN) has demonstrated remarkable benefits on the treatment of resistant neurological disorders, such as Parkinson disease(2). The accurate targeting of the GPi and STN is crucial for the successful operation of DBS. The susceptibility-weighted imaging methods such as T2* mapping, susceptibility weighted imaging (SWI) and quantitative susceptibility mapping (QSM) may have the potential to image the deep gray matter nuclei. The susceptibility-weighted imaging methods also benefit from ultra-high magnetic field with decreased R2* and increased magnetic susceptibility as well as high spatial resolution. In this study, we aimed to evaluate the susceptibility-weighted imaging methods including T2*, SWI and QSM for the visualization of Globus Pallidus Internus and Subthalamic Nucleus at both 3T and 7T. We hypothesis that QSM with high spatial resolution at 7T offers optimal visualization of GPi and STN, compared to the T2* and SWI methods.Method
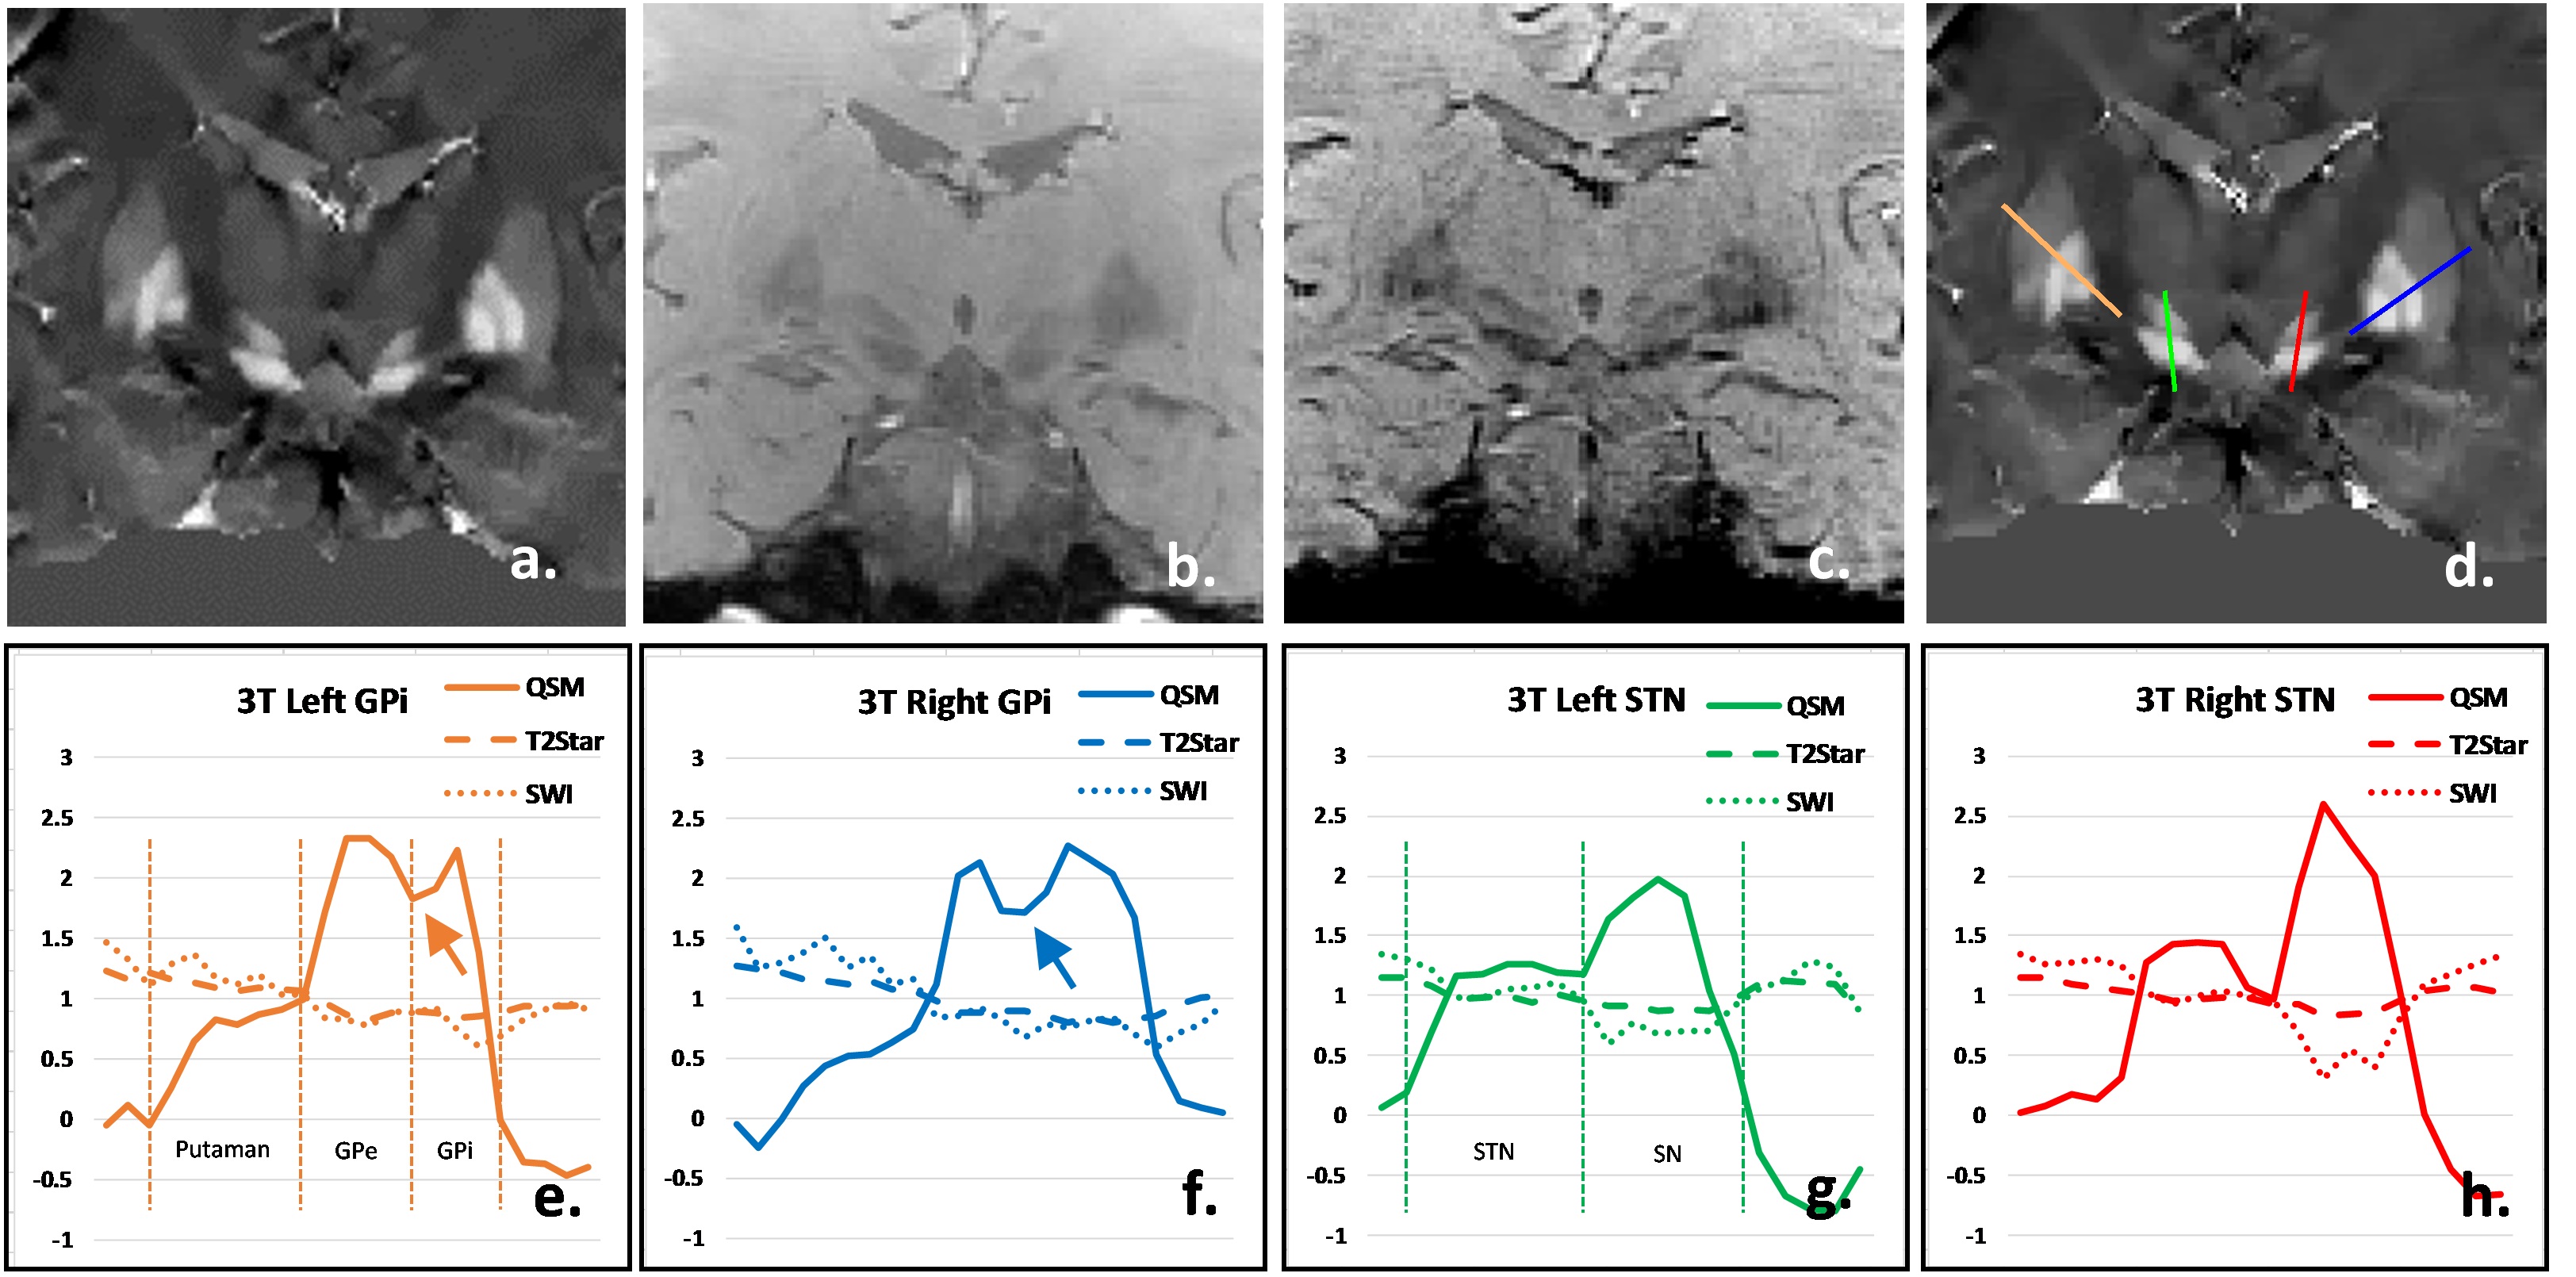
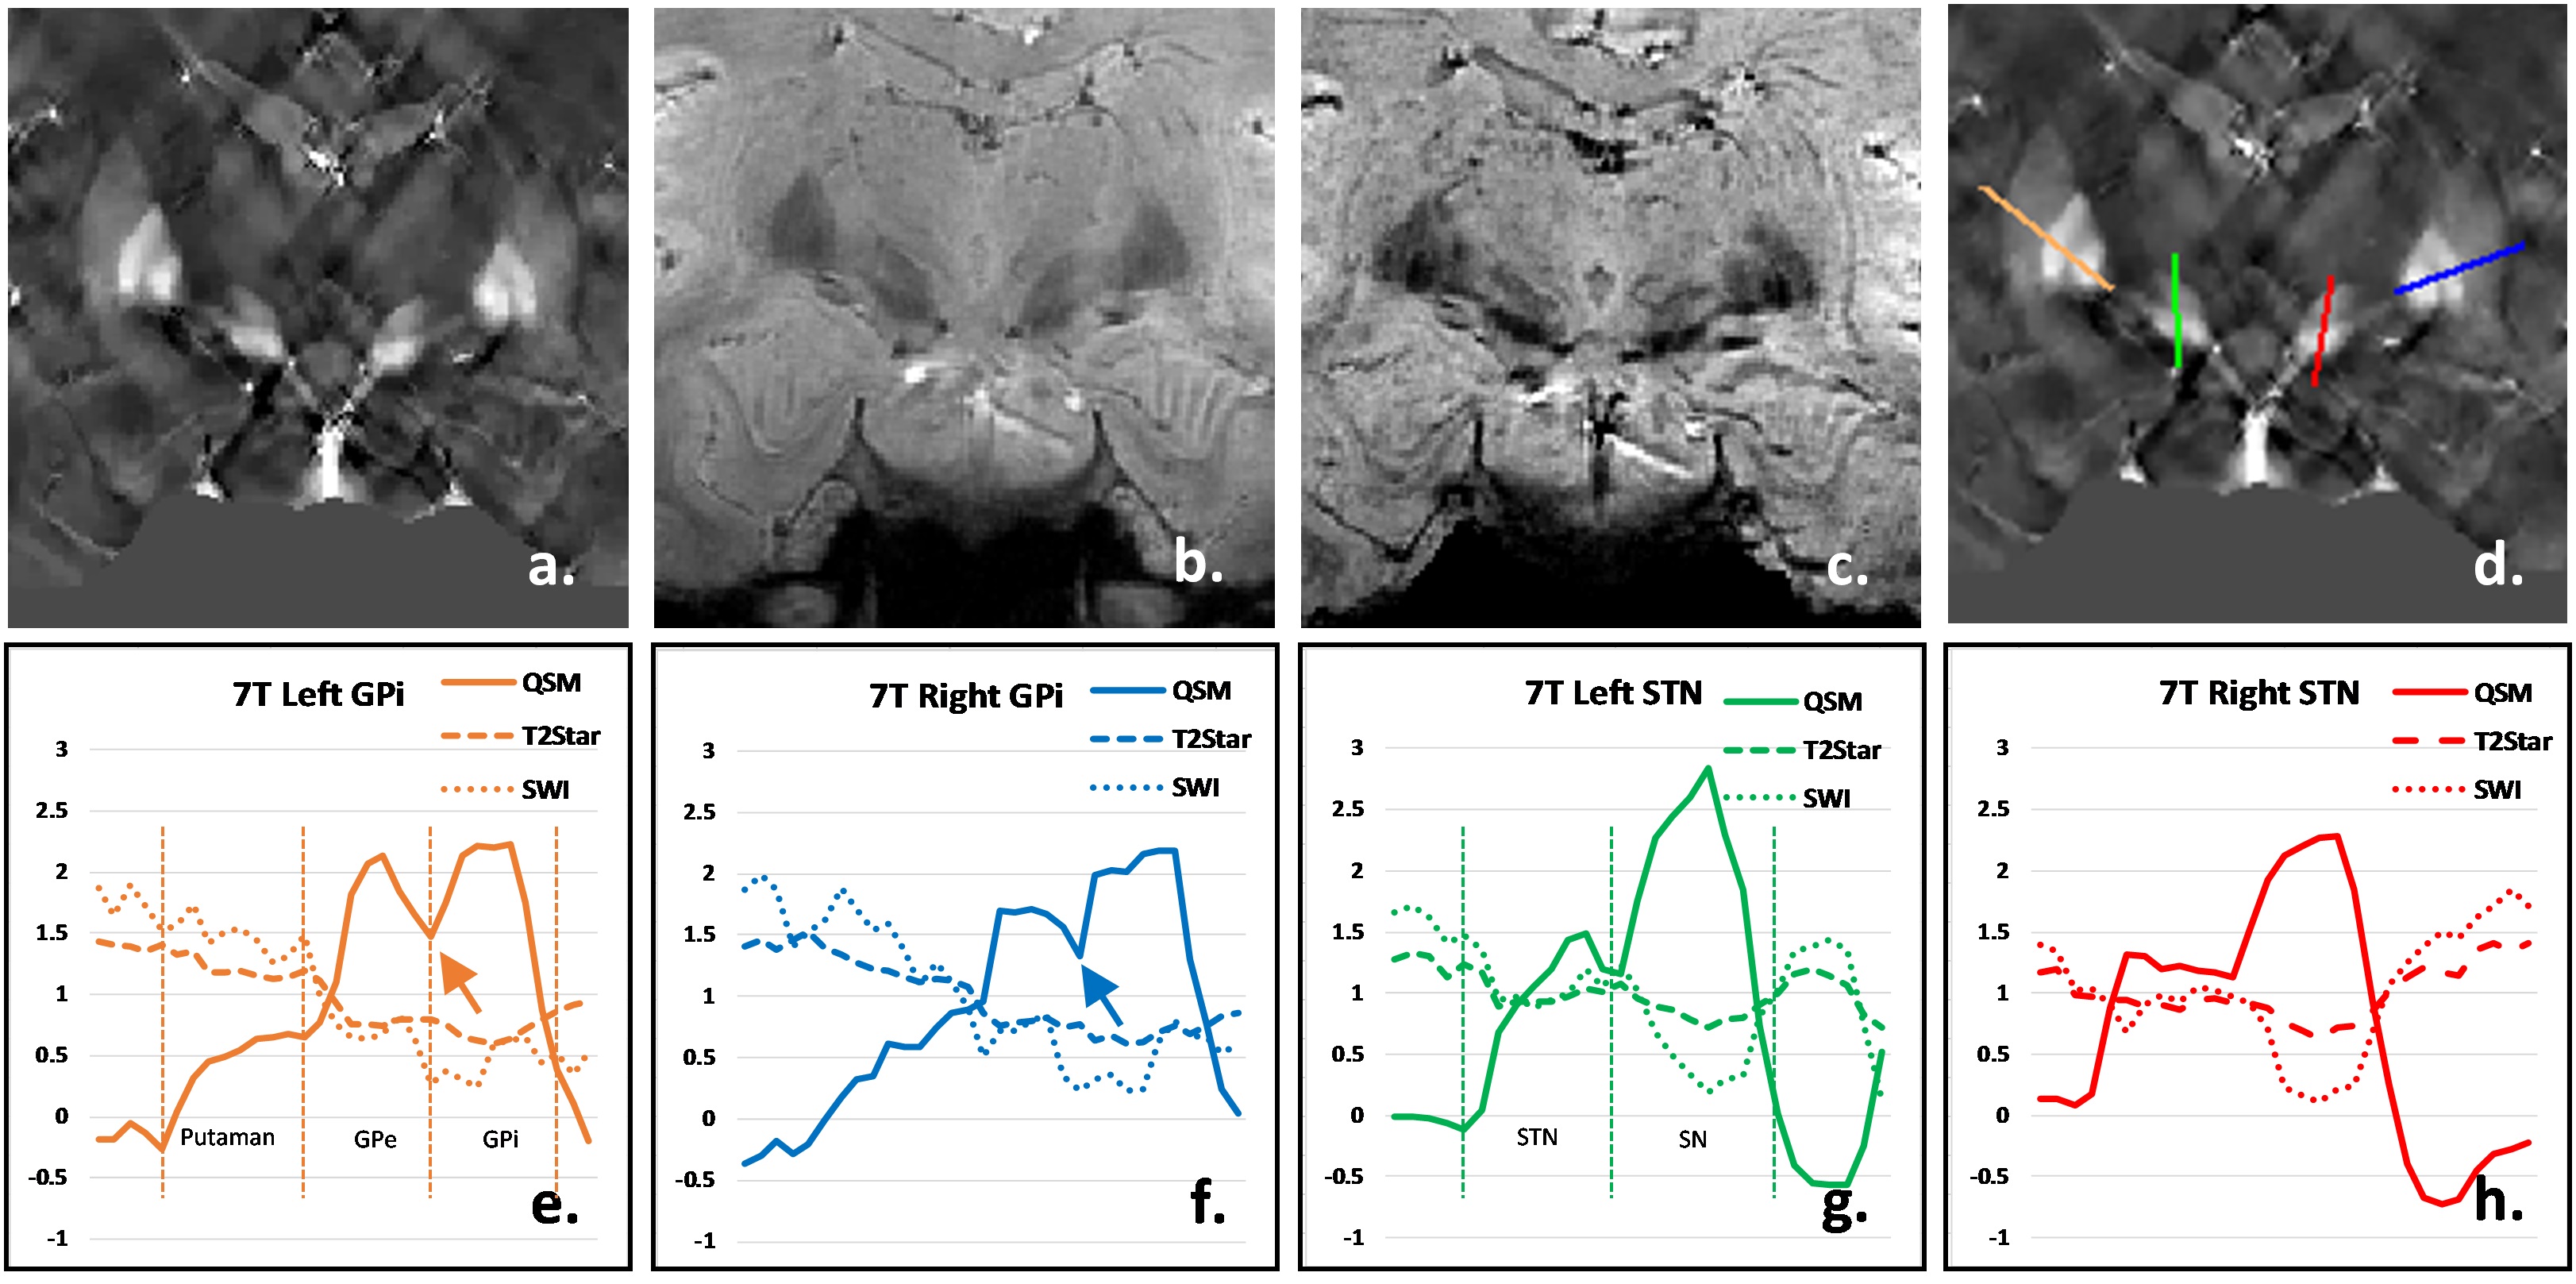
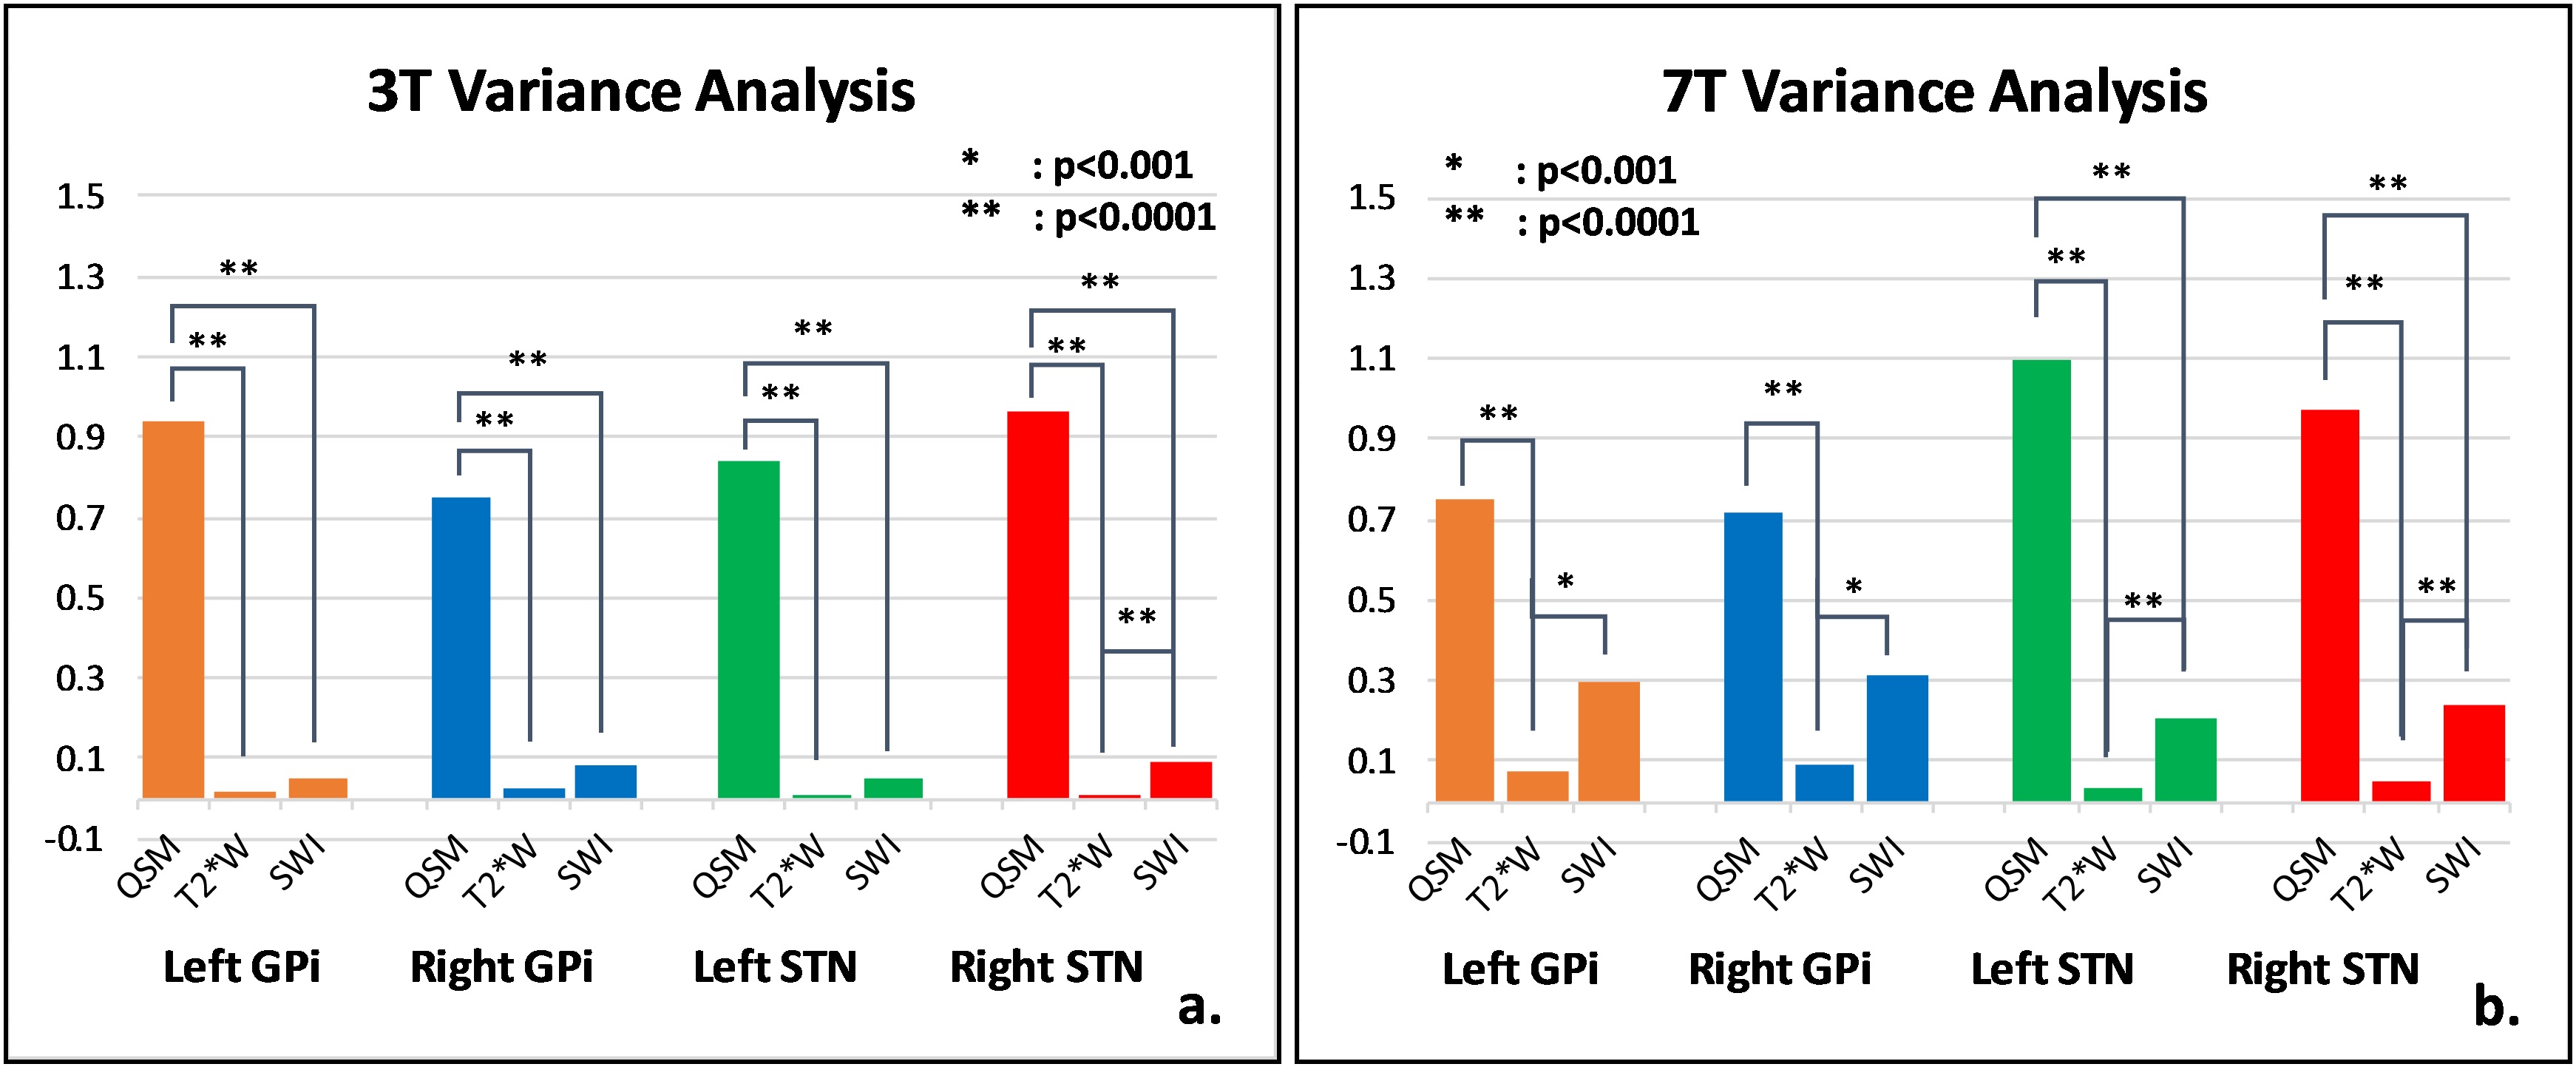
Coronal, high resolution, three-dimensional (3D) T2*-weighted multi-gradient-echo images were acquired on a 7T research system (Siemens, Erlangen Germany) with the imaging parameters including acquisition matrix=192x192x72; voxel size=0.5x0.5x1.2 mm3; FA=14°; TR=40ms; TE=6.2/11.69/17.18/22.67/28.16ms. For comparison, the same multi-echo GRE sequence was also performed on a Siemens Prisma 3T scanner with the imaging parameters of acquisition matrix=192x192x48; voxel size=0.75x0.75x2mm3; FA=15°; TR=45ms; TE=6.36/11/91/17.46/23.01/28.56/34.11/39.66ms.The QSM images were calculated using MEDI (3). SWI images were generated by multiplying the magnitude data of the 5th echo at 3T or the 3rd echo at 7T with 2D high-pass filtered phase data (4). The T2* images were generated by taking the square root of sum of squares of magnitude data at all echo times (2). For qualitative comparison of the structural contrast between GPi and GPe, STN and SN, four lines were drawn from the outer side of putamen to the inner side of GPi and from the upper of STN to the lower of SN (Figure 1d&2d). The signal intensity profile along each line was acquired for each imaging method, which was subsequently normalized by the mean absolute signal intensity of each curve. The square of standard deviation of the normalized data was treated as the contrast variance of each imaging method. The F-test was used to compared the contrast variance.Results
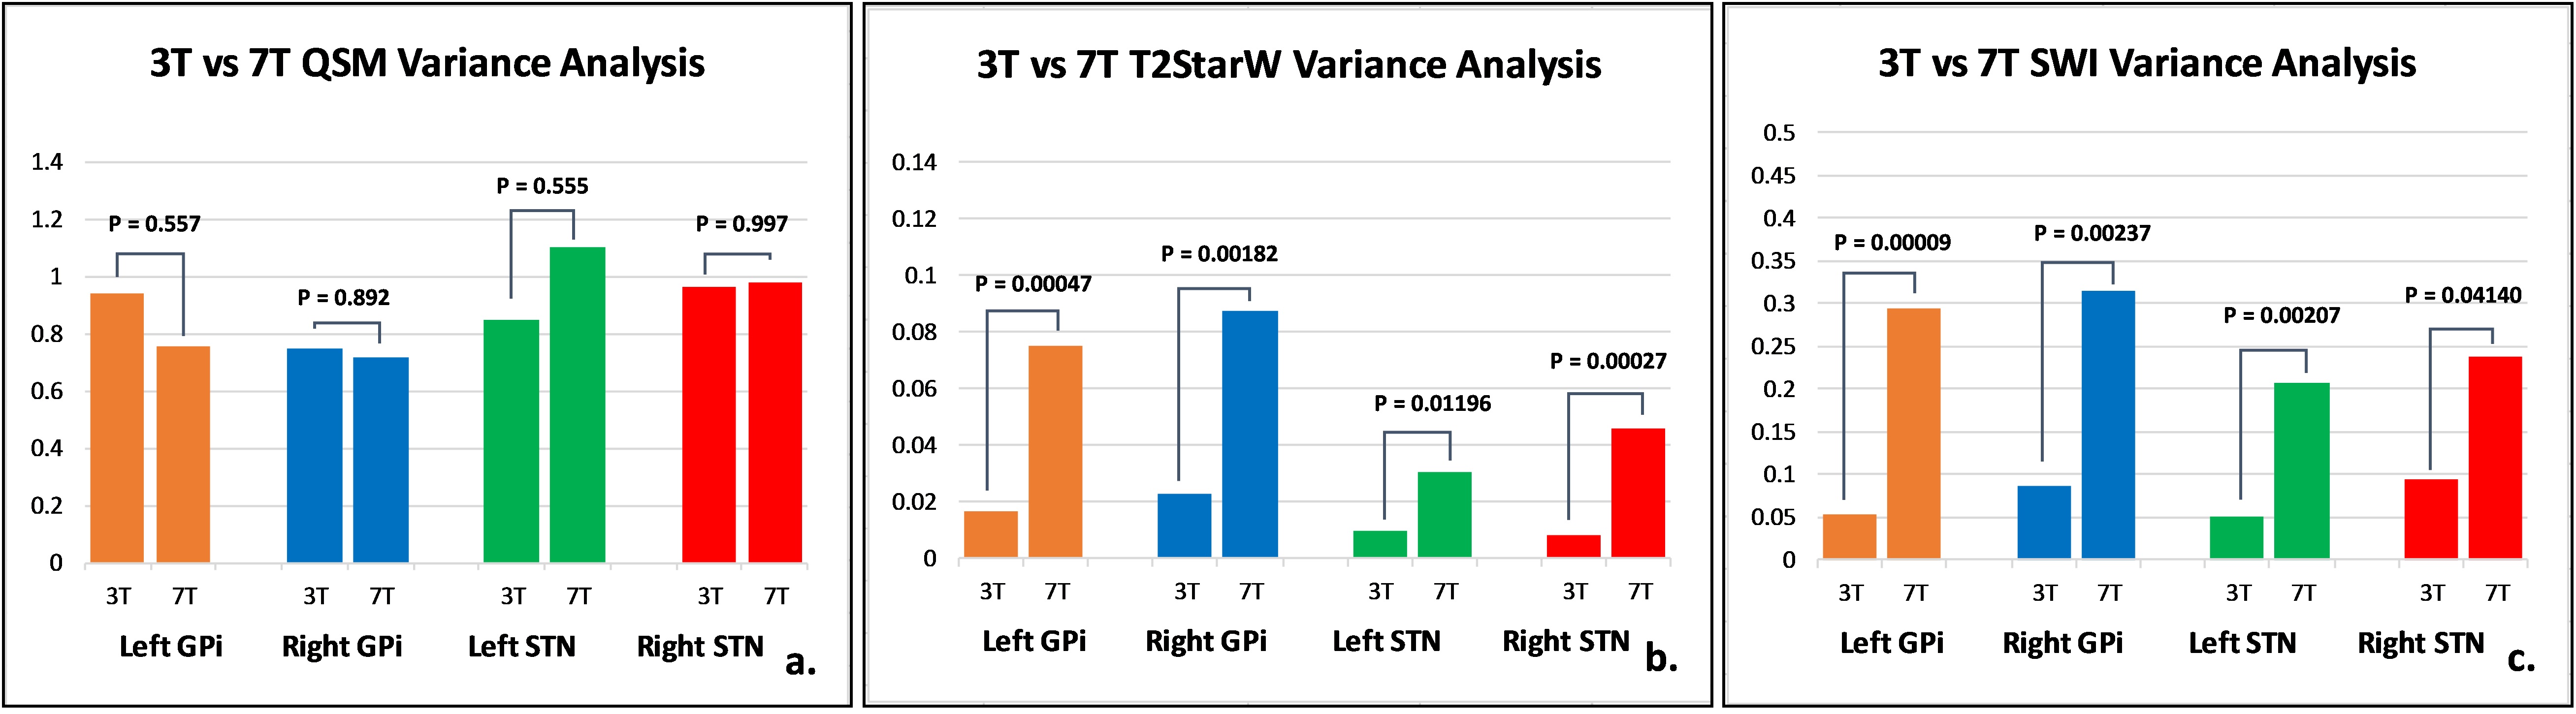
A representative coronal slice covering GPi, GPe and STN was chosen to display the QSM, T2*-weighted and SWI images at 3T (Figure 2) and 7T (Figure 3). Enhanced T2* and SWI images were observed at 7T, compared with the ones at 3T. Compared with T2* (Figure 2b & 3b) and SWI (Figure 2c & 3c), QSM (Figure 2a & 3a) displayed an excellent local anatomical structure in the deep gray matter nuclei. Especially, obvious improvement of depicting putamen, GPe, GPi, STN and SN was obtained from QSM at both 3T and 7T. The boundary between GPi and GPe, STN and substantia nigra (SN) can be clearly seen with QSM (Figure 2a & 3a). The normalized signal intensity profile along each line is also shown in Figure 2e-h & 3e-h. A clear dip (Arrows in Figure 2e&f, 3e&f) between the GPi and GPe can be observed from the signal profile with QSM, which indicates that GPi and GPe can be clearly discriminated. Stronger contrast between STN and SN was also observed from the signal profile in QSM. Figure 4 shows the the comparison of the contrast variance. QSM showed significant contrast compared with T2* weighted and SWI data. Figure 5 shows the comparison of the contrast variance between 3T and 7T. The T2* weighted and SWI methods showed enhanced contrast at 7T due to the increased T2* weighting and local phase difference (Figure 5 b&c). However, no significant difference was detected in QSM between 3T and 7T (Figure 5a).Discussion and Conclusion
Our works demonstrated QSM offered better structural delineation of the STN and GP, compared with the T2* and SWI methods. In particular, QSM enables distinct division of the GP into GPi and GPe with strong contrast. Although T2* and SWI with enhanced contrast was obtained at 7T, it’s still hard to depict the clear structural details for GPi and STN. Compared to QSM at 3T, QSM at 7T had the same contrast variance but could provides improved visualization of deep gray matter cortex with sharper boundaries between local regions because of the improved spatial resolution. Therefore, 7T QSM may provide a useful imaging tool for localizing nucleus sub-regions, including imaging GPi and STN, and bring the benefits for DBS nucleus preoperative localization.Acknowledgements
We thank Jing An (Siemens Shenzhen MR Ltd.) for her technical assistance. This work was supported in part by Chinese MOST grants (2015CB351701, 2012CB825500), NSFC grant (91132302), and CAS grants (XDB02010001, XDB02050001).References
1. https://en.wikipedia.org/wiki/Globus_pallidus.
2. Perlmutter JS, Mink JW. DEEP BRAIN STIMULATION. Annual Review of Neuroscience 2006;29(1):229-257.
3. Liu J, Liu T, de Rochefort L, Ledoux J, Khalidov I, Chen W, Tsiouris AJ, Wisnieff C, Spincemaille P, Prince MR, Wang Y. Morphology enabled dipole inversion for quantitative susceptibility mapping using structural consistency between the magnitude image and the susceptibility map. NeuroImage 2012;59(3):2560-2568.
4. Haacke EM, Xu Y, Cheng YC, Reichenbach JR. Susceptibility weighted imaging (SWI). Magnetic resonance in medicine : official journal of the Society of Magnetic Resonance in Medicine / Society of Magnetic Resonance in Medicine 2004;52(3):612-618.
Figures