1959
Effects of Spatial Resolution on Quantitative Susceptibility Mapping1Radiology, University of Wisconsin, Madison, WI, United States, 2Medical Physics, University of Wisconsin, Madison, WI, United States, 3Biomedical Engineering, University of Wisconsin, Madison, WI, United States, 4Medicine, University of Wisconsin, Madison, United States, 5Emergency Medicine, University of Wisconsin, Madison, WI, United States
Synopsis
The purpose of this study was to investigate the effects of spatial resolution on the performance of quantitative susceptibility mapping (QSM). The combination of magnitude contrast in spoiled gradient echo images and the voxel sensitivity function can create significant errors in the estimated B0 field map. This work evaluated the use of proton density weighted imaging and joint R2* and field map estimation to reduce the impact of imaging resolution on QSM. Our results indicate that reducing magnitude contrast in the complex-valued echo images will reduce errors in the field map estimates and, thus, the susceptibility estimates in QSM.
Introduction
MR-based quantitative susceptibility mapping (QSM) techniques have multiple potential applications in brain1 and body imaging2. QSM techniques acquire multiple echo time images to enable B0 field map estimation, and use the B0 field map to estimate the underlying susceptibility distribution. A recent study characterized different imaging parameters, including magnitude contrast and spatial resolution, and demonstrated susceptibility underestimation for large magnitude contrast and large voxel sizes. However, techniques to reduce this underestimation have not been investigated. Therefore, the purpose of this study was to investigate the effects of magnitude contrast and reformulate the QSM estimation problem to include joint R2* and field map estimation in order to reduce the impact of imaging resolution on the performance of QSM.Theory
The effect of magnitude contrast and resolution can be demonstrated with a signal model for a voxel of a given size, based on the spoiled gradient echo (SGRE) signal at a given position ($$$r_0$$$) and echo time ($$$t$$$) as:$$s(\vec{r}_0,t)=\int{\rho(\vec{r})S_0\bigl(T_1(\vec{r}\bigr),\alpha)e^{-R_2^*(\vec{r})t}}e^{i2\pi\psi(\vec{r})t}VSF(\vec{r}-r_0)d\vec{r}\quad[1]$$where$$$\space\rho\space$$$is the proton density,$$$\space{}S_0\space$$$is the SGRE signal equation4 that varies with$$$\space{}T_1\space$$$ and flip angle$$$\space\alpha\space$$$, $$$\psi\space$$$is the field map, and$$$\space{}VSF\space$$$is the voxel sensitivity function (VSF) corresponding to the size of the voxel4. The leading magnitude terms in this expression$$$\space\bigl(\rho(\vec{r})S_0\bigl(T_1(\vec{r}\bigr),\alpha)e^{-R_2^*(\vec{r})t}\bigr)\space$$$enable spatially distant points with high magnitude to have a larger impact on the resulting complex-valued signal, than with the VSF alone. Increasing the magnitude contrast has been shown to increase QSM underestimation3. Therefore, we propose a technique to reduce the effect of magnitude contrast.
We can minimize the amplitude term in Eq. [1] by performing proton density weighted imaging instead of T1 weighted imaging, eg: utilizing small flip angles to eliminate$$$\space{}S_0\space$$$in Eq [1]. Assuming that the proton density is homogeneous in the object then we can rewrite the signal model as:
$$s(\vec{r}_0,t)\approx\int{\rho e^{i2\pi\psi^\prime(\vec{r})t}VSF(\vec{r}-r_0)d\vec{r}}\quad[2]$$
where
$$\psi^\prime(\vec{r})=\psi(\vec{r})+i\frac{R_2^*(\vec{r})}{2\pi},\quad[3]$$
and the proton density is approximated by a scalar. Estimating this complex-valued field map ($$$\psi^\prime$$$) is equivalent to joint estimation of R2* and the field map, which has the potential to reduce the effects of R2* on field map estimation. In Eq. [2] there is no magnitude weighting as a function of position, which will limit the dominant terms to those in the VSF. This produces a field map more similar to an averaged version of the original field map.
Methods
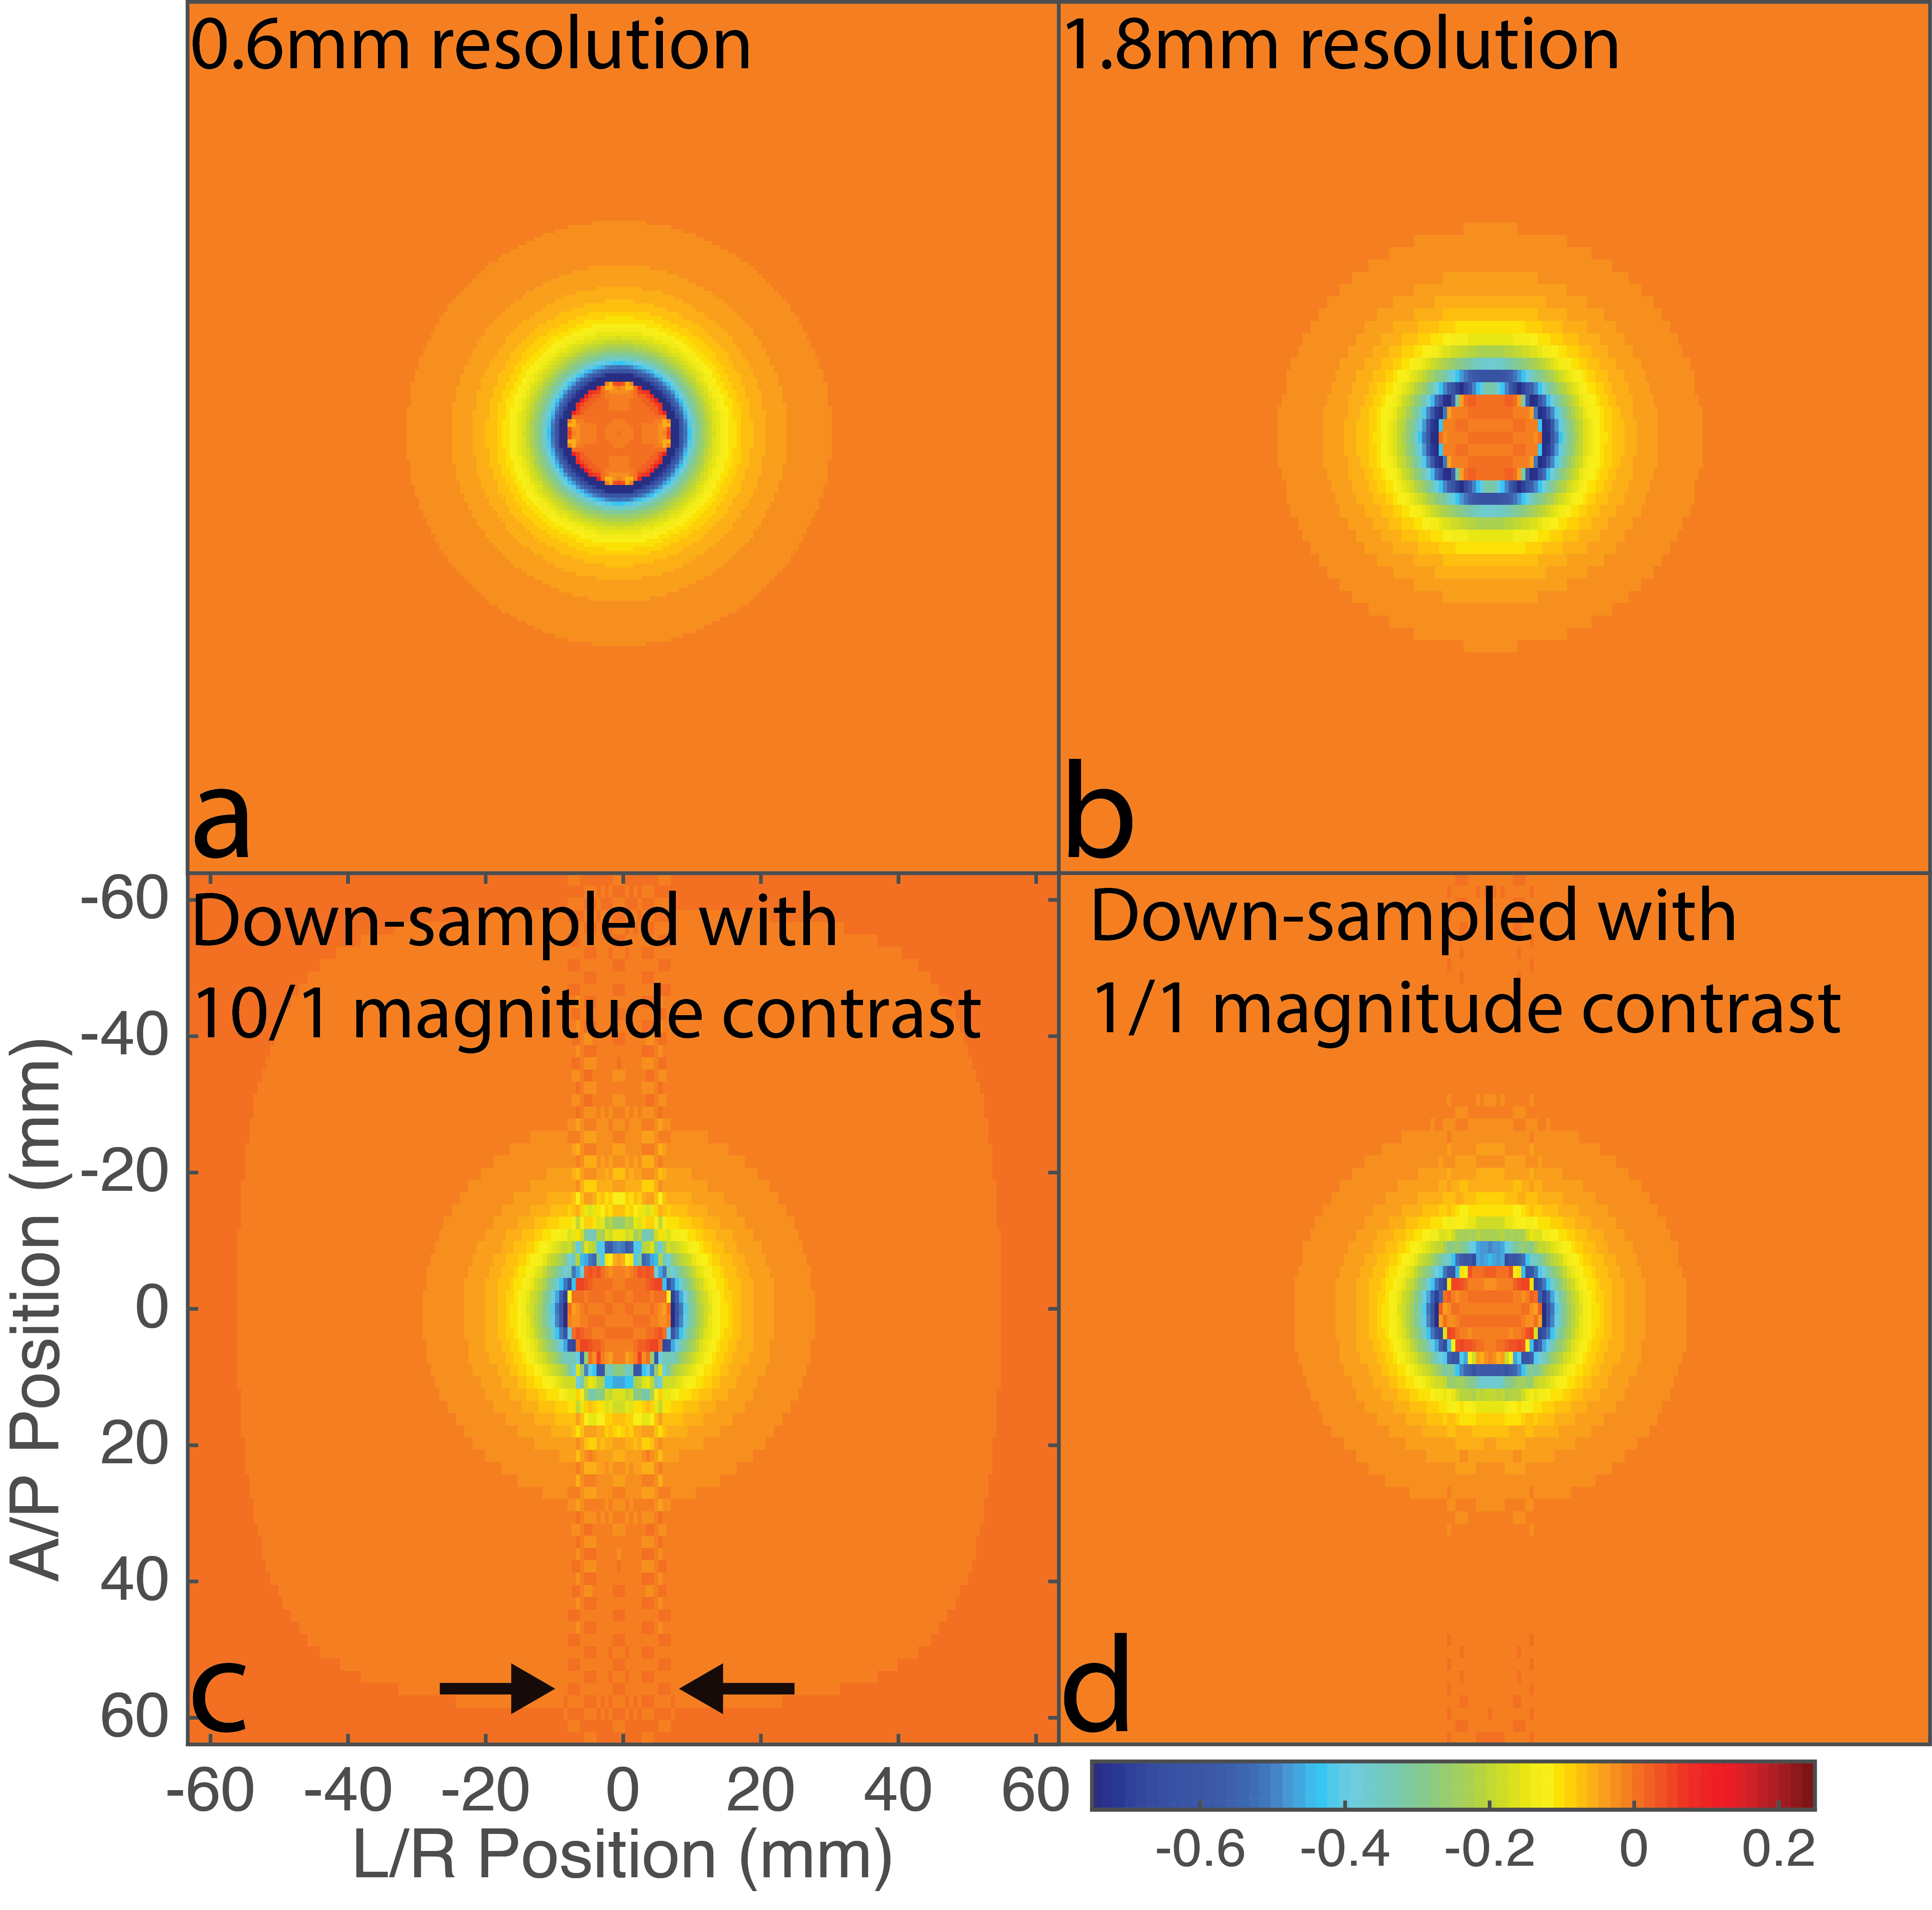
3T simulations were conducted to compare the effects of resolution on B0 field map estimation. The field map for a sphere with radius 7.5mm and homogeneous 4ppm susceptibility was created on an isotropic 0.6mm grid, with no noise and served as our high-resolution B0 field map. No R2* effects are present in this simulation, so its impact on the field map has not been included. Two sets of complex-valued echoes were generated with this field map with two homogeneous regions (object and background), and with a magnitude contrast of 10/1 (sphere/background) and 1/1.
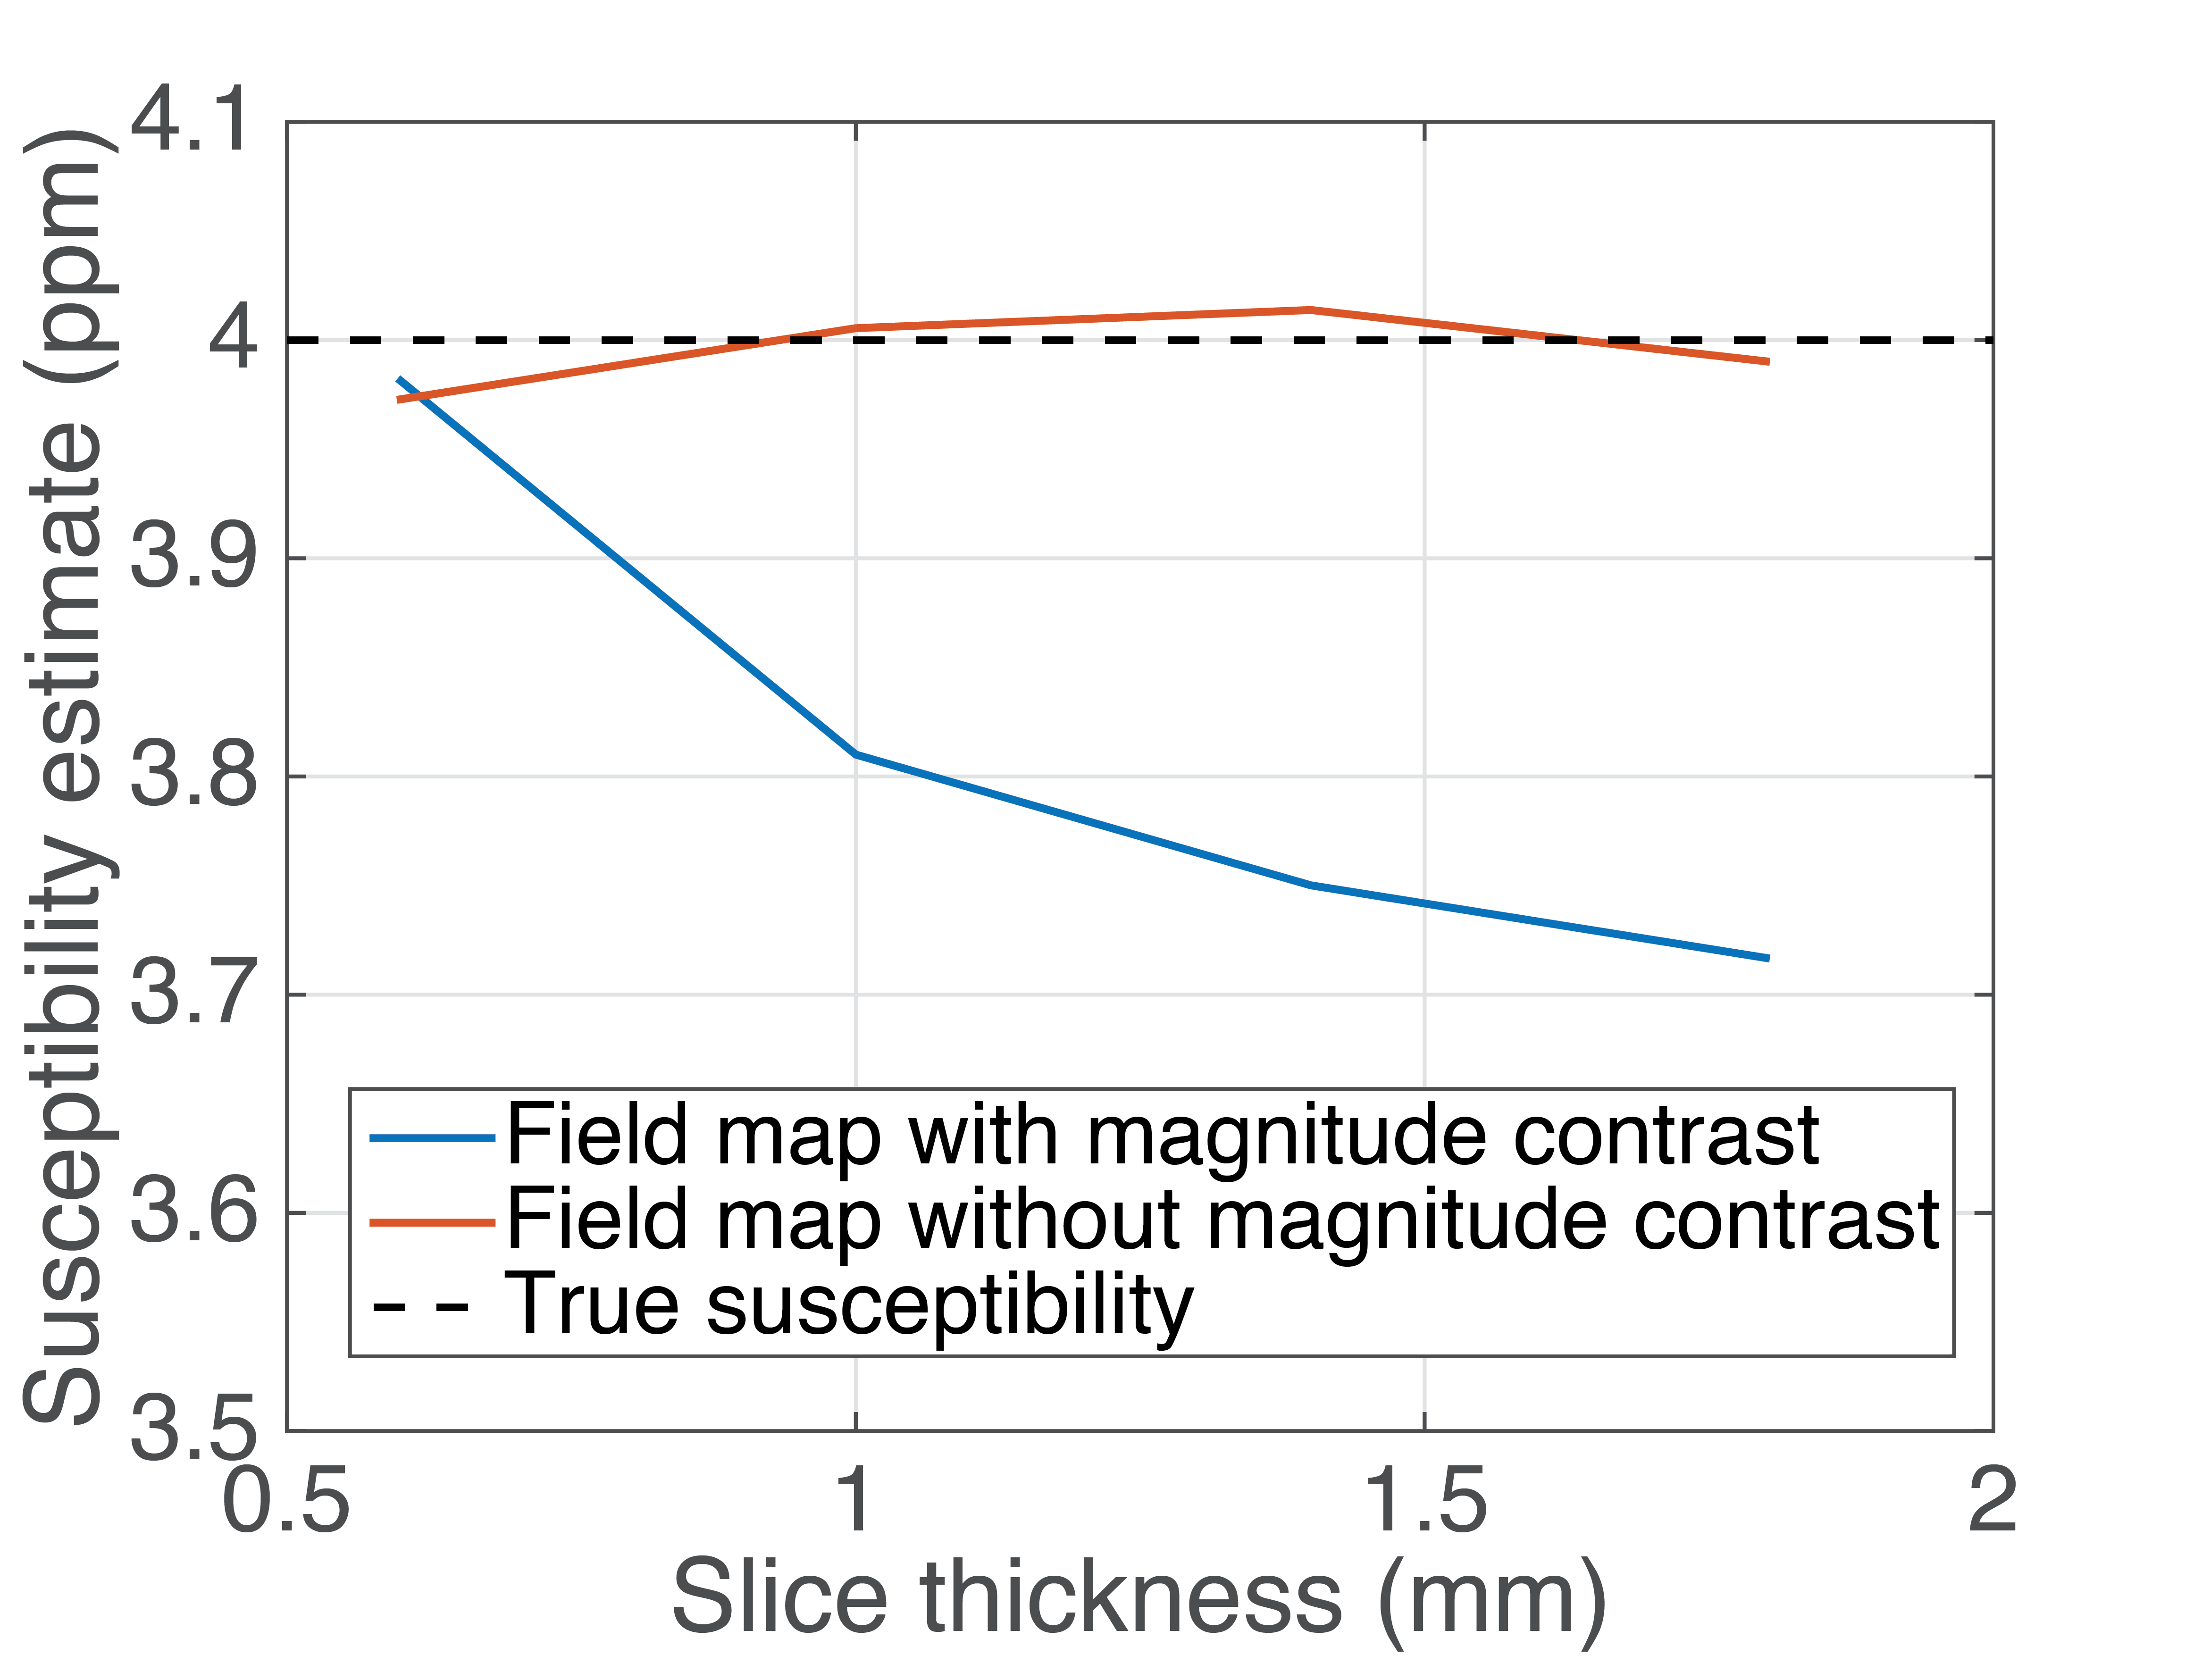
Complex echoes were down-sampled in only the slice direction to simulate different coronal slice thicknesses (1.0mm, 1.4mm, and 1.8mm) to simulate measurement of the high-resolution B0 field map at a lower resolution. Down-sampling was performed using k-space truncation to emulate the ideal 3D VSF5. The estimated field maps were then used with the Morphology Enabled Diopole Inversion (MEDI) algorithm6 to estimate susceptibility at each slice thickness.
Results
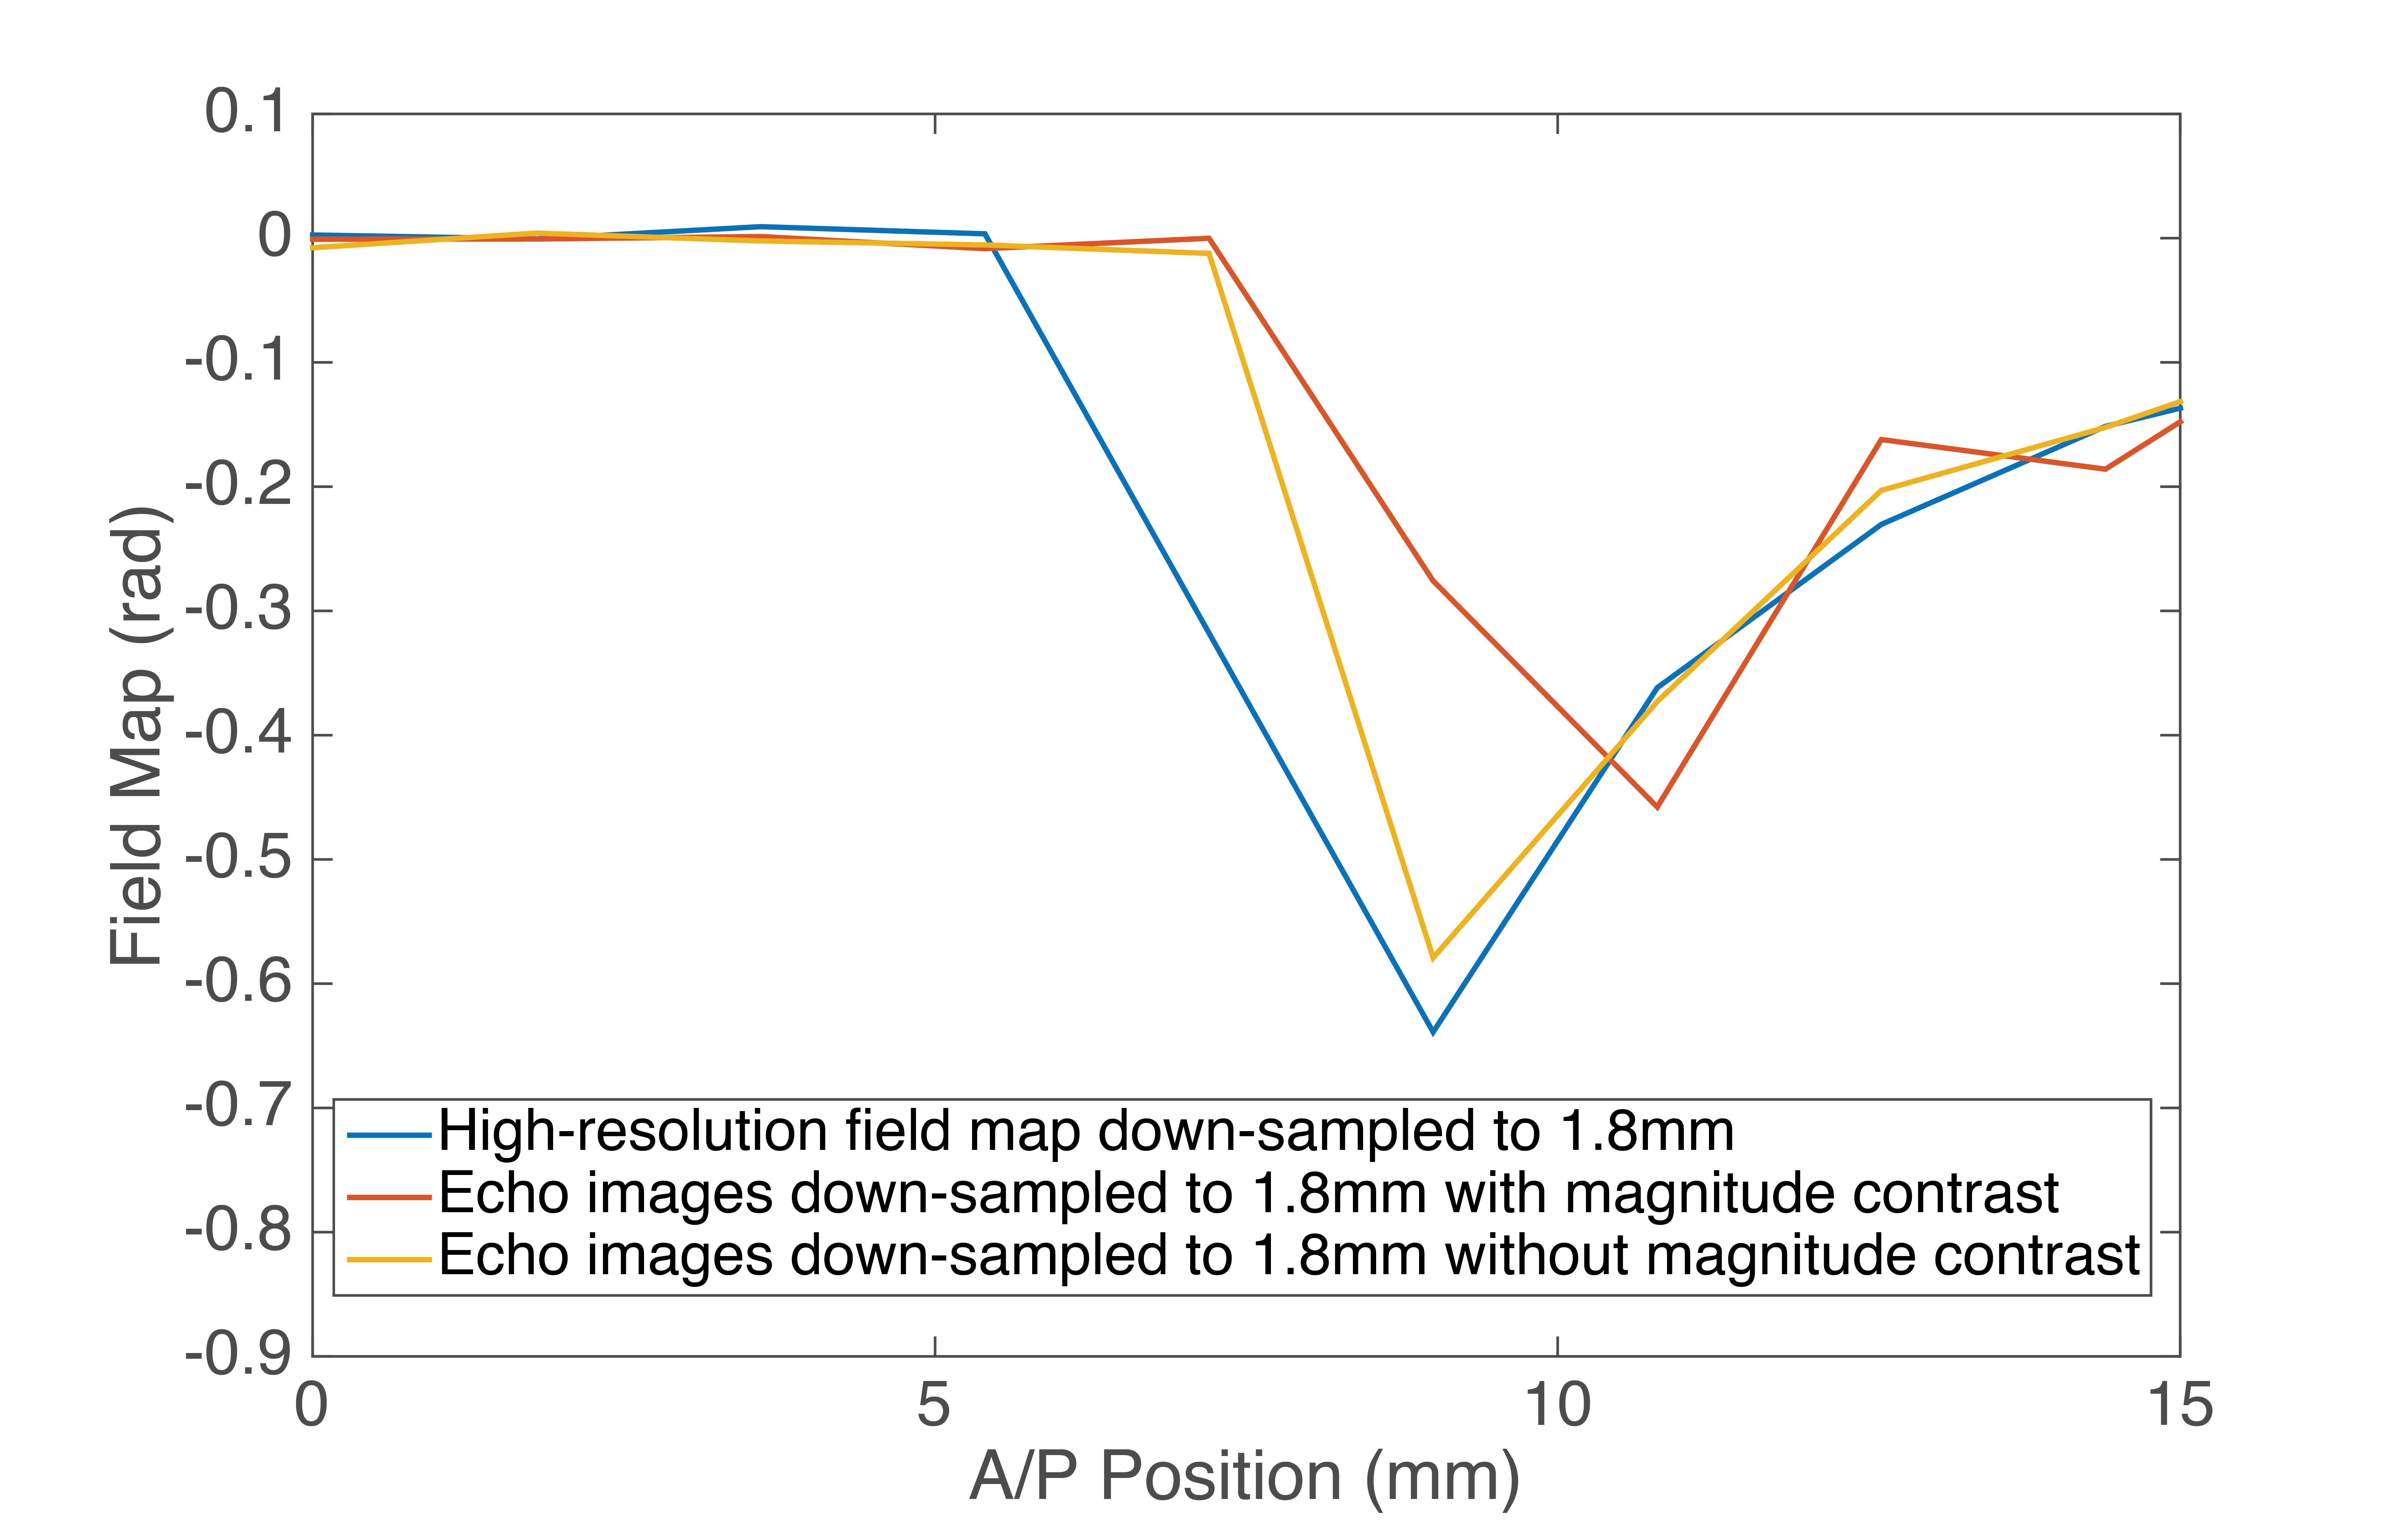
Figure 1 demonstrates that the field map estimated from down-sampling echoes without any magnitude contrast (Figure 1d) is closer to a low-resolution version of the high-resolution field map (Figure 1b) than the field map estimated using echoes with substantial magnitude contrast (Figure 1c). Figure 2 is a plot of an Anterior/Posterior (A/P) line profile through the center of the sphere and highlights the lower peak amplitude and oscillatory behavior in the estimate with magnitude contrast. Figure 3 contains the MEDI susceptibility estimates of the 4ppm spherical inclusion using the down-sampled field maps at different slice thickness.Discussion & Conclusions
The combination of magnitude contrast of spoiled gradient echo images and the VSF for large voxel sizes can lead to significant errors in the estimated field map. In this work we proposed the use of proton density weighting in conjunction with joint estimation of R2* and field map to reduce the impact of magnitude contrast on the resulting field map errors. Our results demonstrate that even though the field map estimated without magnitude contrast is not identical to a low-resolution version of the high-resolution field map, it still reduces the error in susceptibility estimates at low spatial resolutions. Further investigation into the assumptions and performance of this technique are needed, in order to improve the accuracy and reproducibility of QSM across spatial resolutions.Acknowledgements
The authors wish to acknowledge support form the NIH (UL1TR00427, R01 DK083380, R01 DK088925, R01 DK100651, and K24 DK102595), GE Healthcare, and the National Cancer Institute of the National Institutes of Health under Award Number T32CA009206.References
1. Schweser F, Deistung A, Lehr B, Reichenbach J, Quantitative imaging of intrinsic magnetic tissue properties using MRI signal phase: an approach to in vivo brain iron metabolism?, Neuroimag 2011;54:2789-807.
2. Sharma S, Hernando D, Horng D, Reeder S, Quantitative susceptibility mapping in the abdomen as an imaging biomarker of hepatic iron overload, Magn Reson Med 2014;74:673-683.
3. Zhou D, Cho Junghun, Zhang J, Spincemaille P, Wang Y, Susceptibility Underestimation in a High-Susceptibility Phantom: Dependence on Imaging Resolution, Magnitude Contrast, and Other Parameters, Magn Reson Med 2016; DOI 10.1002/mrm.26475
4. Haacke M, Brown R, Thompson M, Venkatesan R, Magnetic resonance imaging: physical principles and sequence design. New York: Wiley-Liss; 1999.
5. Parker D, Du Y, Davis W, The Voxel Sensitivity Function in Fourier Transform Imaging: Applications to Magnetic Resonance Angiography, Magn Reson Med 1995;33:156-162.
6. Liu J, Liu T, de Rochefort L, Ledoux J, Khalidov I, Chen W, Tsiouris A, Wisnieff C, Spincemaille P, Prince M, Wang Y, Morphology enabled dipole inversion for quantitative susceptibility mapping using structural consistency between the magnitude image and the susceptibility map, Neuroimag 2012;59:2560-2568.
Figures