1958
Incorporating macroscale susceptibility in QSM reconstruction with 3D spiral acquisition.1Bioengineering, University of Illinois at Urbana-Champaign, Urbana, IL, United States, 2Beckman Institute, University of Illinois at Urbana-Champaign, Urbana, IL, United States, 3Martinos Center for Biomedical Imaging, Department of Radiology, Massachusetts General Hospital, Charlestown, MA, United States, 4Harvard Medical School, Boston, MA, United States, 5Boston Children’s Hospital, Boston, MA, United States
Synopsis
Macroscale magnetic susceptibility creates large variations in the phase images preventing the direct analysis of local tissue-dependent phase in quantitative susceptibility mapping. Unwrapping and background field removal are important steps for calculating tissue phases and susceptibility maps. In this work, a 3D spiral acquisition is combined with an image reconstruction pipeline modelling the macroscale magnetic susceptibility to provide more accurate tissue phases and susceptibility maps, by reducing image distortions and facilitating unwrapping and background phase removal.
Introduction
Quantitative susceptibility mapping (QSM) uses the phase information to estimate the tissue magnetic susceptibility. QSM has a broad range of applications, including quantifying iron content, measuring venous oxygenation and enhancing contrast-to-noise ratio [1].
For single echo QSM acquisitions, macroscale magnetic susceptibility effects, due to air/tissue interfaces around the brain, cause significant phase in the image. This phase variation is large, leading to many phase wraps in long echo time acquisitions required for optimal contrast. Standard processing routines must unwrap this phase and apply high pass filtering to remove the background component and retain the tissue-dependent phase [2]–[4]. However, the phase and the image distortions due to macroscale susceptibility can be corrected if the magnetic field distribution is known by using a model-based reconstruction algorithm [5].
In this work, a model-based reconstruction combined with a spiral acquisition is investigated to improve the background phase removal for QSM. A spiral acquisition was chosen allowing shorter acquisition time and higher SNR efficiency compared to Cartesian sampling [6]. Moreover, a compressed-sensing (CS) dipole inversion algorithm using alternating direction method of multipliers (ADMM) is also presented. We demonstrate that measuring, modeling, and removing the macroscale susceptibility effects can lead to more robust and accurate QSM results.
Method
All experiments were conducted on a 3 T Trio scanner (Siemens, Erlangen, Germany) with a 32 channel head coil. A 3D stack-of-spirals, spiral-out GRE sequence was used with the following parameters: TE=40 ms; TR=1.2 s; flip angle: 60°; voxel size: 1x1x1 mm3; FOV 24 cm; 16 shots per kz plane with a parallel imaging reduction factor of 2 (acquisition time: 19.2 min).
Another data set was acquired with the same parameters, except with a TR of 320 ms and a flip angle of 40°, reducing the acquisition time to 5.12 min.
Images for the coil sensitivity map and field map estimation were acquired with a 2D asymmetric spin echo sequence: TE=18/19/20/21/22 ms; TR=50 ms; flip angle: 90°; voxel size: 2x2x2 mm3; FOV 24 cm; 12 shots fully sampled (acquisition time: 3 min).
The field map was obtained using a regularized least square formulation [7]. GRE images were reconstructed with SENSE and corrected for magnetic field inhomogeneity as in [5]. Phase images were first unwrapped with FSL PRELUDE [8]. Background field removal was performed with SHARP [3]. Susceptibility weighted images (SWI) and maximum intensity projection (MIP) of SWI were also calculated. Finally, susceptibility maps were estimated with the proposed CS inversion algorithm as detailed below.
Dipole inversion with Wavelet and Total Variation (WTV) uses the CS compensated formulation in [9] and accelerates the reconstruction using ADMM formalism, solving:
$$ min_χ||MFχ - k||_2^2 + α \cdot ||W_χ||_1 + β \cdot TV(χ) $$
M is a mask indicating the k-space region where the dipole kernel D can be inverted, F is the discrete Fourier transform, χ is the unknown susceptibility distribution, W and TV are wavelet and TV penalties. k is trusted data in k-space given by $$$k = MD^{-1}FΦ$$$ with Φ the tissue phase. The trust region was selected by thresholding $$$|D| > t$$$, and α, β, t were selected to minimize the RMSE in the QSM Reconstruction Challenge data. Variable splitting was used to divide objective into simpler subproblems, all of which were solved in closed-form.
SWI, MIP of SWI and susceptibility maps obtained from images with and without magnetic field correction were compared.
Results
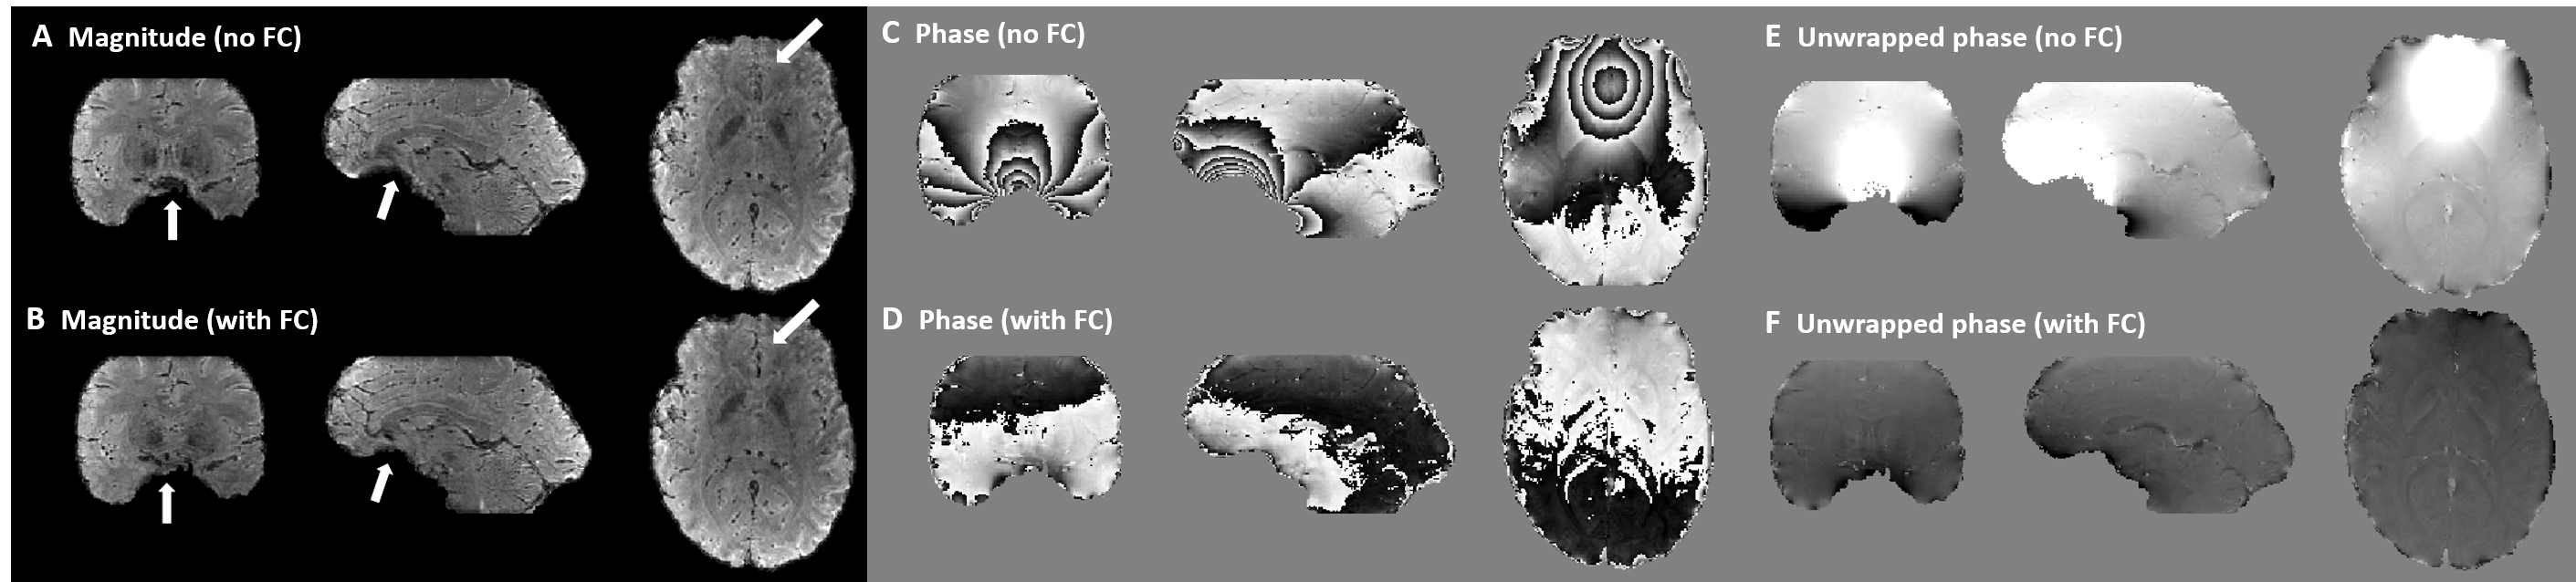
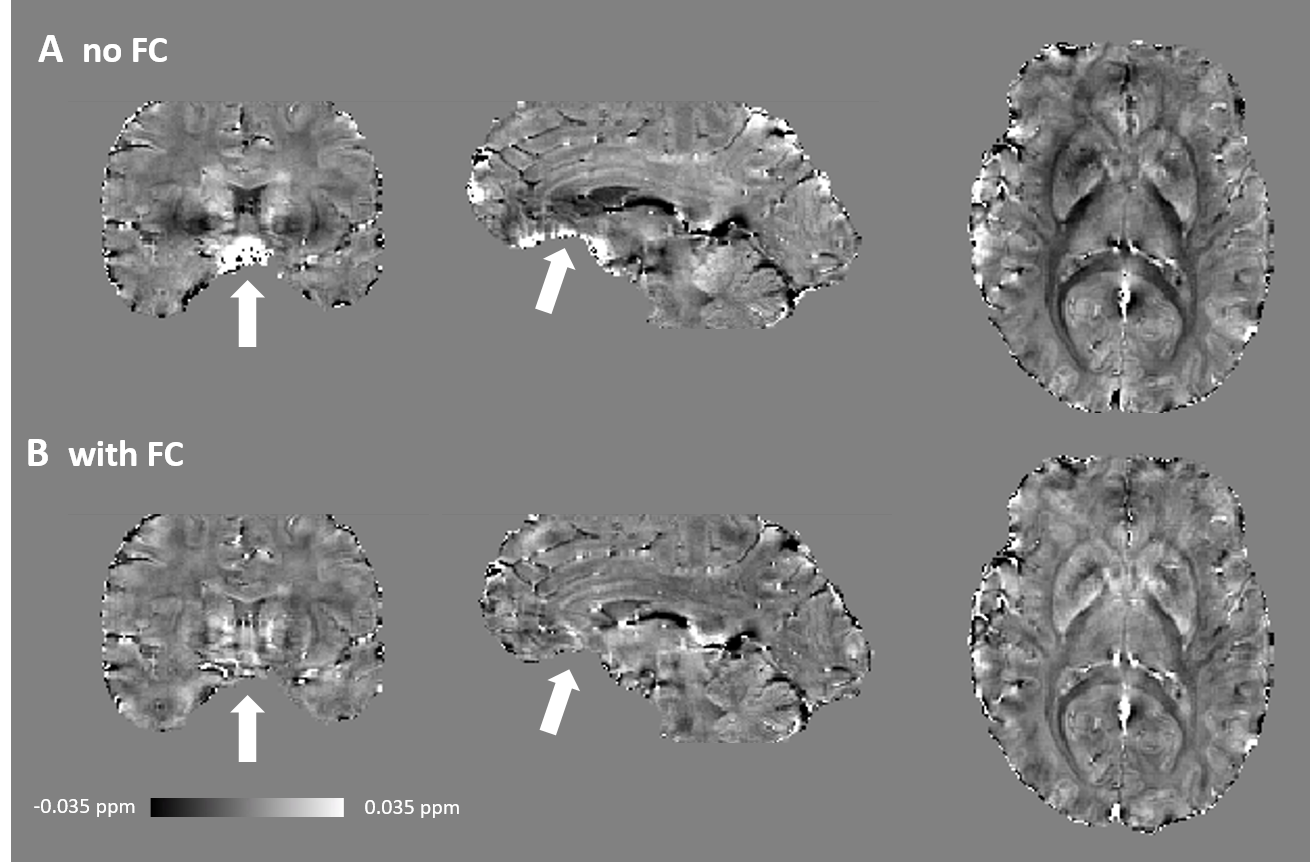
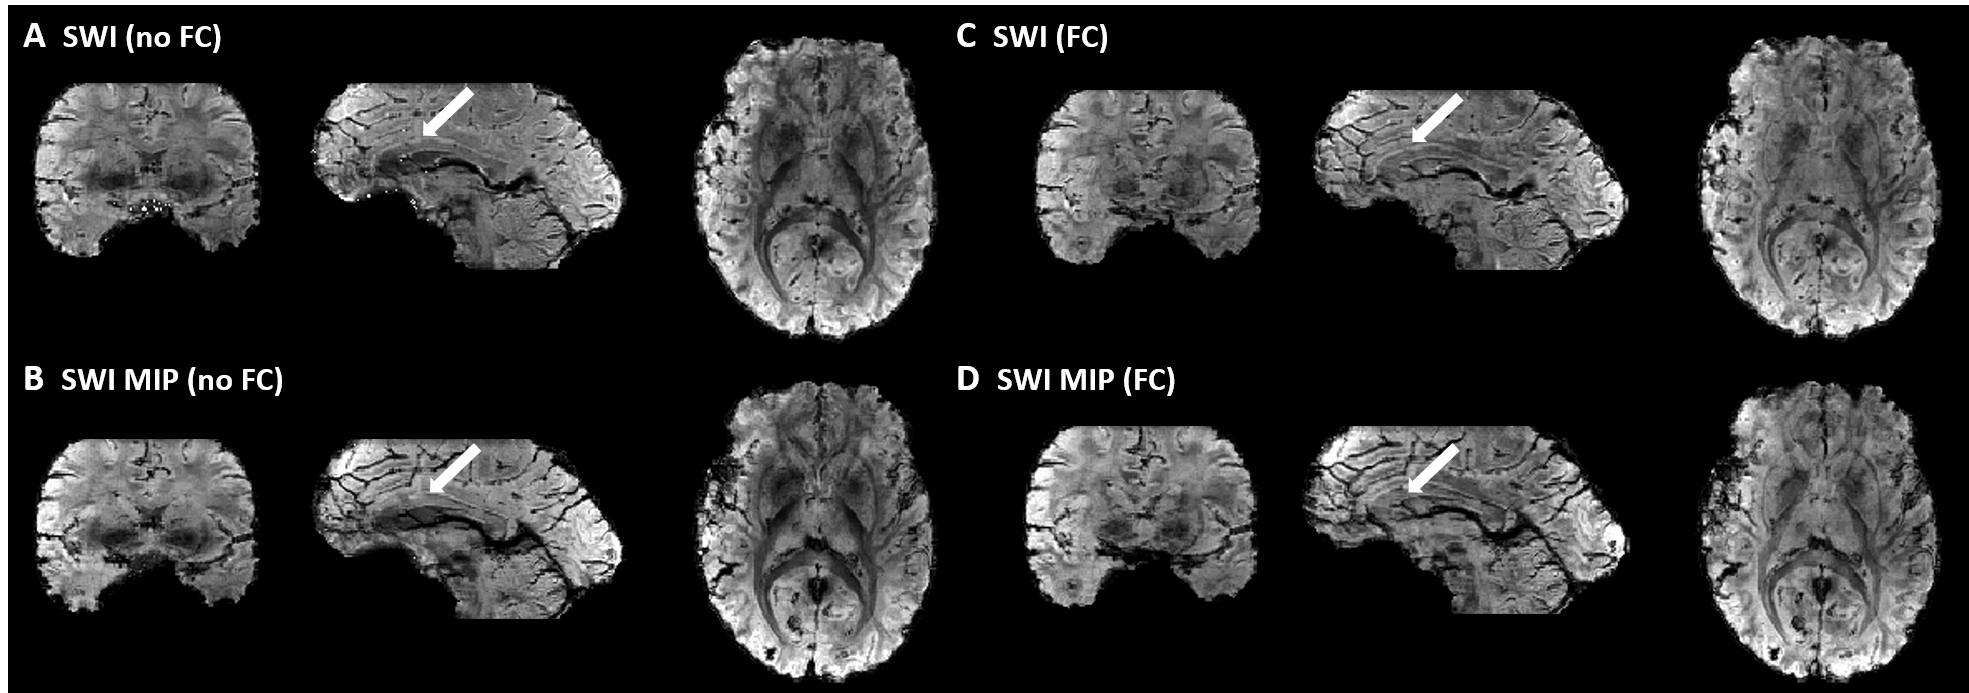
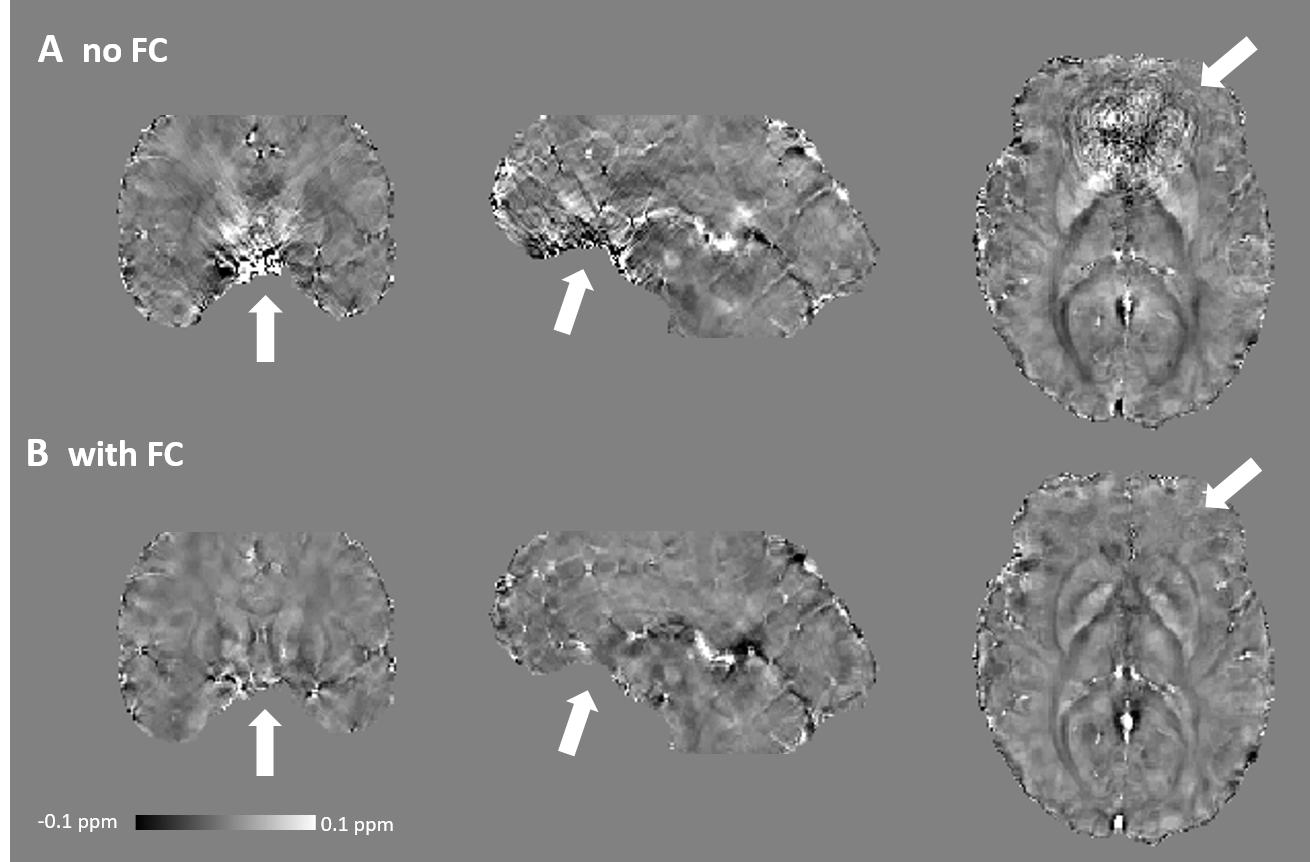
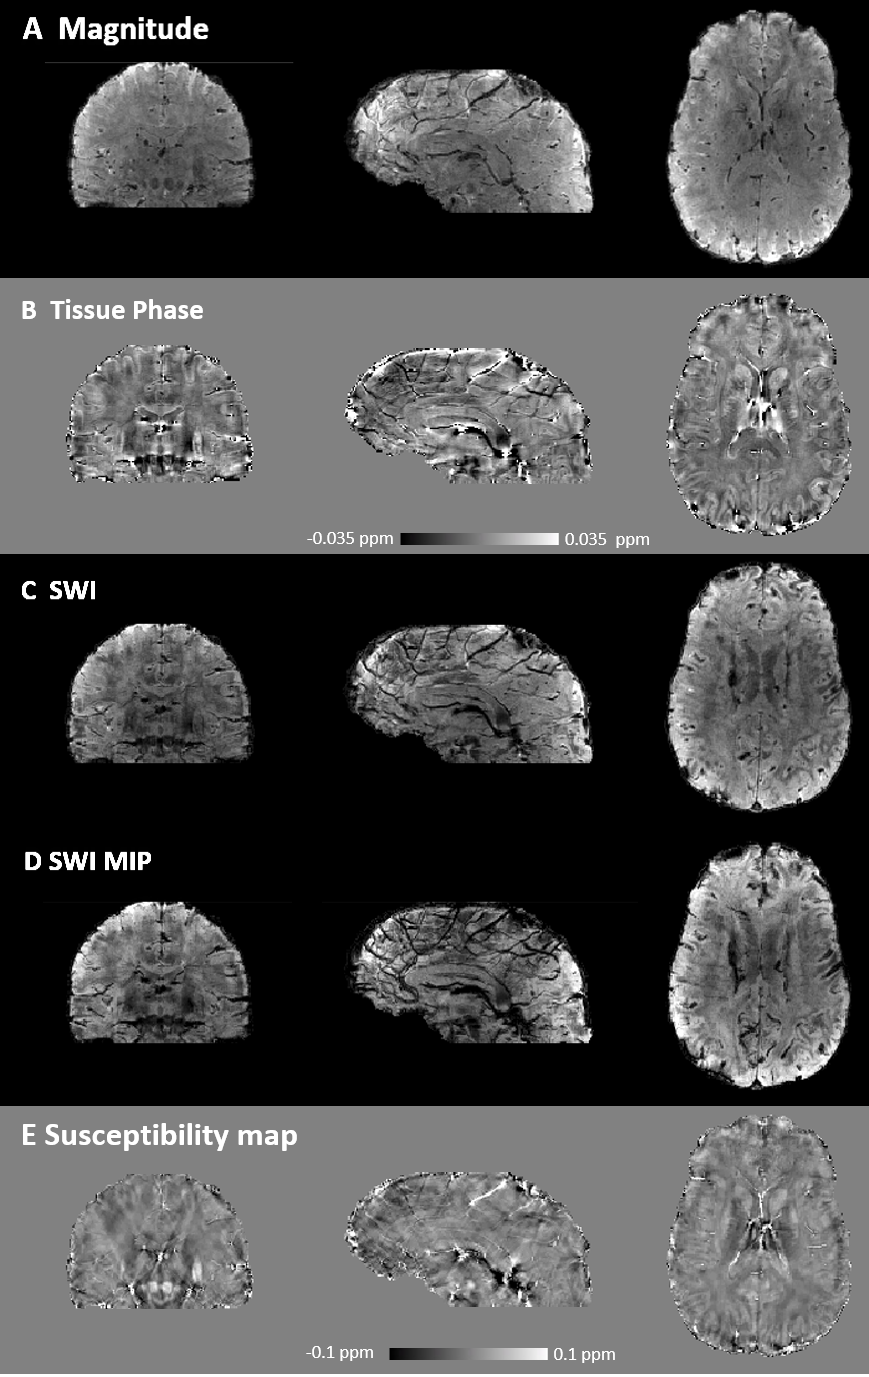
Figure 1 shows the magnitude, raw and unwrapped phase of the images reconstructed without and with magnetic field correction. Image distortions due to magnetic susceptibility are reduced with field correction. Moreover, the raw phase show less wraps and the main variations in the background phase are removed, such that local tissue-induced phase differences can be seen in the unwrapped phase. Figure 2 shows the tissue phase for non-field corrected and field corrected images. Residuals remains in the non-field corrected tissue phase leading to errors in SWI and SWI MIP as seen in Figure 3 and in the susceptibility maps in Figure 4. Figure 5 shows we could achieve images with a good SNR while considerably reducing the acquisition time.Discussion and Conclusion
By measuring the macroscale magnetic susceptibility effects due to air/tissue interfaces and combining this information with a model-based reconstruction, unwrapping and background phase removal are facilitated for SWI and QSM. In addition, more accurate maps are obtained since residuals in the background phase are removed avoiding propagating errors in the quantitative maps. Image distortions are also corrected, leading to sharper details in SWI. Using this framework, QSM with long echo time acquisition can be facilitated.Acknowledgements
No acknowledgement found.References
[1] E. M. Haacke, S. Liu, S. Buch, W. Zheng, D. Wu, and Y. Ye, Quantitative susceptibility mapping: current status and future directions, Magn. Reson. Imaging 2015;33:1–25
[2] E. M. Haacke, Y. Xu, Y.-C. N. Cheng, and J. R. Reichenbach, Susceptibility weighted imaging (SWI), Magn. Reson. Med. 2004;52:612–618.
[3] F. Schweser, A. Deistung, B. W. Lehr, and J. R. Reichenbach, Quantitative imaging of intrinsic magnetic tissue properties using MRI signal phase: An approach to in vivo brain iron metabolism?, NeuroImage 2011;54:2789–2807.
[4] T. Liu et al., A novel background field removal method for MRI using projection onto dipole fields (PDF), NMR Biomed. 2011;24:1129–1136.
[5] B. P. Sutton, D. C. Noll, and J. A. Fessler, Fast, iterative image reconstruction for MRI in the presence of field inhomogeneities, IEEE Trans. Med. Imaging 2003;22:178–188.
[6] B. Wu, W. Li, A. V. Avram, S.-M. Gho, and C. Liu, Fast and tissue-optimized mapping of magnetic susceptibility and T2* with multi-echo and multi-shot spirals, NeuroImage 2012;59:297–305.
[7] A. K. Funai, J. A. Fessler, D. T. B. Yeo, V. T. Olafsson, and D. C. Noll, Regularized field map estimation in MRI, IEEE Trans. Med. Imaging 2008;27:1484–1494.
[8] M. Jenkinson, Fast, automated, N-dimensional phase-unwrapping algorithm, Magn. Reson. Med. 2003;49:193–197.
[9] B. Wu, W. Li, A. Guidon, and C. Liu, Whole brain susceptibility mapping using compressed sensing, Magn. Reson. Med. 2012;67:137–147.
Figures