1956
A Robust 3D Phase Unwrapping Method with Application to Quantitative Susceptibility Mapping1School of Automation Engineering, University of Electronic Science and Technology of China, Chengdu, People's Republic of China, 2Guangdong Provincial Key Laborary of Medical Image Processing, School of Biomedical Engineering, Southern Medical University, Guangzhou, People's Republic of China, 3Philips Healthcare, Guangzhou, People's Republic of China
Synopsis
In susceptibility-weighted imaging and quantitative susceptibility mapping, phase unwrapping methods are generally needed to restore the underlying true phase from the principal period (-π, π]. However, current phase unwrapping algorithms are challenged by noise, rapid phase changes and open-end cutlines. In this paper, a 2D phase unwrapping method based on pixel clustering and local surface fitting (CLOSE) was extended to 3D. The simulation and in vivo data is used to test the performance of the proposed method, with a comparison to a region growing method and PRELUDE, which are widely used for human brain phase-related imaging. The proposed method is demonstrated that can accurately unwrap 3D phase data even in the presence of severe noise, rapid phase changes, and open-end cutlines, and will benefit phase-related 3D MRI applications.
Target Audience:
Researchers who are interested in phase unwrapping and susceptibility imaging.Purpose:
In susceptibility-weighted imaging [1] and quantitative susceptibility mapping (QSM) [2], phase unwrapping methods are generally performed to restore the underlying true phase. However, current phase unwrapping algorithms are challenged by noise, rapid phase changes and open-end cutlines. Recently, a 2D phase unwrapping method based on pixel clustering and local surface fitting (CLOSE) was demonstrated able to accurately and robustly unwrap phase in the presence severe noise, rapid phase changes and disconnected regions [3]. This work aims to extend CLOSE from 2D to 3D, and investigate its application in QSM.Methods:
The MR phase map usually varies rapidly but the phasor can vary slowly near wrap regions distant from tissue boundaries. Based on this observation, CLOSE performs phase unwrapping by exploiting different local variation characteristics between the phase and phasor data. CLOSE first classifies pixels into easy-to-unwrap blocks and difficult-to-unwrap residual pixels, and then sequentially performs intra-block, inter-block and residual-pixel phase-unwrapping by a region-growing surface fitting method. The extension of CLOSE from 2D to 3D is straightforward by calculating the local variation characteristics in 3D neighborhood, grouping phase data into 3D blocks and subblocks, and performing 3D surface fitting for phase estimation.
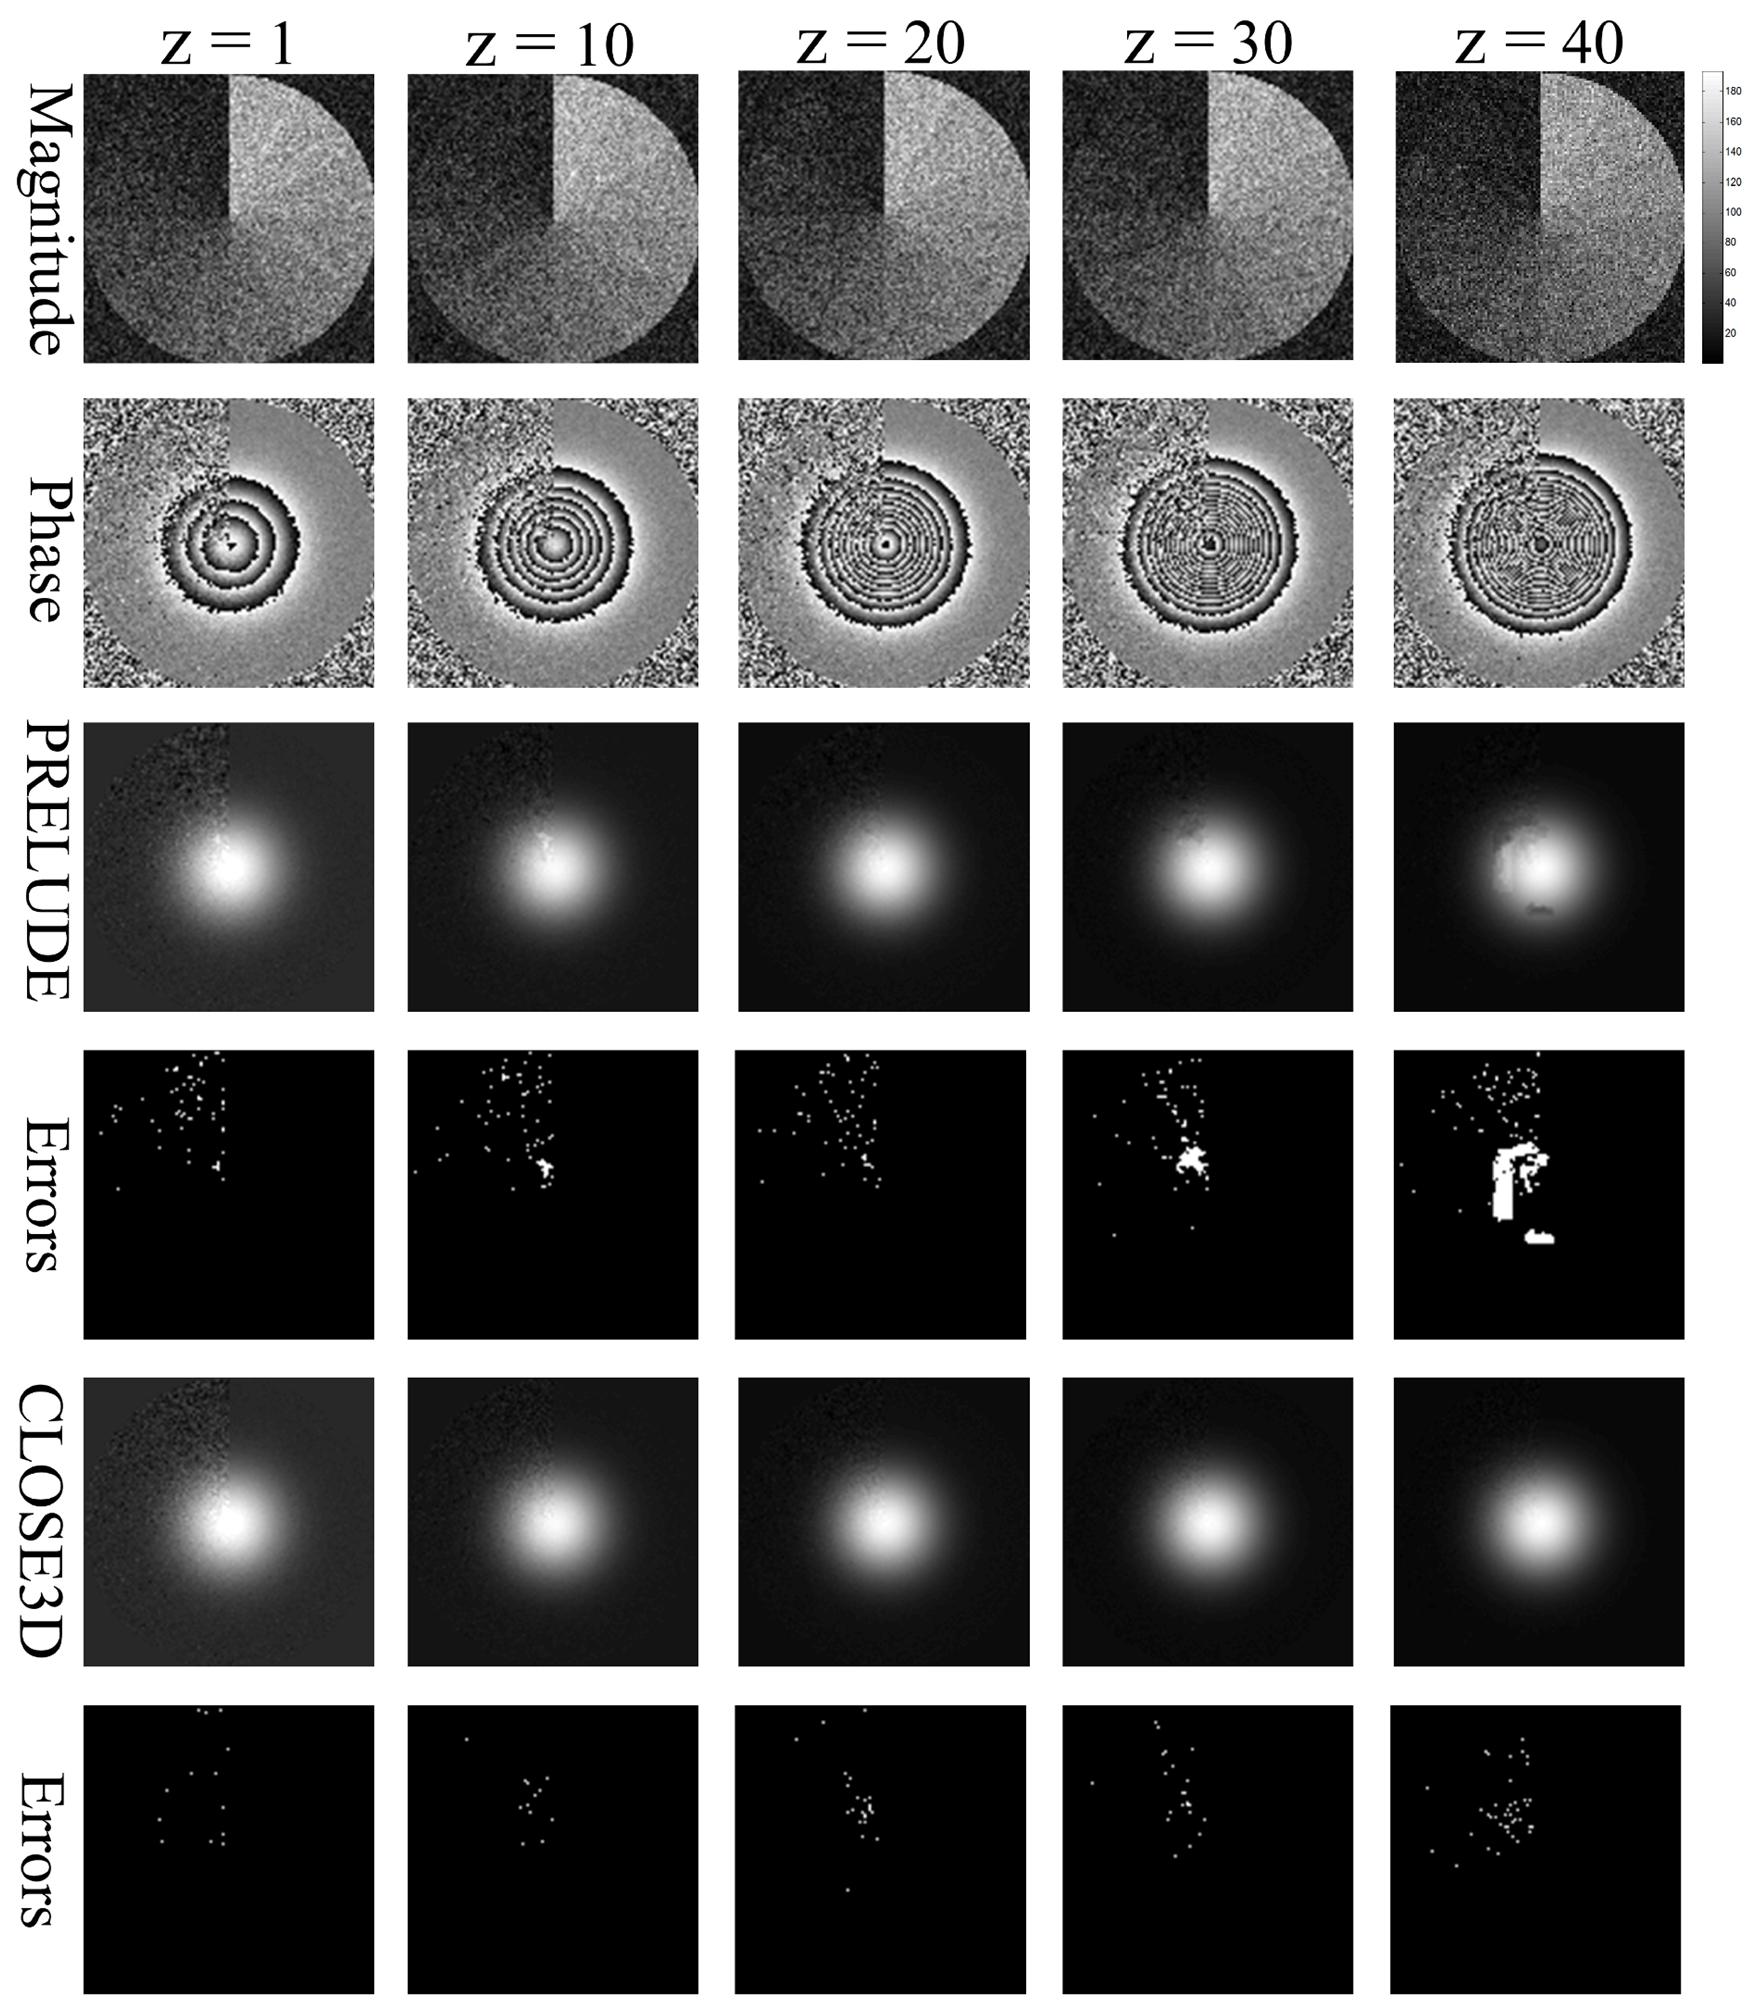
Simulation was implemented to evaluate the performance of CLOSE3D. A Gaussian phase cylinder were generated, the height of the phase is $$$Height = [1+0.1\times (z-1)]\times 20 exp(-(\frac{x-61}{20})^{2}-(\frac{y-61}{20})^{2})$$$. In xoy plane, each sector of the data was π/6 rad wide, and the signal magnitude increased from 10 to 120 in anticlockwise direction. Zero-mean random noise with SD of 20 was added to the real and imaginary parts of the complex image. Therefore, the SNR increased sector by sector with an increment of 0.5 from 0.5 to 6 in xoy plane. Experiments with varying z values were also implemented to demonstrate performance under different phase change levels. CLOSE3D was compared with a region growing (RG) method in the QSM toolbox [6] and the PRELUDE[7] method in FSL [8].
A set of human brain data was acquired on a 3T MRI scanner (Siemens Skyra) using a 3D multiecho gradient echo sequence with FA = 15, FOV = 24 cm, resolution 0.9 × 0.9 × 2 mm3, and echo spacing 5 ms [4]. An addition experiment was implemented with the original phasor map multiplied by 5 to test performance under extremely inhomogeneous field.
Results:
Figure 1 shows the phase unwrapping results on simulated data. PRELUDE results contain severe errors especially at low SNRs and rapid phase changes, while CLOSE3D results contain errors only on a limited number of isolated voxels. CLOSE3D consistently outperforms PRELUDE under varying SNR and phase change levels.
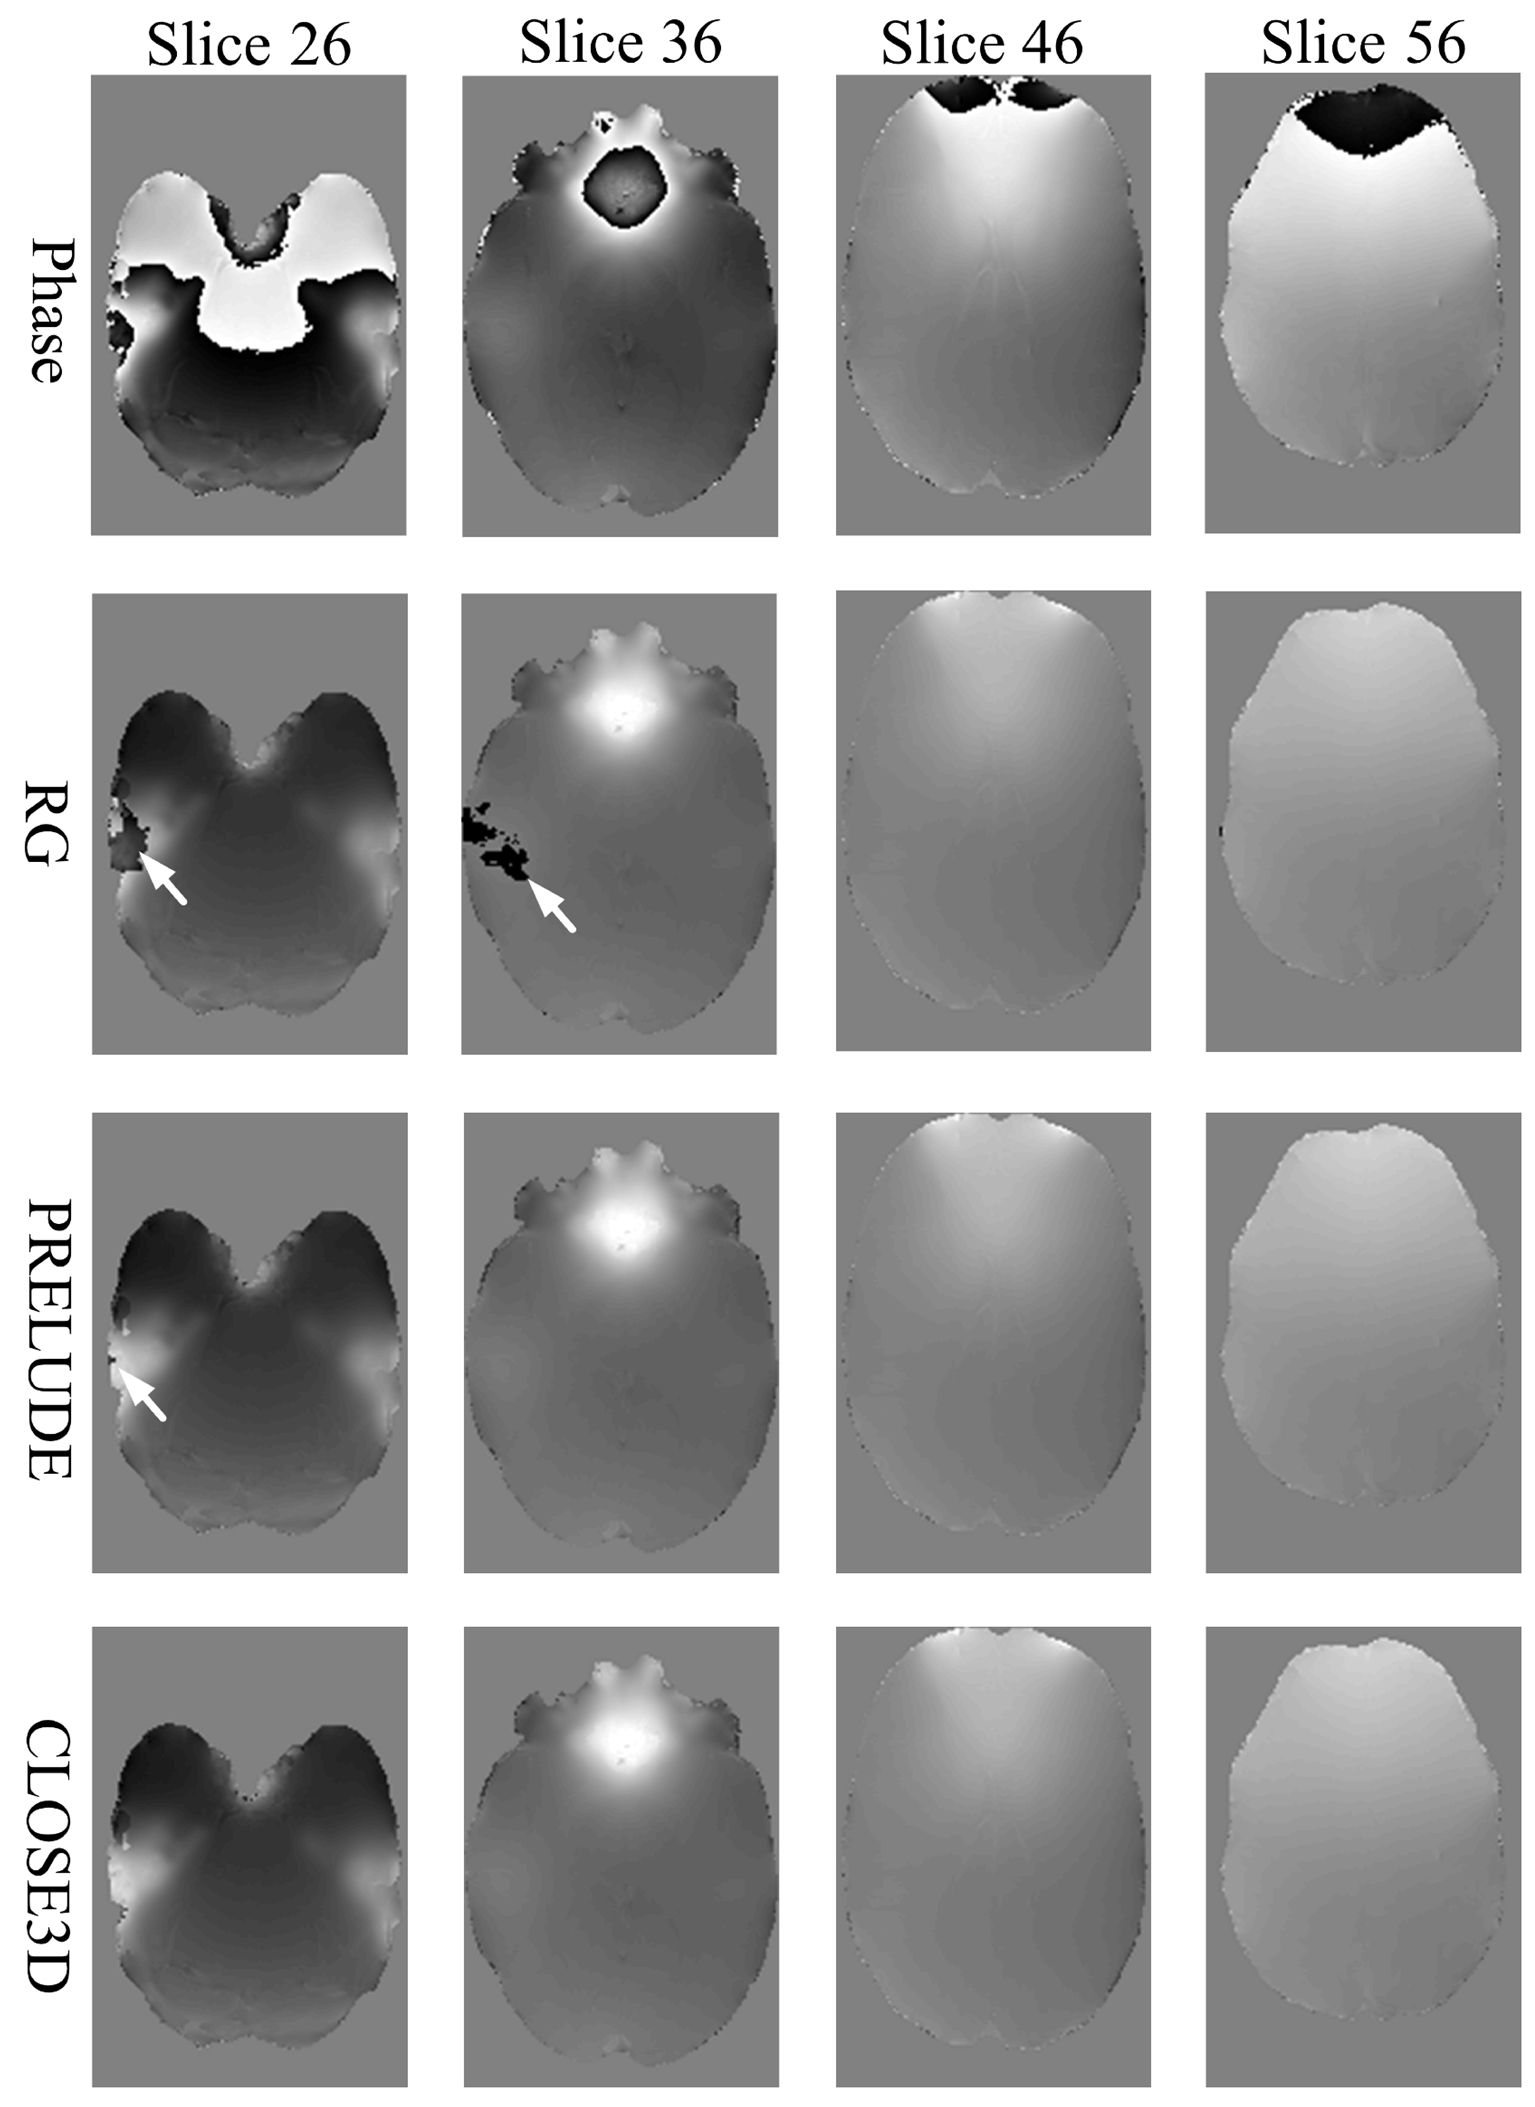
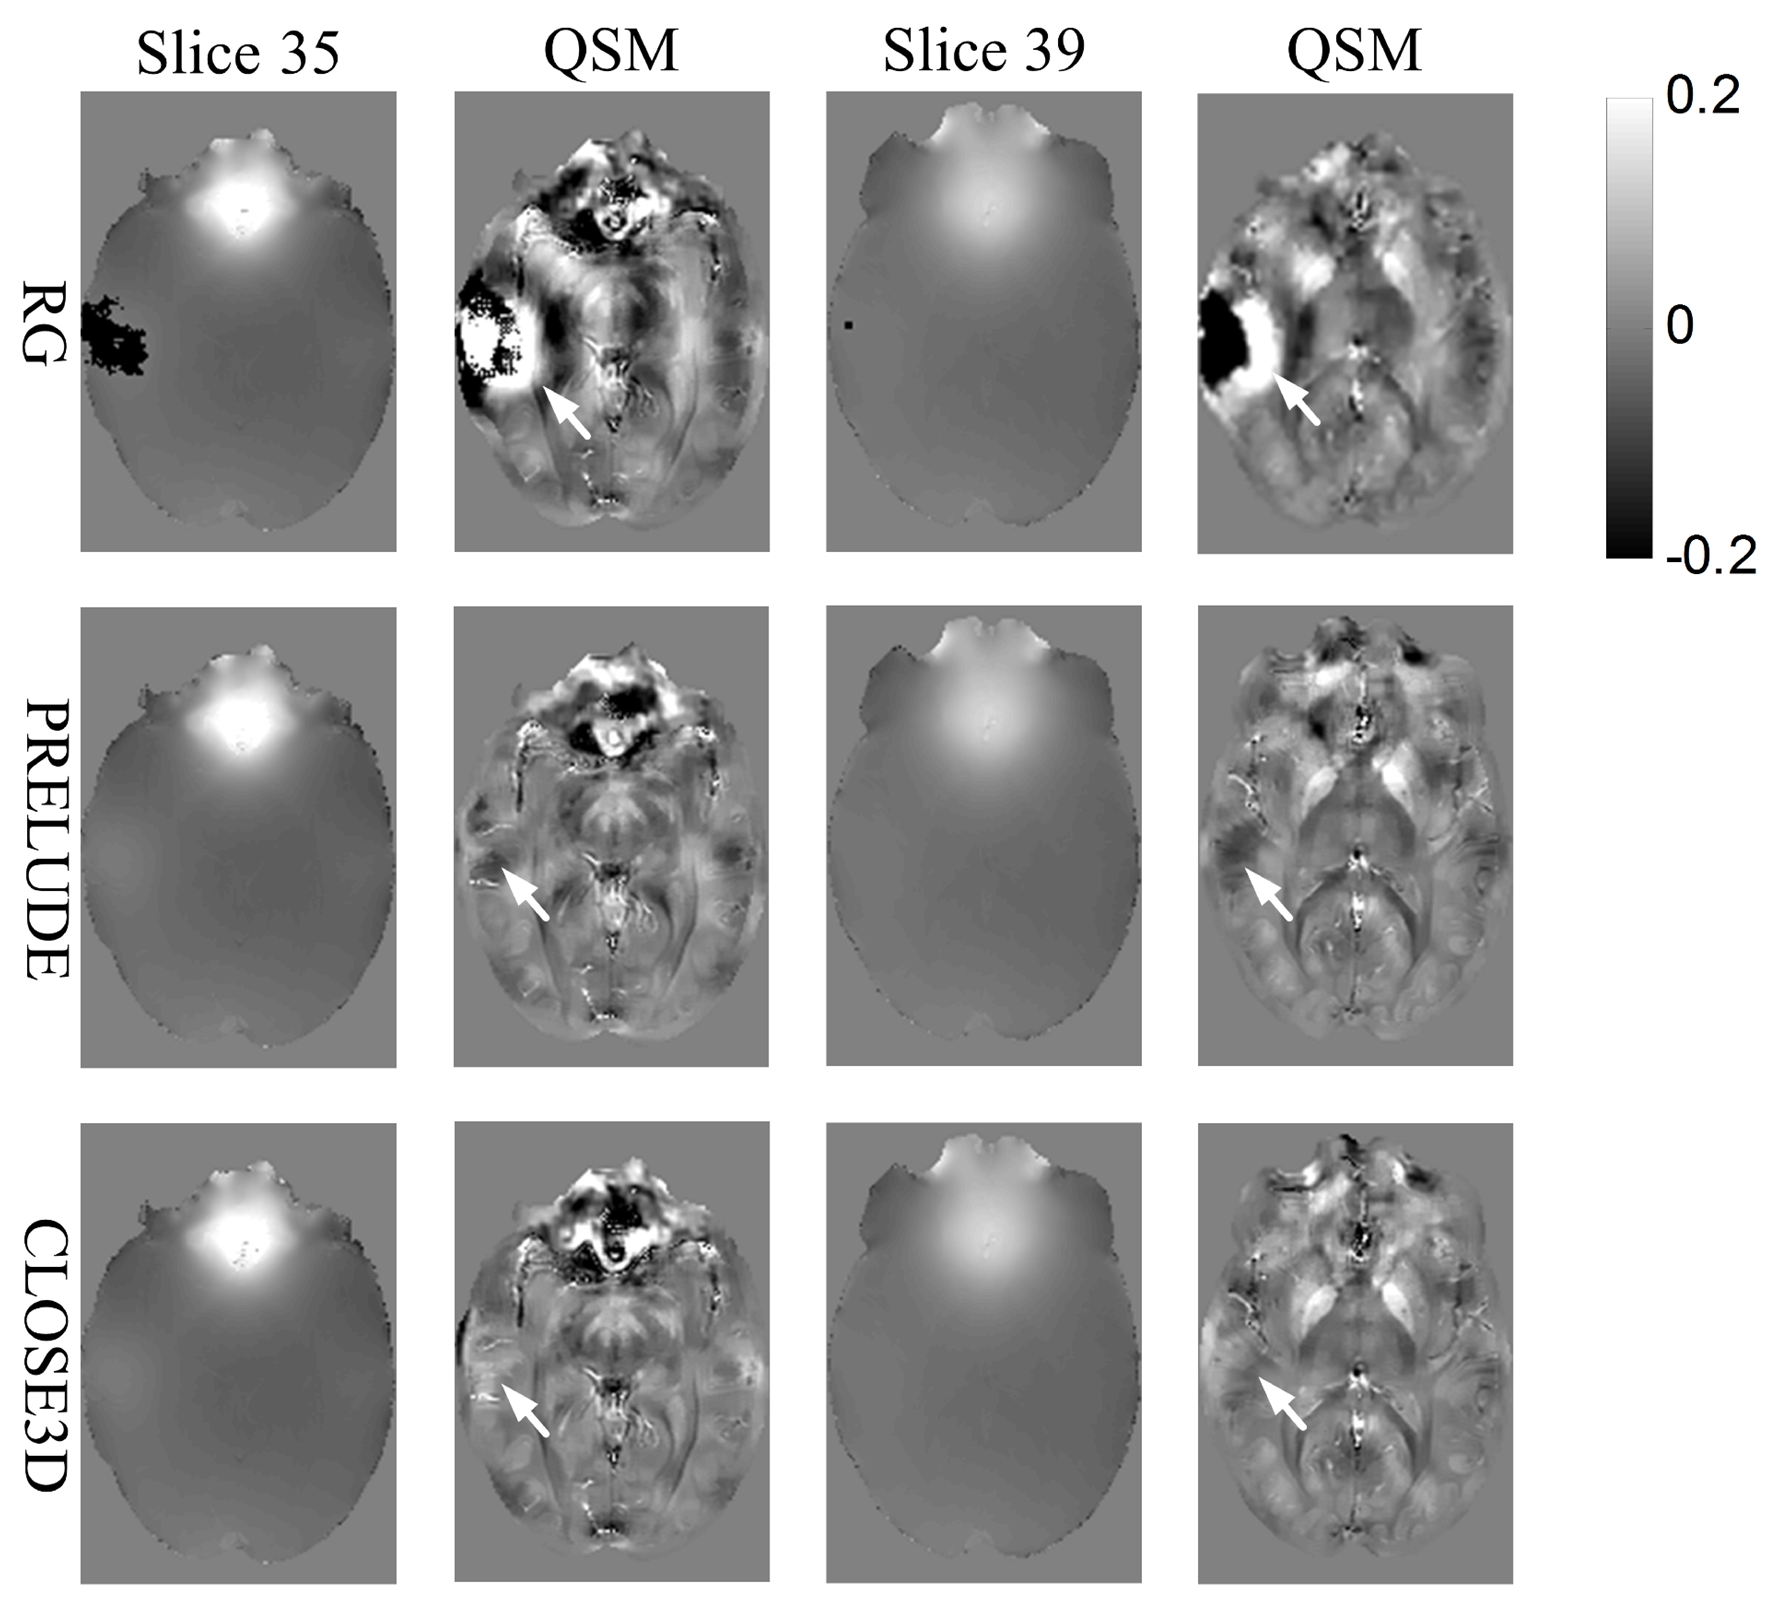
Figure 2 shows the unwraping results of the three algorithms on the brain data. There are apparent residual wrapps in the results of RG method, and slight residual wrapps near the brain margins in the PRELUDE results. In contrast, no noticeable errors can be observed in the CLOSE3D results. As shown in Figure 3, suceptibility maps calculated from RG-unwrapped phase contain severe quantfication errors, suceptibility maps from PRELUDE-unwrapped phase exhibit slight underestimation in some regions as pointed by the arrows, and no obvious errors can be seen in the suceptibility maps calcualted from CLOSE-unwrapped phase.
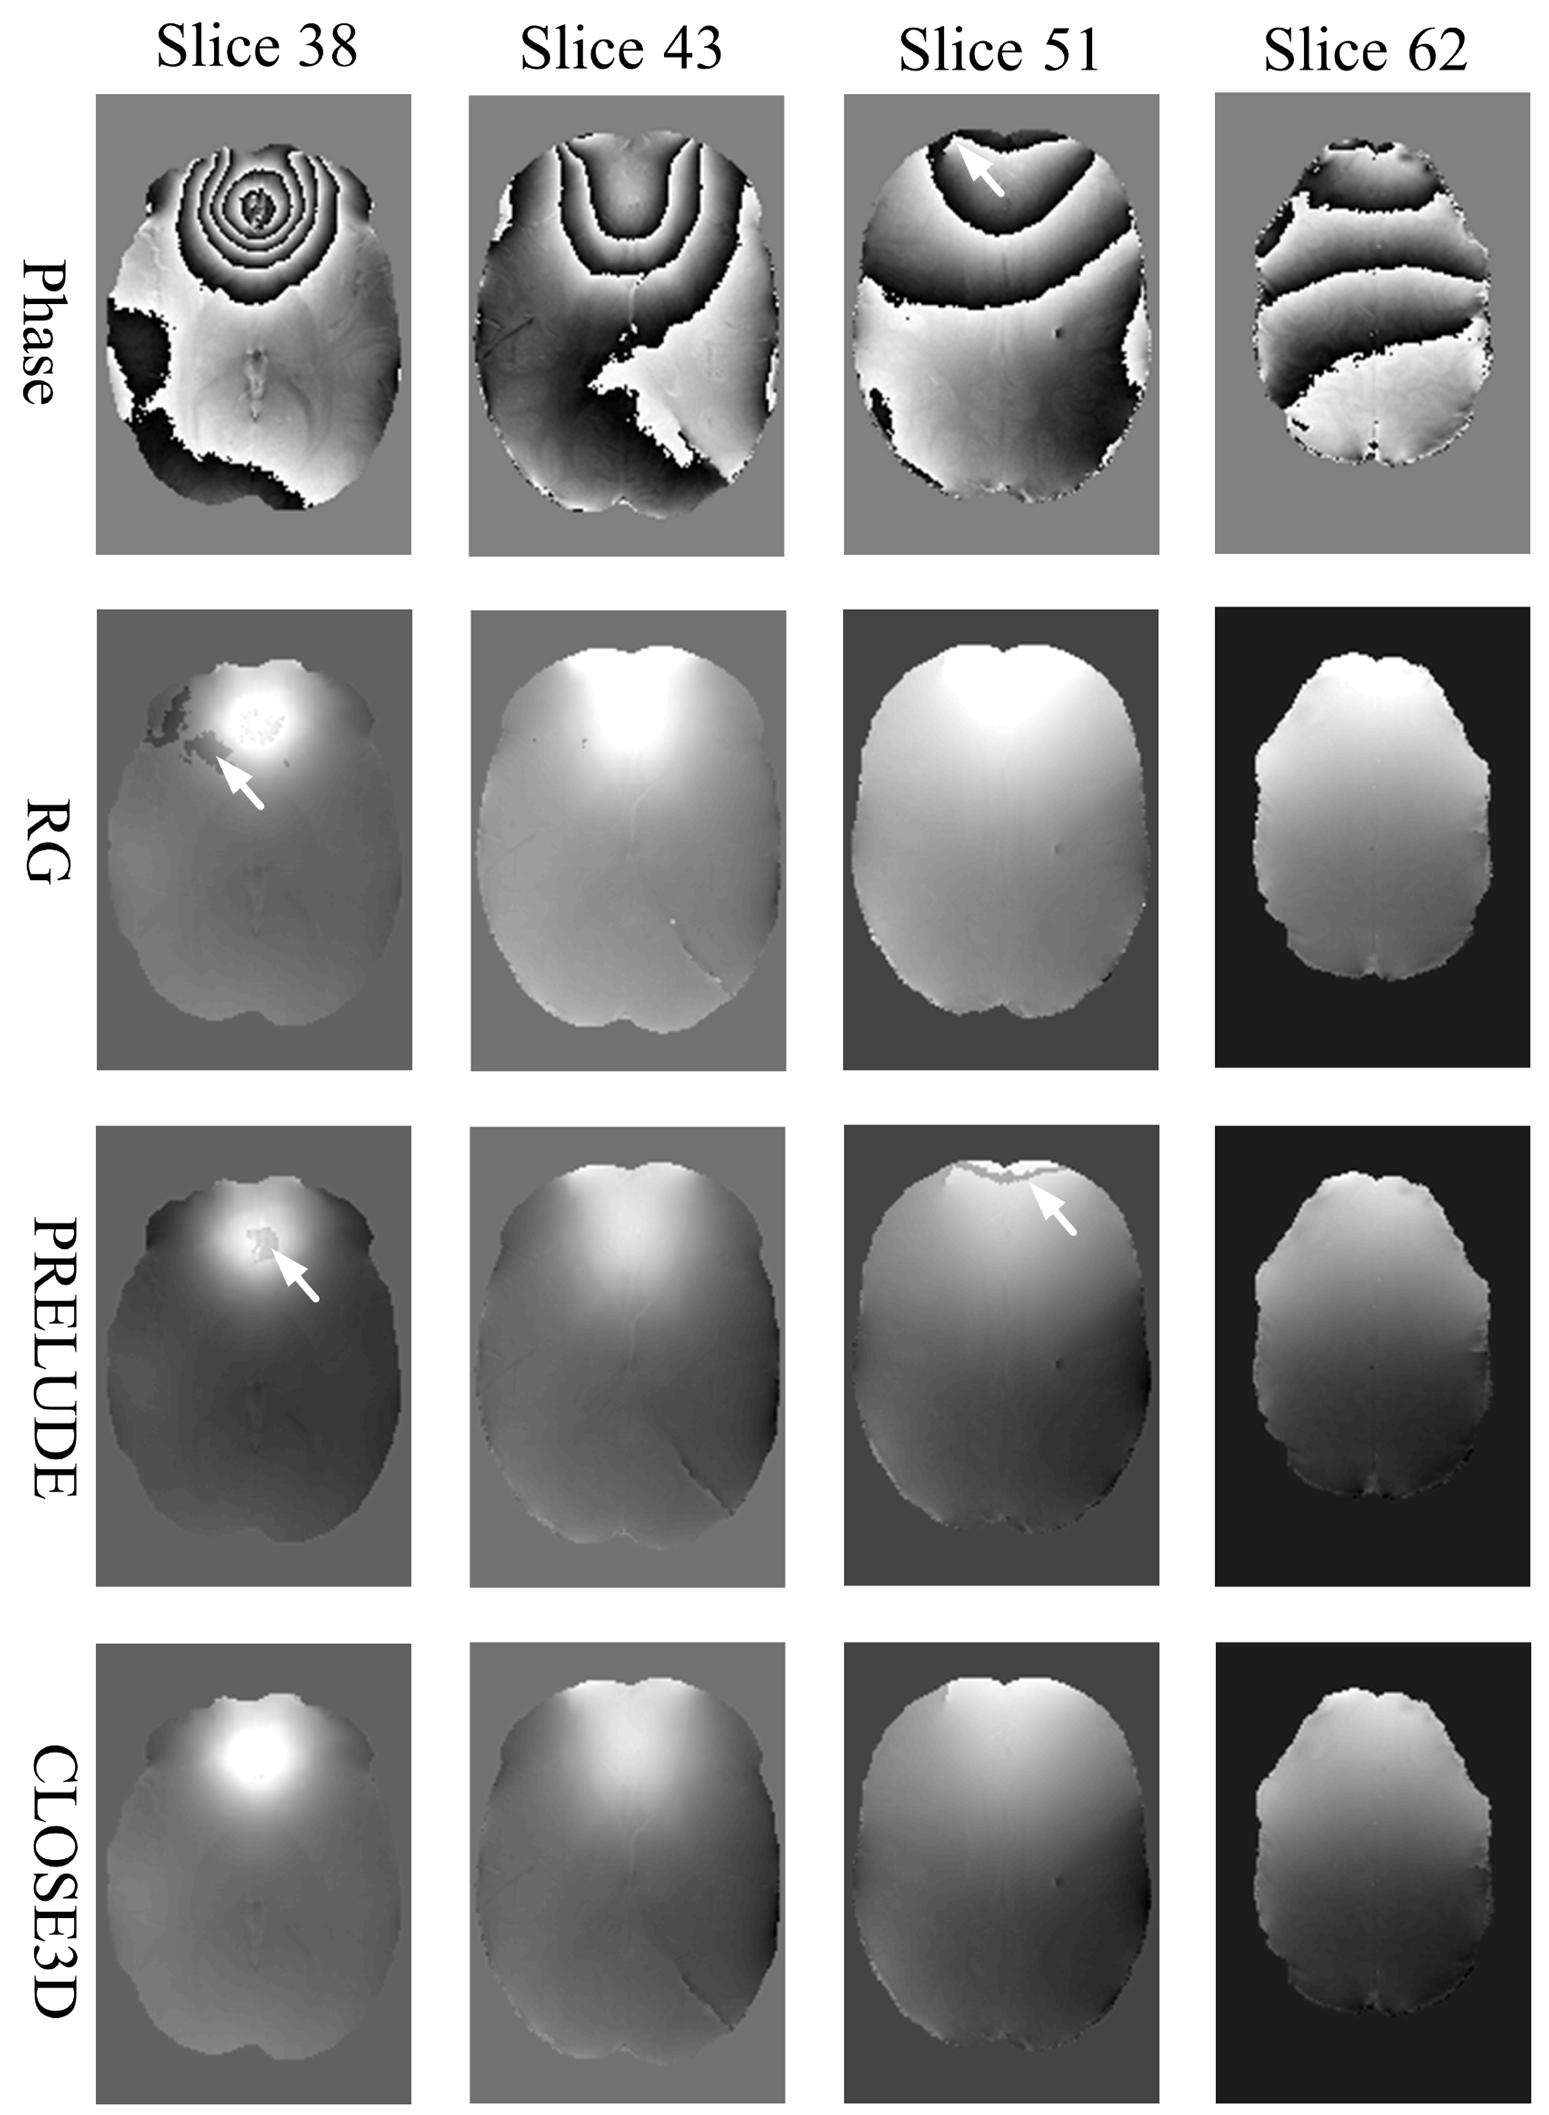
Figure 4 compares the performance of the three methods on data with rapid phase changes. Both RG and PRELUDE results contain obvious residual wrapps, while CLOSE3D achieves accurate phase unwrapping. Note that the open-end cutline problem can be overcome by CLOSE3D.
Disscussion and Conclusion:
The results demonstrate that the developed CLOSE3D method can accurately unwrap 3D phase data even in the presence of severe noise, rapid phase changes, and open-end cutlines. The CLOSE3D method will benefit phase-related 3D MRI applications such as susceptibility-weighted imaging, quantitative susceptibltiy mapping. The evaluation of the developed method on more real imaging data will be investigated in future before its practical application.Acknowledgements
No acknowledgement found.References
[1] Schweser F, et al. NMR in Biomedicine, 2016.
[2] E. Mark Haacke. MRI: 33 (2015) 1-25, 2015.
[3] Junying Cheng, et al. 24th ISMRM (Singapore), 5018, 2016.
[4] Zhe Liu, et al. 24th ISMRM (Singapore), 1570, 2016.
[5] Chavez S, et al. IEEE transactions on medical imaging: 21(8):966-977, 2002.
[6] http://weill.cornell.edu/mri/QSM/Online.zip.
[7] Jenkinson M. MRM: 49: 193-197, 2003.
[8] Smith S M, Jenkinson M, et al. Neuroimage: 23: S208-S219, 2004.
Figures