1953
Quantitative Susceptibility Mapping of Paramagnetic and Diamagnetic Substances at 3T-MR, 1.5T-MR and CT.1Department of Diagnostic Imaging and Nuclear Medicine, Kyoto University Graduate School of Medicine, Kyoto, Japan, 2Human Brain Research Center, Kyoto University Graduate School of Medicine, Kyoto, Japan
Synopsis
We compared QSM value of paramagnetic and diamagnetic substances at 3T-MR, 1.5T-MR, and CT in this study. Phantoms with different concentration gadoterate meglumine (Gd) and calciumcarbonate (CaCO3) were created. QSM at 3T and 1.5T and CT imaging were performed for these phantoms. QSM of Gd phantom showed positive susceptibility and QSM of CaCO3 showed negative susceptibility. QSM demonstrated consistent results in paramagnetic and diamagnetic substances at 3T and 1.5T. QSM and CT values were correlated well.
Purpose
Quantitative susceptibility mapping (QSM) is a novel postprocessing technique that uses gradient echo phase images to directly measure tissue magnetic susceptibility caused by various sources. QSM has attracted attention by providing paramagnetic and diamagnetic information of central nervous system. Various QSM algorithms have been developed [1-3] and the validation experiment was performed by using diluted gadolinium solution at a single MR unit in most reports. Gadolinium is paramagnetic, however, it is important to for us to evaluate QSM of both paramagnetic and diamagnetic substances at several magnets [4]. Moreover, the relationship between QSM and the Hounsfield unit at Computed Tomography (CT) may provide clinicians an important insight about susceptibility. Therefore, we compared QSM value of paramagnetic and diamagnetic substances at 3T-MR, 1.5T-MR, and CT in this study.Materials and Methods
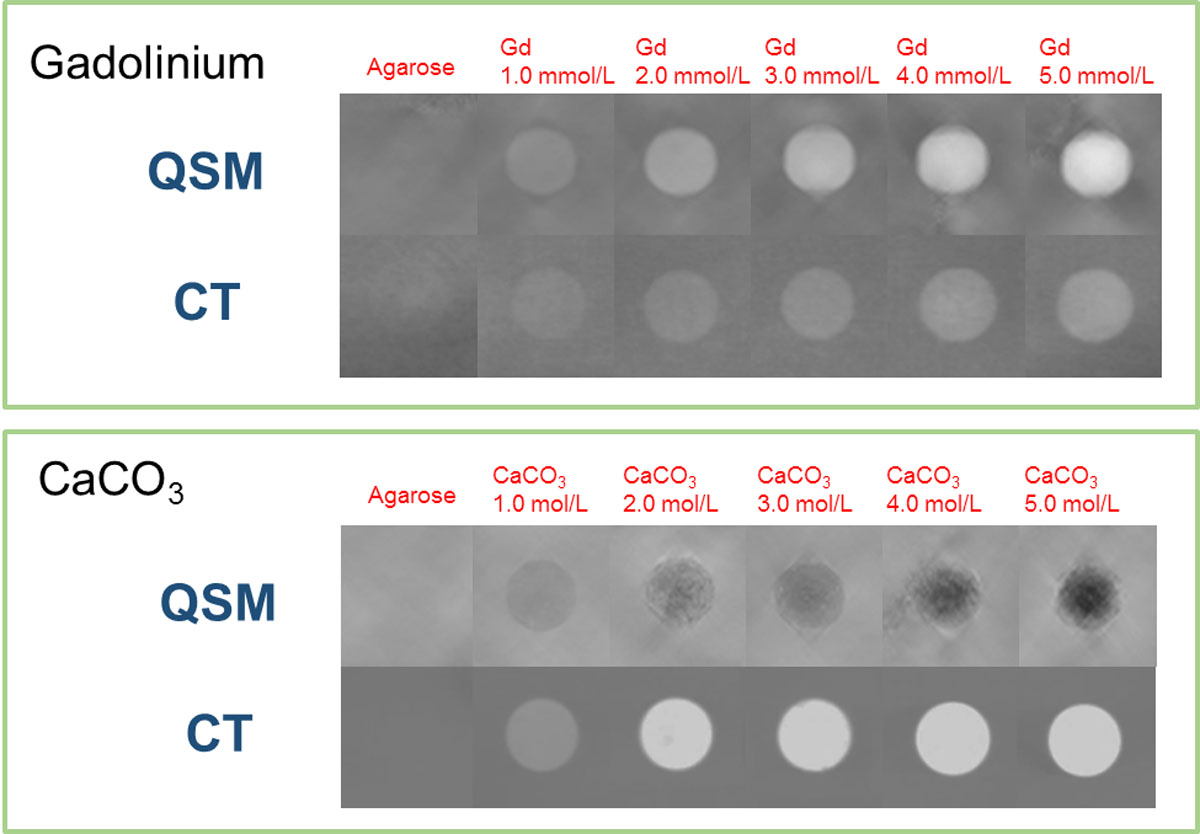
Phantom preparation Spherical phantoms were made with 2 % agarose gels with different concentration gadoterate meglumine (Gd) (Dotarem, Guerbet, Villepinte, France), 0,1.0, 2.0, 3.0, 4.0 and 5.0 mmol/L, calcium carbonate (CaCO3) were 0, 1.0, 2.0, 3.0, 4.0 and 5.0 mol/L. MR imaging Three-dimensional gradient echo imaging was acquired at 3 T MR unit (Vantage, Toshiba Medical Systems Corporation, Otawara, Japan) with 32 channels head coil, and at 1.5 T MR unit (EXCELART Vantage, Toshiba Medical Systems Corporation) with 12 channel head coil. Imaging parameters were as follows: TR, 60 msec; TE, 20, 30, 40, 50 msec (single echo sequence); flip angle, 20degree; field of view (FOV), 256 × 256 mm; matrix, 256×256; bandwidth, 89 Hz/pixel; number of slices,150; parallel imaging factor, N/A ; acquisition time , 42 minutes. CT imaging was acquired at multi-detector row CT scanner (Aquilion ONE, Toshiba Medical Systems Corporation, Otawara, Japan) with standard abdominal function. Imaging parameters were as follows: X-ray Tube Current, 350 mA, Exposure, 350 mAs, Filter Type: MEDIUM, Exposure Time: 1000 msec, Beam Pitch 0.638. MR image processing QSM was calculated by using the STI Suite (http://people.duke.edu/~cl160/) [5]. Phase mask images were generated from magnitude images by threshold for background phase removal. For phase unwrapping and background phase removal, a SHARP method with a variable radius of the spherical kernel at the brain boundary (V-SHARP) was conducted, then QSM was calculated from each local tissue phase by solving an inverse problem using the iLSQR method (an algorithm for sparse linear equations and sparse least squares) Data analysis ROIs were manually placed on the spherical phantom of Gd and CaCO3.Results
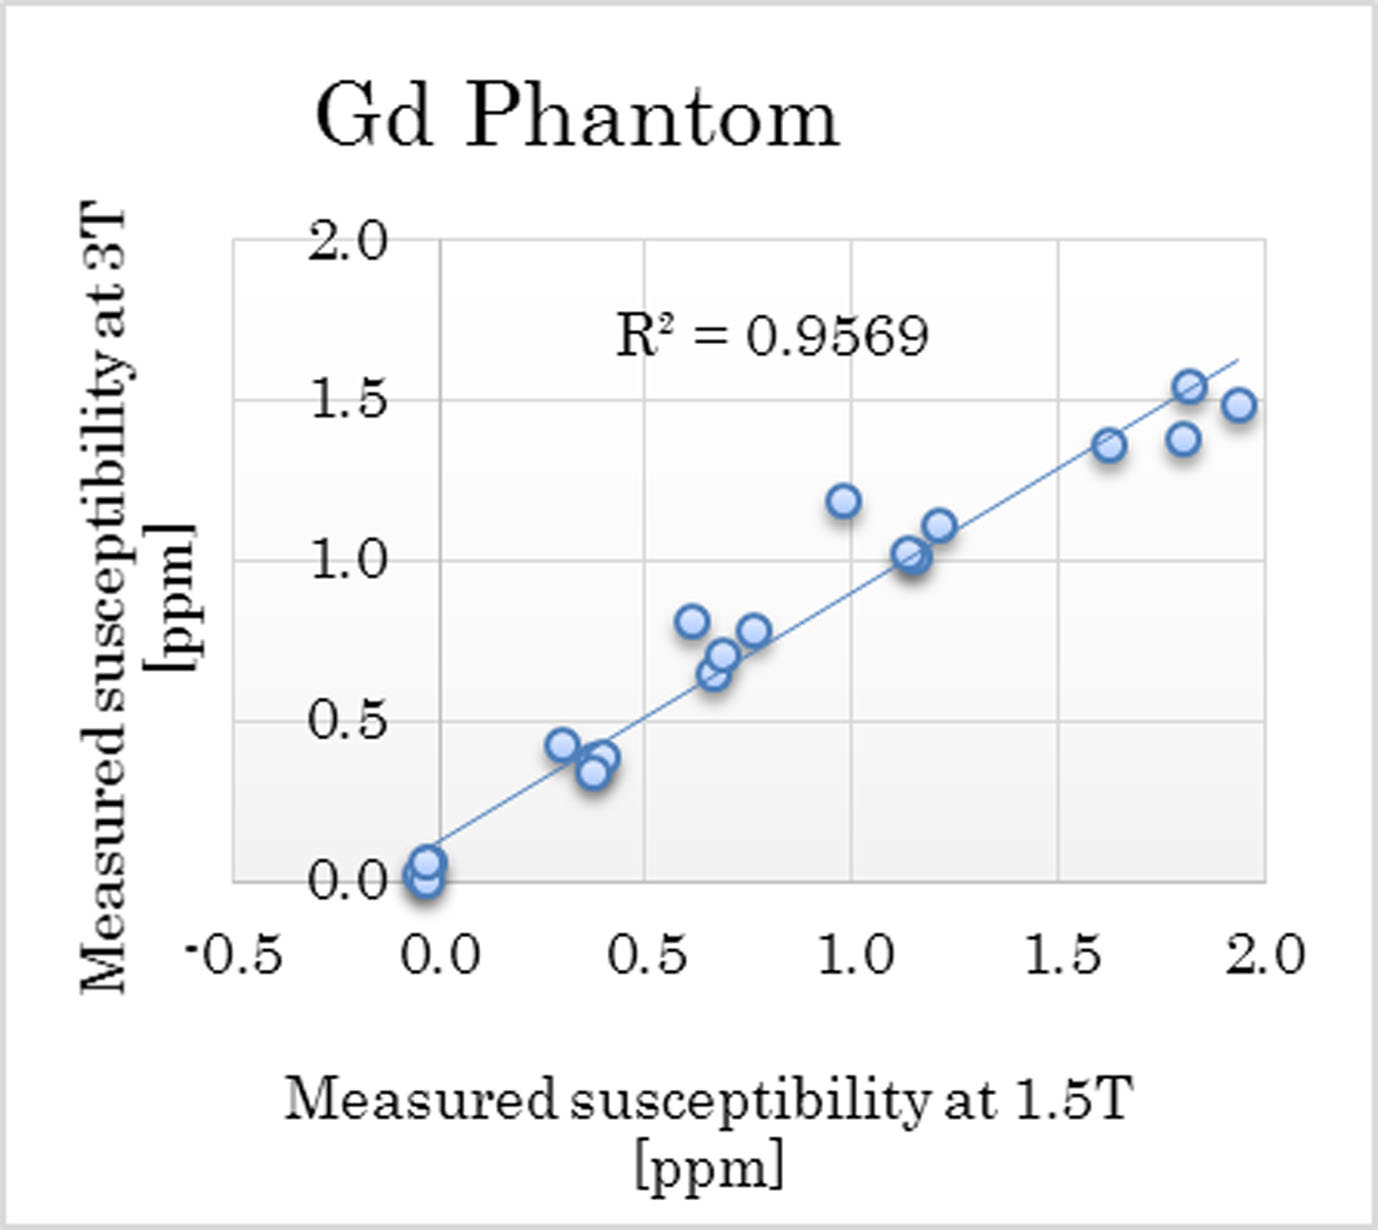
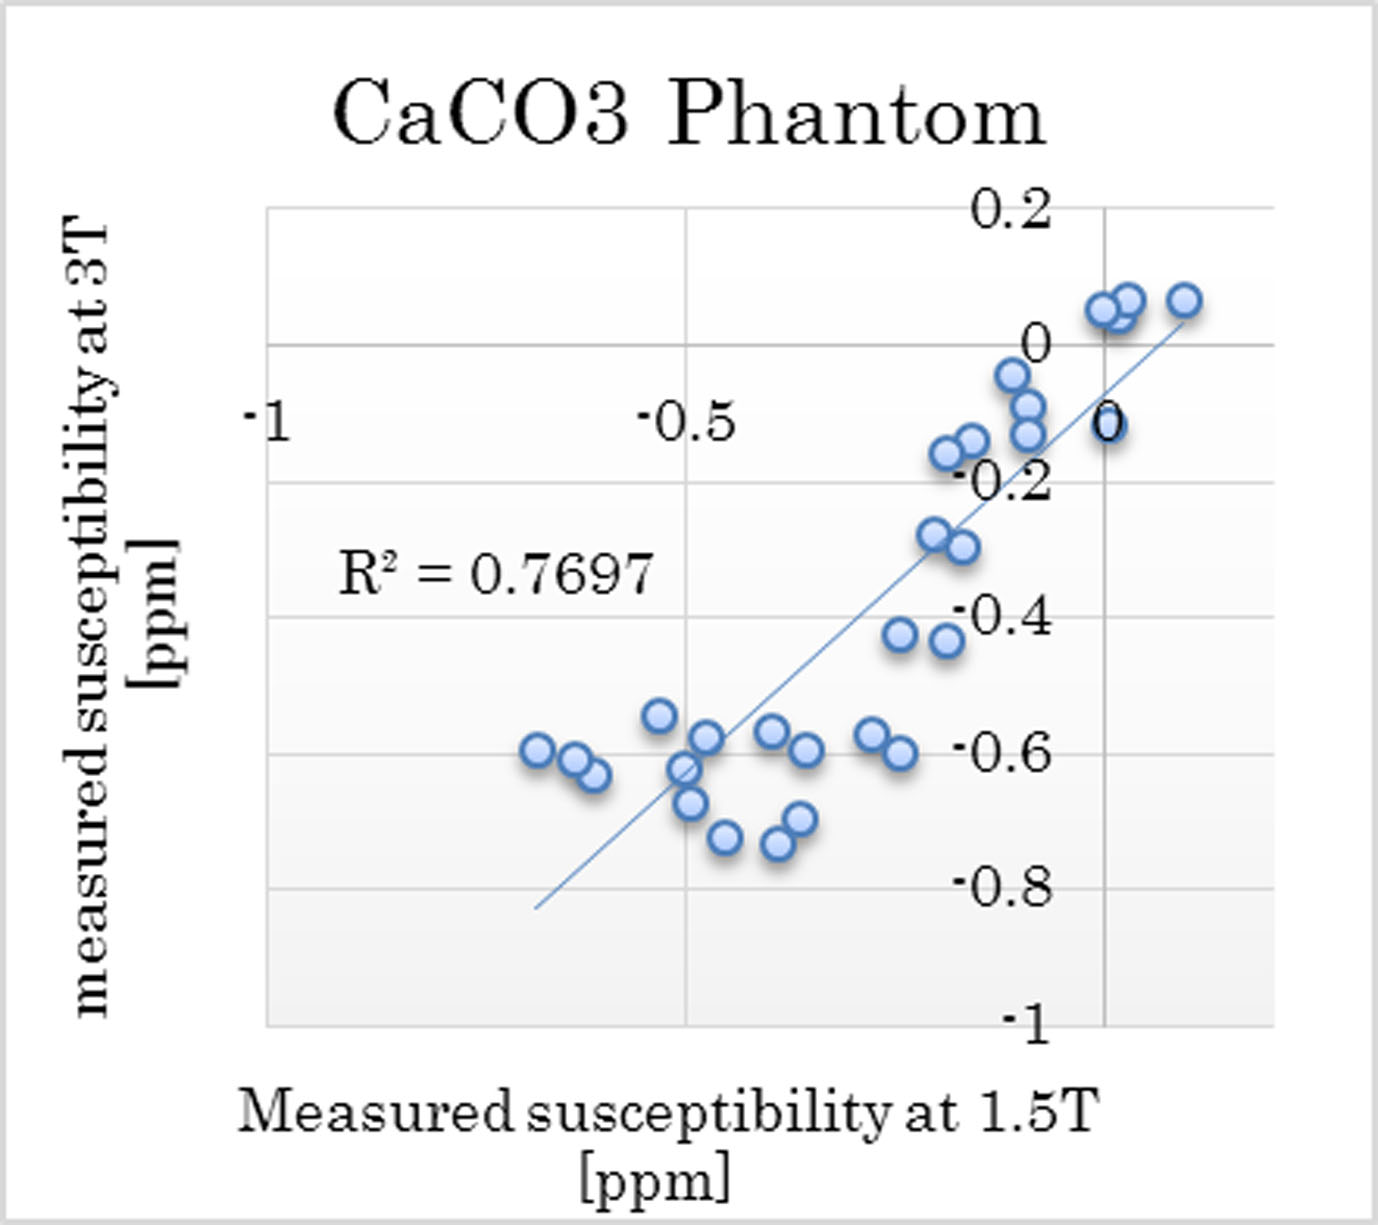
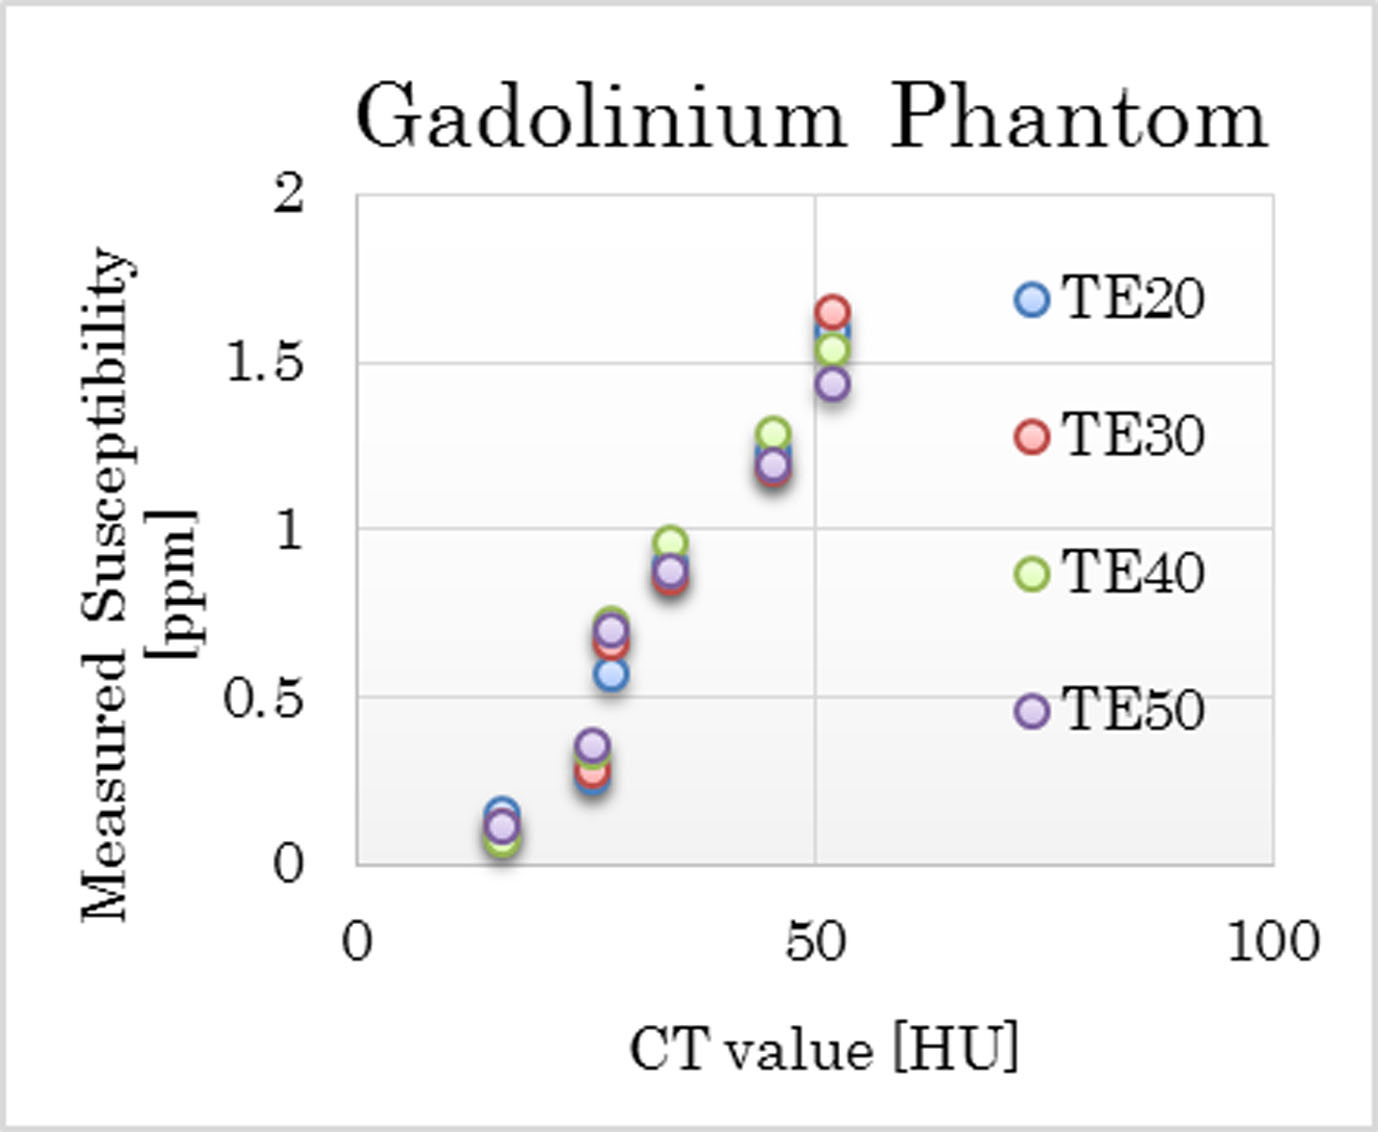
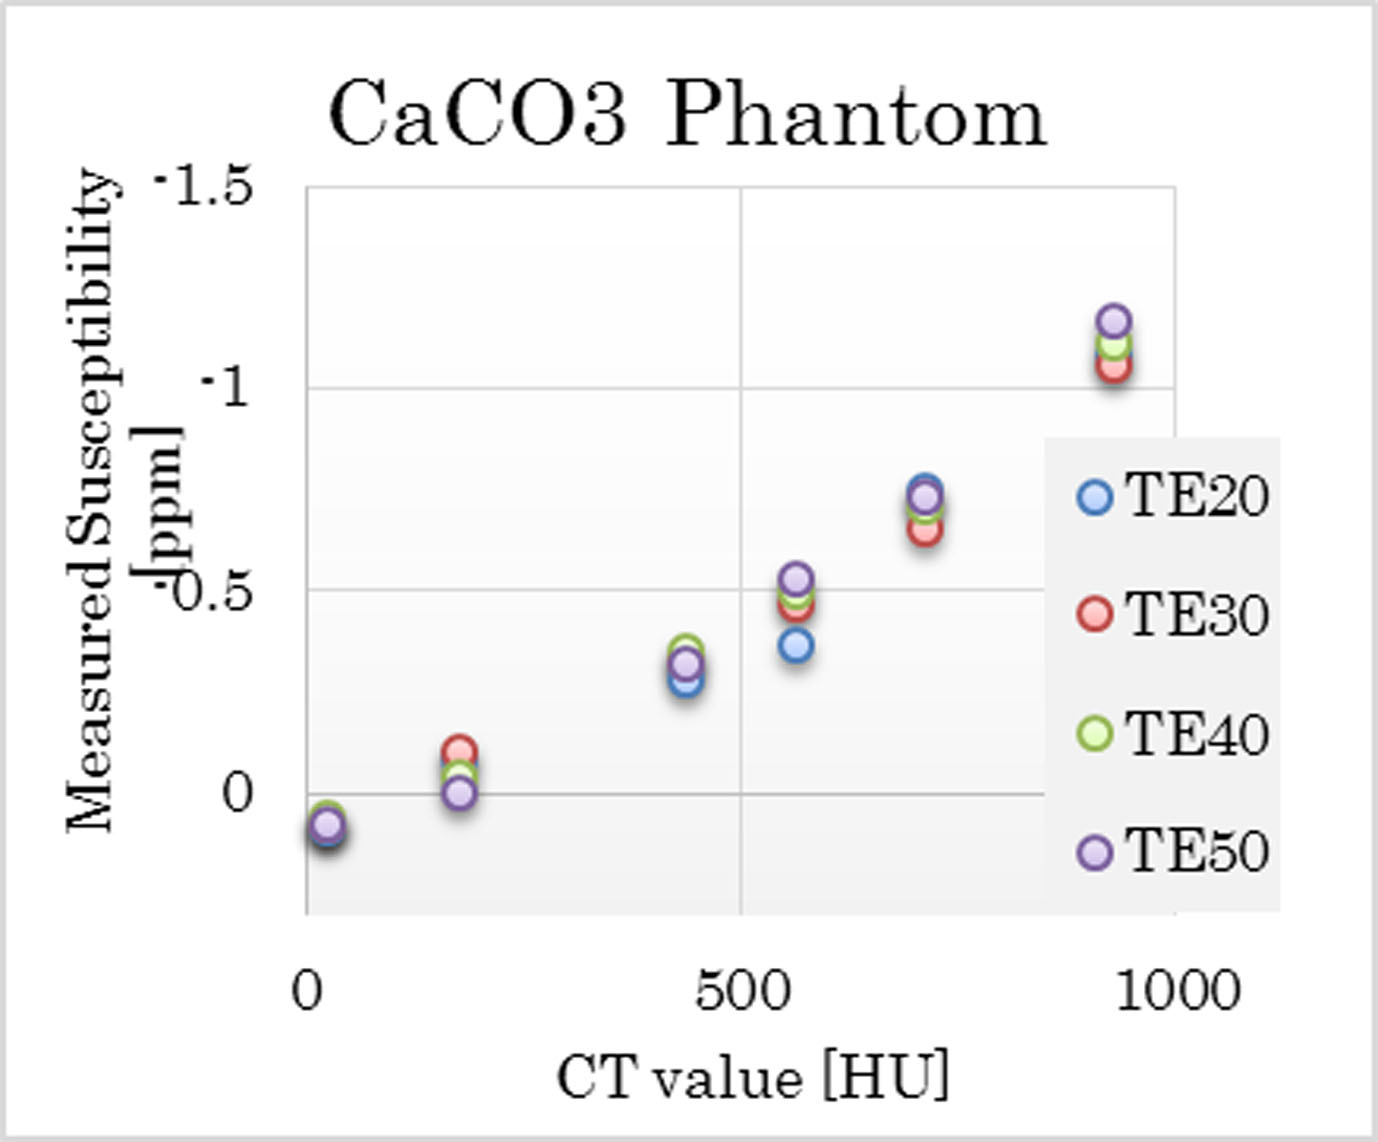
Images of phantoms are shown in Fig. 1. Comparison 1.5 T and 3 T: QSM of Gd phantom showed positive susceptibility. QSM of Gd phantom at 3 T and 1.5 T correlated with each other very well (R2 = 0.9569) (Fig. 2), and also showed almost the same value as the theoretical one. QSM of CaCO3 showed negative susceptibility. QSM of CaCO3 phantom at 3 T correlated with that at 1.5 T (R2 = 0.7697) (Fig. 3). Comparison QSM and CT value: CT value positively correlated with the concentration of gadolinium although Gd phantoms showed relatively low attenuation on CT (Fig. 4). QSM of CaCO3 phantoms negatively correlated with the concentration of CaCO3. Negative correlation was demonstrated between QSM of CaCO3 and CT values of CaCO3 (Fig. 5).Conclusion
QSM demonstrated consistent results in paramagnetic and diamagnetic substances at 3 T and 1.5 T. QSM and CT values were correlated well.Acknowledgements
We are grateful to Mr. Satoshi Kozawa, RT, and Koji Koizumi, RT for their help of CT scan. This study was supported by the Japan Society for the Promotion of Science KAKENHI grant number25461815 and a sponsored research program “Researches for improvement of MR visualization(number 150100700014)” provided to 1 of the authors, Professor Kaori Togashi, by Toshiba Medical Systems Corporation, Japan.References
1. Liu T, Spincemaille P, de Rochefort L, et al. Calculation of susceptibility through multiple orientation sampling (COSMOS): a method for conditioning the inverse problem from measured magnetic field map to susceptibility source image in MRI. Magnetic resonance in medicine 2009;61:196-204
2. Schweser F, Deistung A, Lehr BW, et al. Quantitative imaging of intrinsic magnetic tissue properties using MRI signal phase: an approach to in vivo brain iron metabolism? NeuroImage 2011;54:2789-2807
3. Liu C, Li W. Imaging neural architecture of the brain based on its multipole magnetic response. NeuroImage 2013;67:193-202
4. Hinoda T, Fushimi Y, Okada T, et al. Quantitative Susceptibility Mapping at 3 T and 1.5 T: Evaluation of Consistency and Reproducibility. Investigative radiology 2015;50:522-530
5. Li W, Avram AV, Wu B, et al. Integrated Laplacian-based phase unwrapping and background phase removal for quantitative susceptibility mapping. NMR in biomedicine 2014;27:219-227
Figures