1950
In Vivo Current Density Distribution of Brain during Electrical Stimulation1Kyung Hee University, Seoul, Korea, Republic of, 2Radiology, Chonnam National University Medical School, Gwangju, Korea, Republic of, 3Konkuk University, Seoul, Korea, Republic of
Synopsis
In deep brain stimulation, in vivo mapping of brain response is indispensable to secure its clinical applications. Estimation of current density distribution by stimulating currents can provide alternative way for understanding the therapeutic effects in electrical stimulation. MREIT method enables high-resolved mapping of electromagnetic tissue properties such as current density and conductivity of living tissues. In this study, we experimentally imaged current density distribution of in vivo canine brains by applying MREIT to electrical stimulation. The resulting current pathway and volume activation may provide useful information for adjusting the surgical planning and proving the therapeutic effects of DBS.
Purpose: Applying MREIT to electrical stimulation, we imaged in vivo current density distribution of brain tissues to investigate the brain response.
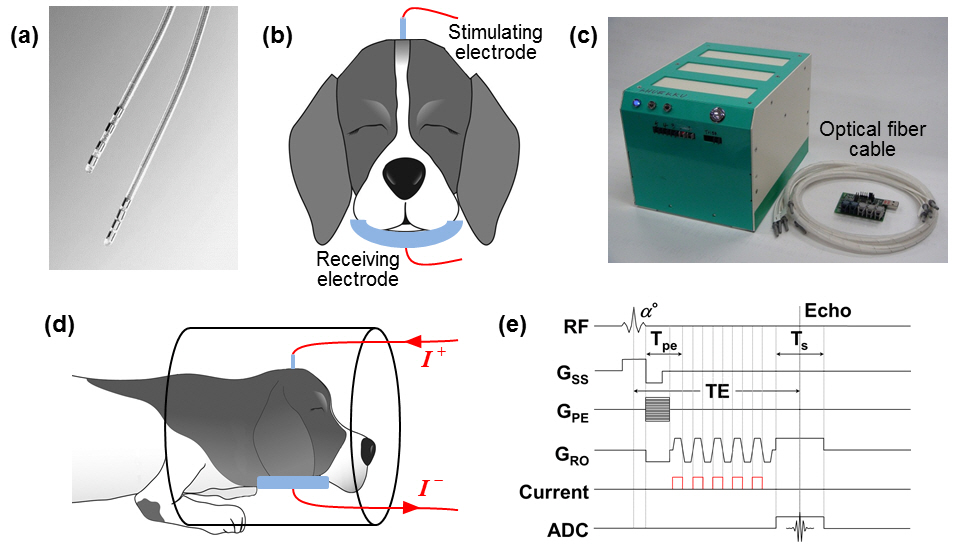
Methods: Three healthy beagles (3-5 years old, weighing 5-13 kg) were used for imaging experiment. All were healthy and without history of any known diseases. To prevent dribbling during the experiments, we injected 0.1 mg/kg of atrophine sulfate. Ten minutes later, we anesthetized the dogs with an intramuscular injection of 0.2 ml/kg Zolazepam (Zoletil 50, Virbac, France). The dogs were fixed to a standard stereotactic apparatus, and shaved on the scalp for surgical preparation. A DBS electrode (3387, Medtronic Inc, Minnesota, USA) for injecting currents was implanted into the brain (Fig. 1a and b). After implantation, wound was flushed with saline and skin incision was closed. To receive the passing currents through the brain, we attached a carbon-hydrogel (HUREV Co. Ltd, Korea) electrode on the skin (Fig. 1b). The experimental protocol was approved by the Institutional Animal Care and Use Committee (IACUC). Dogs were positioned inside the bore of 3T MR scanner (Achieva TX, Philips Medical Systems, Netherlands) with an 8-channel coil. Using a constant current source (Fig. 1c), we injected a 1 mA stimulating current with 45 msec width into the brain (Fig. 1d). The magnetic flux density data was obtained using a multi-gradient-echo MR pulse sequence (Fig. 1e). The imaging parameters were as follows: TR/TE = 1000/45 msec, FOV = 140×140 mm2, matrix size = 128×128, slice thickness = 3 mm, NEX = 4, and a total imaging time of 30 min. When calculating the current density from the measured Bz, the noise from the defected region is spread out to whole imaging domain and results in poor estimation.1 To minimize it, we applied the projected current density method focusing on the limited area.1
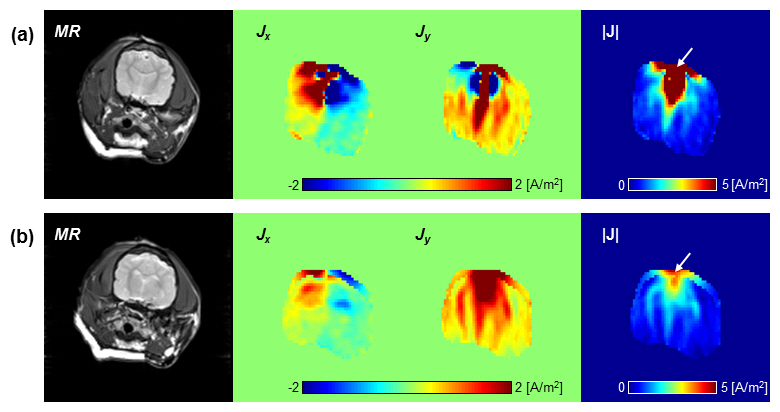
Results and Discussion: Figure 2 is resulting current density images of in vivo brain. The MR magnitude images were obtained from the brain region which were located 2 mm (upper panel) and 4 mm (lower panel) distance from the DBS electrode. The x- and y-components of current density (Jx and Jy) indicate the orientation of current flow related to the brain tissue property. The final magnitude of current densities |J| showed clear contrast between the brain tissues including gray matter, white matter, and cerebrospinal fluid (CSF). The current densities of white matter and CSF were higher than gray matter. Since white matter has strong anisotropic characteristic, current density relies on the actual pathways of current flow inside the brain, and shows their values when current flows are parallel to the fiber direction.2 The high contrast in CSF is originated from higher conductivity of 2.0 S/m.3 The current density around the electrode region (white arrows) showed two or three times higher values than surrounding tissues due to high current flows. Figure 3 represents the comparison of current densities from three different canine brains. For quantitative analysis, we measured the current density of brain tissues using a region-of-interest (ROI) of 5×5 pixel size. ROIs were positioned in the gray matter, white matter, and CSF (Fig. 3a). Bar graph in Fig. 3b represents that current densities of CSF and white matter were higher than those of gray matter in all cases.
Conclusion: In this study, we experimentally imaged cross-sectional current density distribution of living brain using a MREIT method. From the measured magnetic flux density image, we calculated electromagnetic tissue properties of brain tissues. We can finally image the current density distribution of the brain. We expect that MREIT can provide a prior information on tissues to be utilized for in vivo human imaging.
Acknowledgements
This work was supported by the National Research Foundation (NRF) of Korea grants (No. 2014R1A2A1A09006320, 2015R1A5A1037656, 2015R1D1A1A09058104, 2016R1A2B4014534).References
1. Sajib SZK et al. Regional absolute conductivity reconstruction using projected current density in MREIT. Phys. Med. Biol. 2012;57:5841-5859.
2. Kochunov P et al. Fractional anisotropy of cerebral white matter and thickness of cortical gray matter across the lifespan. NeuroImage 2011;58(1):41-49.
3. Gabriel S et al. The dielectric properties of biological tissues: II. Measurements in the frequency range 10Hz to 20GHz. Phys Med Biol 1996;44:2251-2269.
Figures