1946
Evaluation of dual-echo EPI for in-vivo current mapping in individual subjects during transcranial Direct Current Stimulation1Biomedical Engineering, University of California Los Angeles, Los Angeles, CA, United States, 2University of Southern California, CA, United States, 3Biomedical Engineering, City College of New York, NY, United States
Synopsis
Transcranial Direct Current Stimulation (tDCS) is a neuromodulation technique that uses milliampere currents to modulate cortical excitability. Although tDCS has been shown to treat clinical symptoms and improve cognition, the distribution of tDCS currents in the brain remains unknown. Here we show a MRI technique that measures a component of the magnetic field induced by tDCS currents in-vivo. Experimental data acquired using this technique is compared to model-based simulations. Our results demonstrate that mapping the tDCS current-induced magnetic fields in individual subjects is feasible; opening an avenue to map electric currents directly and track target engagement in individual subjects.
INTRODUCTION:
Transcranial Direct Current stimulation (tDCS) is a neuromodulation
technique that uses milliampere currents delivered through scalp electrodes.
Hypothesized to modulate cortical excitability, tDCS has been shown to treat clinical
symptoms as well as improve cognition1-3. To understand the
mechanism of tDCS, there is an urgent need to map the distribution of tDCS electric
currents in the brain. To date, mathematical models4,5 have been used for this purpose; however
these lack in-vivo validation. Recently, a technique based on Ampere’s law to
visualize tDCS currents in-vivo was reported6. This technique uses
MRI field mapping to detect tDCS induced magnetic field changes along the
static MRI field (B0). The authors measured tDCS induced magnetic fields in a
group of 12 subjects. In this abstract, we present a dual-echo EPI technique sensitive
enough to perform the same measurement in individual subjects. We evaluate our
technique by comparing the experimentally measured field changes to simulations
(the latter based on mathematical models mentioned above and utilizing
information from a separate structural MRI scan).METHODS:
tDCS Setup: A bilateral tDCS montage was used, with sponge electrodes (7x5cm)
placed at C3/C4 positions on the scalp.
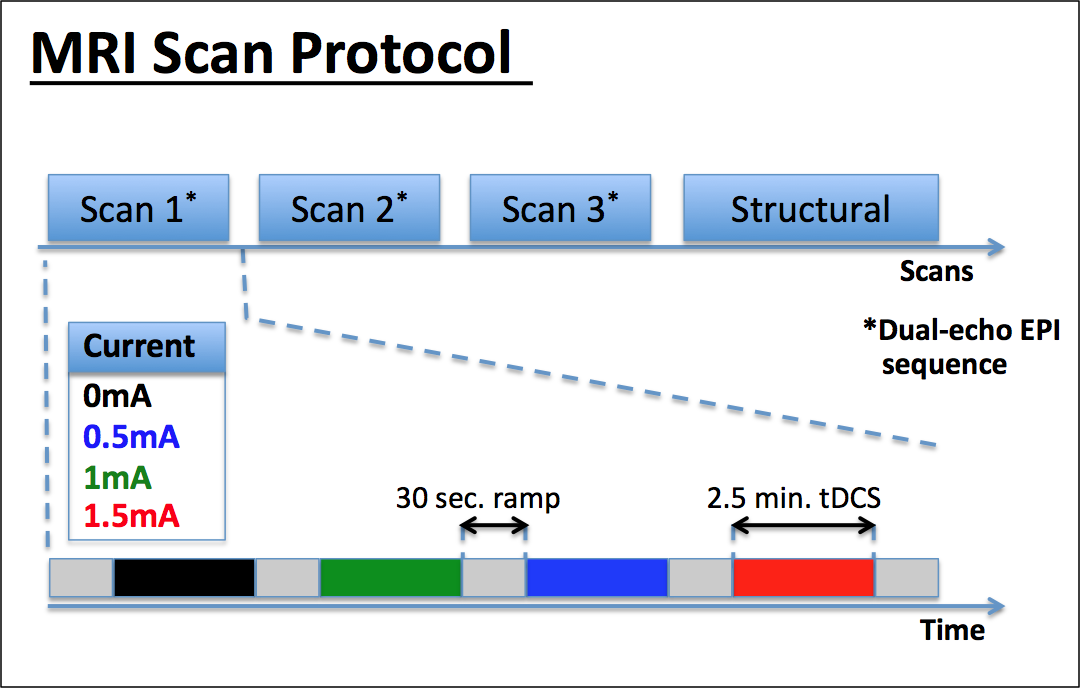
Data Acquisition: MRI data was collected from 4 healthy male subjects on
a Siemens 3T Trio TIM MRI using a 12-channel head coil. Field mapping data was
acquired using a dual-echo EPI pCASL sequence (Fig 1). Only the field mapping data was analyzed and is reported in
this abstract. During each EPI scan, 4 different tDCS stimulation blocks (0/0.5/1/1.5mA)
were applied in randomized order (Fig 1).
A total of 3 such EPI scans were performed per subject. The order of the
currents was counterbalanced across scans and subjects. During the scans,
subjects were asked to fixate on a white cross on a black background. Additionally,
a T1-weighted MPRAGE structural scan was also acquired (Fig 1).
Data Processing: Phase data from the three EPI acquisitions was concatenated
and unwrapped using the Region-Growth algorithm implemented in PhaseTools7.
MRI data was then realigned to the first volume using SPM8.
Statistical Analyses: Phase was modeled as:
Φ = Φ0 + ΦtDCS-Current + ΦMotion + ΦDrift
+ ΦOff-Res + ΦNoise
Φ0 was modeled out by using the phase difference between the two
TE’s. ΦDrift was modeled out by detrending each scan with a
quadratic polynomial, following which magnetic field was calculated using the
scaling factor 1/γ*ΔTE. Subsequently, data was modeled using a voxel-wise general
linear model (GLM) with the applied current as a predictor. In the GLM, ΦOff-Res
is modeled out as an intercept. Nuisance regressors comprising motion parameters,
scan-number and global mean phase (modeling uncorrected global drift) were also
included. The slope corresponding to the predictor was interpreted as the
induced magnetic field per mA of tDCS current, with a confidence given by the
goodness of fit.
Simulations: SIMNIBS8 (an open-source software) was used to define
tDCS electrodes on the structural data and calculate current densities (assuming
standard isotropic tissue-conductivity values). Subsequently, an in-house
implementation of the biot-savart law was used to convert the current densities
into magnetic fields to compare with experimental data.
RESULTS:
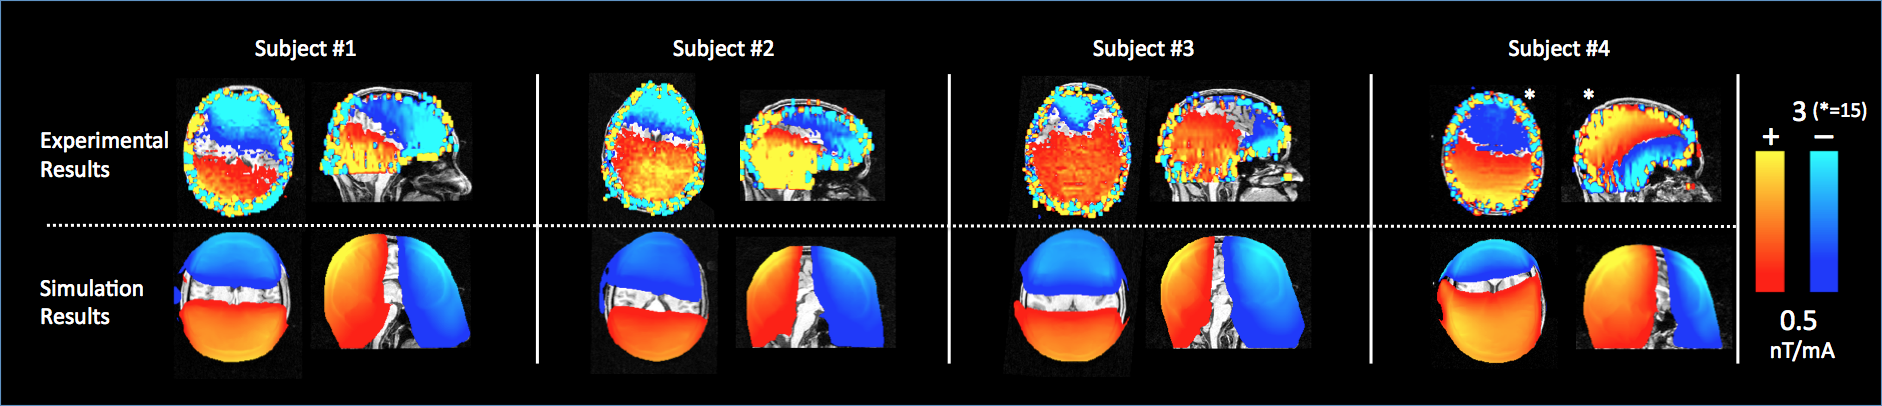
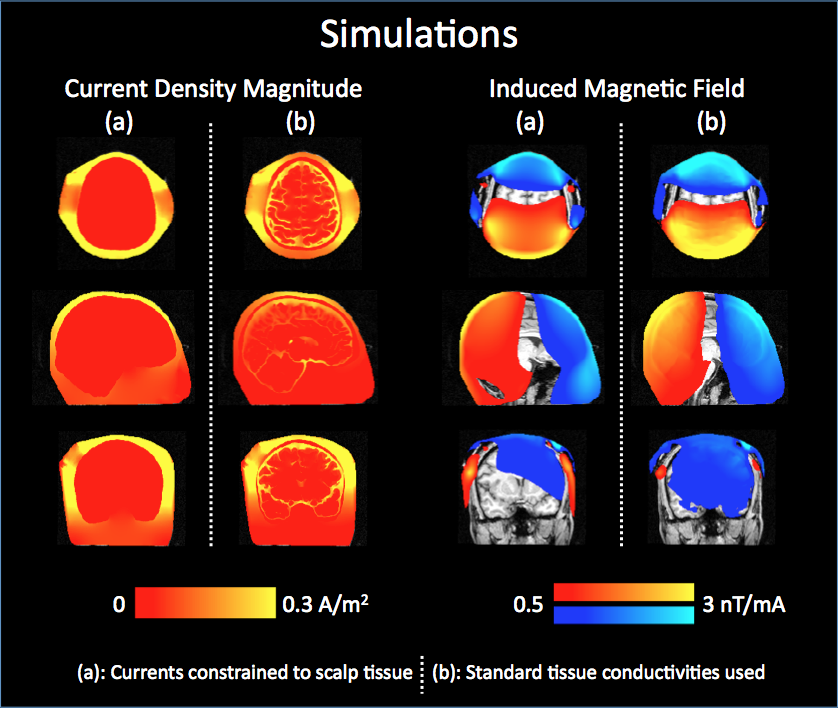
Fig 2 shows the measured magnetic field data (1st row) with simulation results (2nd row). Experimental measurements and simulated results were found to be significantly correlated (Spearman correlations = 0.53, 0.45, 0.13, 0.61; p < 0.001, for Subjects 1-4 respectively). However, the magnetic field in the brain was measured to be larger than its simulated counterpart in all subjects. Additionally, some inter-individual variability was observed experimentally, which was not apparent through simulations (Subject 4 vs. the rest). To help interpret magnetic fields, a separate simulation was performed (Fig 3) which showed that magnetic fields inside the brain reduce as current shunts away from the brain.DISCUSSION and CONCLUSION:
Experimental and simulated data were significantly correlated for all
subjects. Taken together with the fact that simulations predict current in the
brain (Fig 3), our measurements
indicate that tDCS currents do indeed pass through the brain. In fact, the
observation of larger-than-simulated magnetic fields in the brain suggests that
more current may be flowing through the brain parenchyma than is predicted by
models (since fields in the brain reduce as more current shunts over the scalp,
Fig 3). Our results show that
experimental measurement of tDCS induced magnetic fields is feasible in
individual subjects and can be used to guide model development. Moreover, being
able to measure tDCS induced fields in single subjects opens up an avenue to
measure target engagement directly: a capacity which does not exist to date. Acknowledgements
No acknowledgement found.References
1. Gomez Palacio Schjetnan A, Faraji J, Metz G, et al. Transcranial Direct Current Stimulation in Stroke Rehabilitation: A Review of Recent Advancements. Stroke Research and Treatment 2013, 1–14 (2013).
2. Woods AJ, Antal A, Bikson M, et al. A technical guide to tDCS, and related non-invasive brain stimulation tools. Clinical Neurophysiology 127, 1031–1048 (2016).
3. Coffman B, Clark V, Parasuraman R. Battery powered thought: Enhancement of attention, learning, and memory in healthy adults using transcranial direct current stimulation. NeuroImage 85, 895–908 (2014).
4. Bikson M, Rahman A, Datta A. Computational Models of Transcranial Direct Current Stimulation. Clinical EEG and Neuroscience 43, 176–183 (2012).
5. Kessler SK, Minhas P, Woods AJ, et al. Dosage Considerations for Transcranial Direct Current Stimulation in Children: A Computational Modeling Study. PLoS ONE; 10.1371/journal.pone.0076112 (2013).
6. Jog MV, Smith RX, Jann K, et al. In-vivo Imaging of Magnetic Fields Induced by Transcranial Direct Current Stimulation (tDCS) in Human Brain using MRI. Sci. Rep. 6, 34385; doi: 10.1038/srep34385 (2016).
7. Barnhill E, Kennedy P, Hammer S, et al. Statistical mapping of the effect of knee extension on thigh muscle viscoelastic properties using magnetic resonance elastography. Physiol Meas. 2013 Dec;34(12):1675-98. doi: 10.1088/0967-3334/34/12/1675. Epub 2013 Nov 20.
8. Thielscher A, Antunes A and Saturnino GB. Field modeling for transcranial magnetic stimulation: a useful tool to understand the physiological effects of TMS. IEEE EMBS 2015, Milano, Italy
Figures