1945
Advanced 3D simultaneous conductivity and susceptibility imaging with mitigation of nonlinear phase evolution effect.1Electrical &Electronic Engineering, Yonsei University, Seoul, Korea, Republic of
Synopsis
Simultaneous Quantitative conductivity and susceptibility mapping (QCSM) can acquire both 3D conductivity and 3D susceptibility map with a single scan 3D multi-echo GRE sequence. However, error occurs due to nonlinear phase evolution in some regions producing false values especially for conductivity. In this study, we analyzed this effect and propose a way to mitigate this effect.
Introduction
Magnetic susceptibility and electric conductivity value can be simultaneously measured using multi-echo GRE sequence1,2, on the supposition that the multi echo GRE phase is linear. However, this supposition fails in some circumstances: background gradient (δB0), flow, fiber orientation. In previous study, we have shown the effect of background gradient field (δB0) on GRE phase and how to mitigate this effect: by increasing the resolution and adjusting the number of echoes for fitting.3 Taking advantage of this knowledge, this method can be extended for 3D acquisition of GRE TE=0 map, from which conductivity map can be acquired by 3D EPT process and susceptibility map by QSM. Here we will demonstrate another source: nonlinear phase evolution due to fiber orientation. Also, a simultaneous QCSM map in deep gray matter region including: Caudate nucleus, Thalamas, Putamen, Globus pallidus where both the susceptibility and conductivity contrast could be observed.Method
1. Sequence: A healthy volunteer was scanned using unipolar multi-echo 3D GRE sequence at 3T (Tim Trio, Siemens Medical Solutions, Erlangen, Germany) with a 4 channel head coil. The imaging parameters were as follows: matrix size:128x128x80, spatial resolution: 1.5x1.5x1.5mm3, TR=40ms, TE1= 1.77ms, dTE=2.32ms, # of echoes: 14. Additional TSE T2 weighted image was acquired for delineation of deep gray matter nucleus.
2. TE=0 phase estimation: Due to the nonlinear phase evolution, fitting smaller number of echoes produces more accurate TE=0 phase. However, considering SNR of TE=0, fitting more number of GRE TE phase is beneficial. Thus the best number of echo for fitting must be selected compromising between these two terms. In practice we chose the maximum number of echo such that the resultant conductivity image does not contain visible nonlinear effect. The maximum TE was approximately up to 11ms~15ms depending on slices. By linear fitting, both TE=0 phase and ΔB0 map can be acquired
3. Conductivity reconstruction: Using acquired TE=0 phase, conductivity map can be reconstructed by 3D EPT process. In this study, we used weighted polynomial fitting method4 for 3D EPT process. During the calculation, the region of CSF and artery was excluded, as it produces high nonlinearity in the phase.
4. Susceptibility reconstruction: Using the acquired ΔB0, susceptibility map can be reconstructed by QSM5.
5. ΔTE map: ΔTE map was acquired for investigation of phase nonlinearity source. ΔTE map is a high pass filtered map of the difference map between TE=0 phasefitted by 12 echoes ~up to 25ms and TE=0 phasefitted by 3 echoes ~ up to 6ms , which is analogous to Δf (FDM) map that is used for myelin images6.
Result
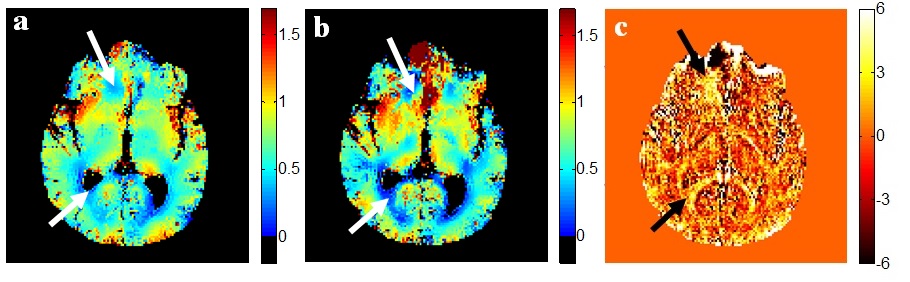
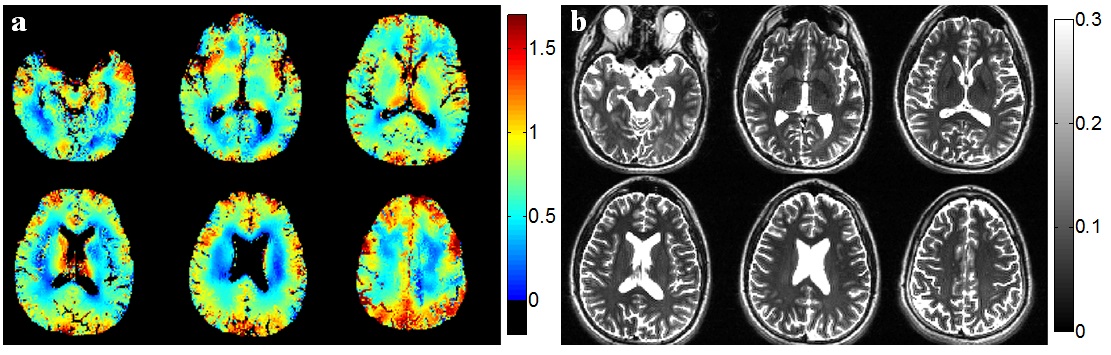
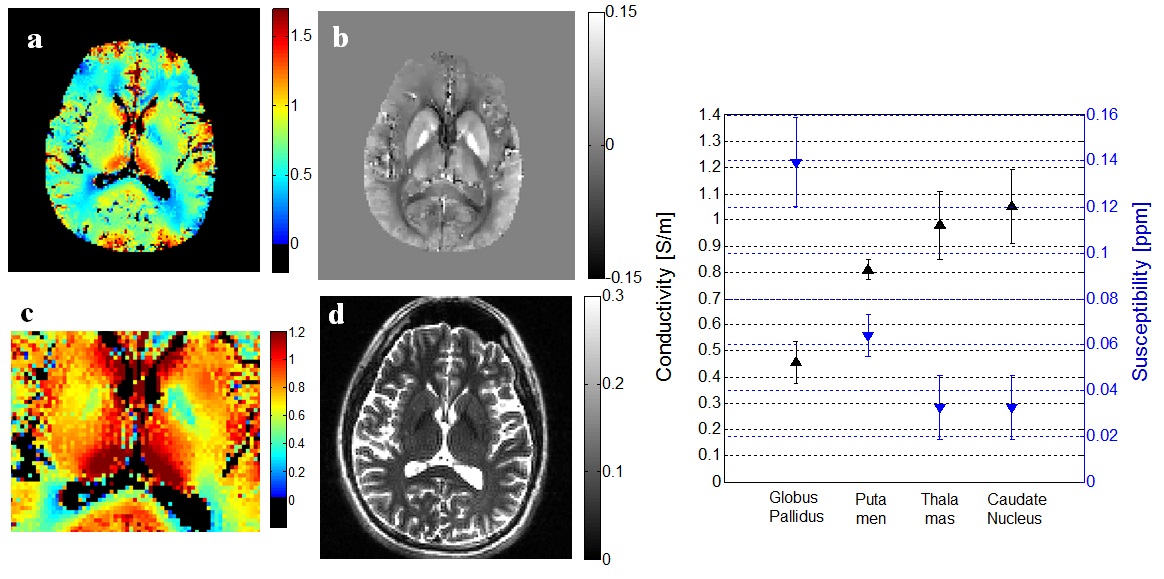
In Fig. 1, the effect of nonlinear phase source can be observed. The arrow in the superior region points to the effect due to ΔB0 source by sinus. The arrow in the inferior region points to the effect due to perpendicular fiber orientation. Because of these effects, the conductivity map reconstructed by fitting 2 echoes and by 12 echoes are different in these regions. The phase nonlinearity due to fiber orientation can be viewed in the ΔTE0 map, where the indicated regions have high values. In Fig. 2, reconstructed conductivity from different slices are displayed along with the T2 weighted images. For each slice, the choice of the number of TE for the fitting varied (3,3,4,5,5,5 echoes for the slices shown) In Fig. 3, simultaneous EPT (a), QSM (b) have been processed. Contrast in both susceptibility and conductivity within the DGMN can be seen. The graph shows the measured values for several regions. Note that this conductivity variation has also been observed previously.7
Discussion
Simultaneous QCSM map might be potentially useful for applications such as investigation of EM properties of blood2. The Laplacian operator needed for conductivity reconstruction requires very accurate phase estimation. Here the effect of phase nonlinearity, especially the fiber orientation is shown to be another major source of artifact in conductivity reconstruction. An automated optimized method should further be investigated.
Acknowledgements
No acknowledgement found.References
1. Dong-Hyun Kim, Narae Choi, Sung-Min Gho, et al. Simultaneous Imaging of In-vivo Conductivity and Susceptibility. Magn.Reson.Med. 2014;71:200-208
2. Sung-Min Gho, Jeawook Shin, Min-Oh Kim, et al. Simultaneous Quantitative Mapping of Conductivity and Susceptibility Using a Double-Echo UTE Sequence:Example Using a Hematoma Evolution Study. Magn.Reson.Med. 2016;76:214-221
3. Kang Hyun Ryu, Jaewook Shin, Hongpyo Lee, and Dong-Hyun Kim. Investigation of high B0 inhomogeneity effect in simultaneous conductivity and susceptibility imaging. 4th International Workshop on MRI Phase Contrast & Quantitative Susceptibility Mapping (QSM). 2016. Medical University of Graz, Austria, p136.
4. Joonsung Lee, Jaewook Shin, Dong-Hyun Kim. MR-based conductivity imaging using multiple receiver coils. Magn.Reson.Med. 2015;76:530-539
5. Liu.T, Wisnieff C, Lou M et al. Nonlinear formation of the magnetic field to source relationship for robust quantitative susceptibility mapping. Magn.Reson.Med. 2013;69(2):467-76
6. Wharton S, Bowtell R. Fiber orientation-dependent white matter contrast in gradient echo MRI. Proc Natl Acad Sci U S A 2012;109:18559–18564.
7. U.Katscher et al. Conductivity Determination of Deep Gray Matter Nuclei Utilizing Susceptibility-Based Delineation. 24th Scientific Meeting of the International Society of Magnetic Resonance in Medicine, Chinatown, Singapore, May 7-13, 2016. p3336
Figures