1944
On the feasibility of synthetic sodium MRI based on tissue conductivity1INM4, JARA-Faculty of Medicine, RWTH Aachen University, Aachen, Germany, Juelich, Germany, 2Institute of Neuroscience and Medicine-4, Forschungszentrum Juelich, Juelich, Germany
Synopsis
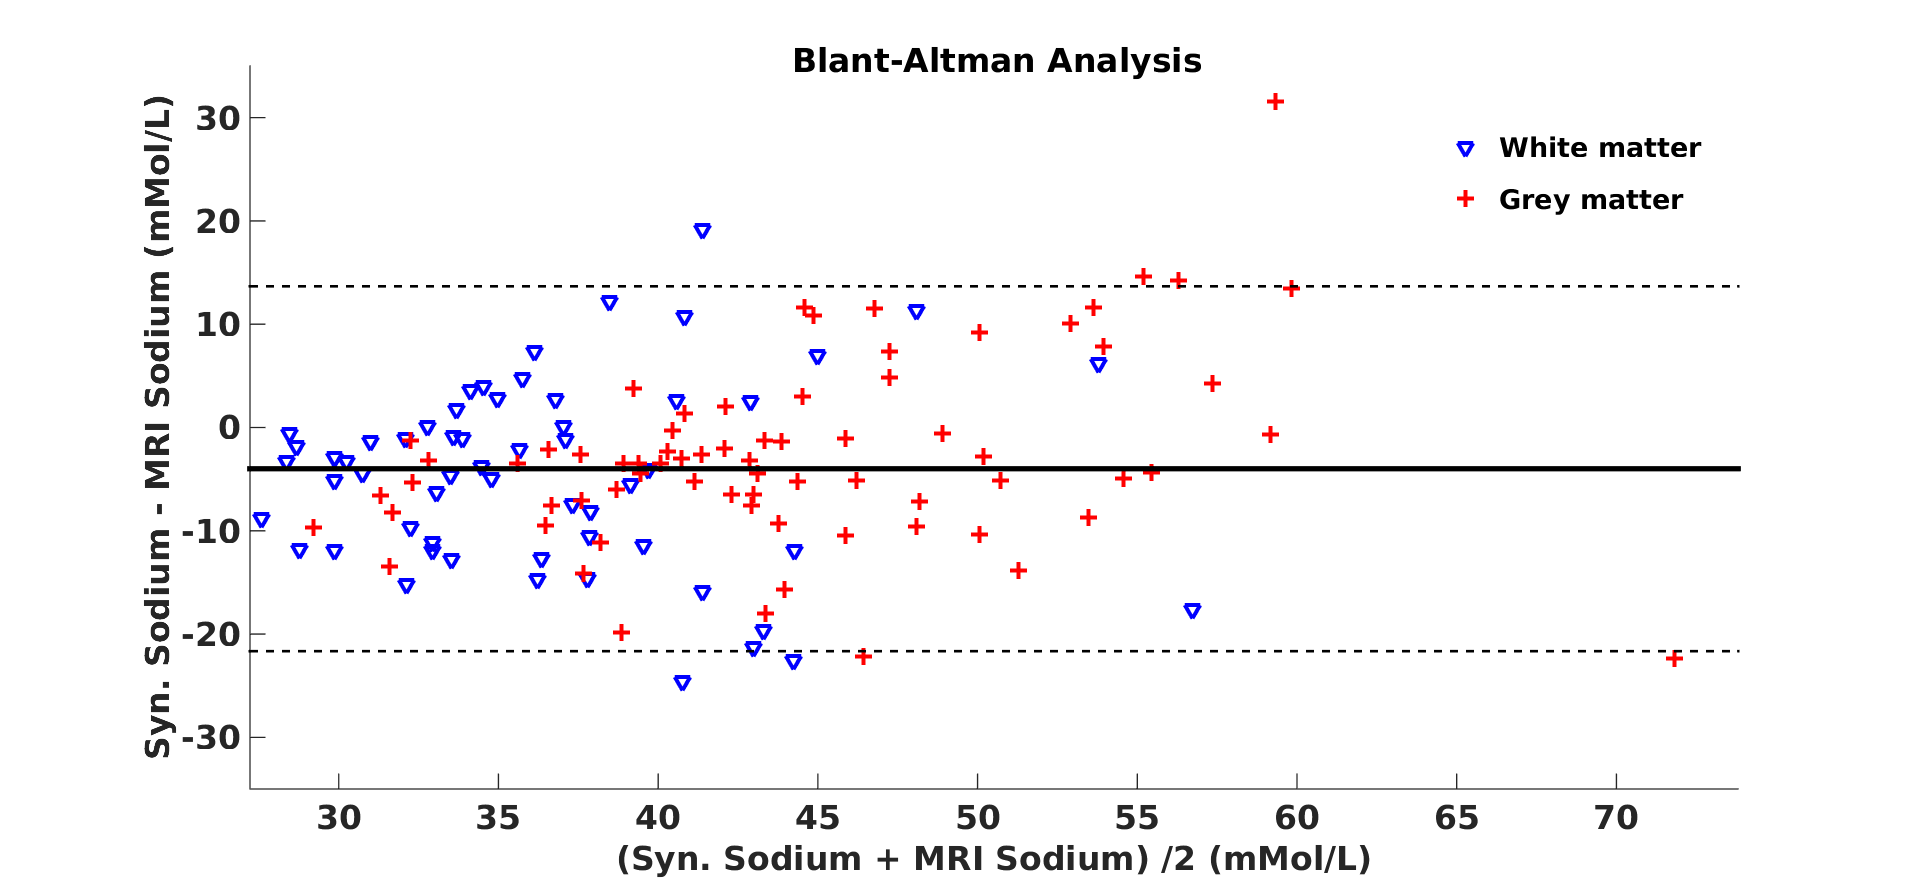
The recently proposed magnetic resonance electrical property tomography opens new opportunities for sodium ion characterisation. In this study, a model was built by measuring electrical conductivity and sodium MRI in different saline solutions. We exploit this interdependence with additional temperature correction to build a synthetic sodium brain map based on in vivo electrical conductivity. The results were compared to sodium MRI measurements. A statistically significant Pearson correlation (p<0.001; r=0.43) was observed between the two modalities while Bland-Altman analysis revealed discrepancies between them with a mean difference ~4mMol/L in whole brain. The proposed approach facilitates tissue sodium extraction.
Introduction
Sodium
MRI is subject of growing interest as it reflects the inherent
property of the tissue function and anatomy, providing crucial
biochemical and physiological information. Tissue sodium
concentration (TSC) can be used as a direct non-invasive biomarker
for pathology investigation due to its vital role in maintaining
osmoregulation, nerve impulse transmission, pH regulation and energy
production. However, due to its low natural abundance, low
gyromagnetic ratio and fast relaxation times compared to hydrogen proton, sodium detection
requires high field in addition to advanced MRI sequences with ultra
short echo times (1). Recently proposed models have described the
interdependence of tissue conductivity and sodium concentration (2).
At high frequency (>100MHz), conductivity is directly related to
sodium ion concentration, showing the same behaviour in human tissue
as observed in saline solutions (3). In this preliminary work, we
propose to exploit this biophysical model to build a synthetic TSC
brain map.
Material and Methods
For the
evaluation of conductivity and sodium mapping accuracy, a
multi-compartment cylinder containing 9 tubes filled with different
sodium (NaCl) concentration was used. Following MRI data acquisition
and post-processing, the mean value and standard deviation of sodium
concentration and electrical conductivity (σ) were calculated from
the region-of-interests (ROIs) placed within each tube. In addition,
the reference conductivity value of the same conductivity component
was acquired using an impedance probe (DAK-12, SPEAG, Switzerland).
Eight healthy volunteers including three females (25-32 years old),
were scanned at two different field strength, i.e., at 3T scanner
(Siemens Healthcare, Erlangen) using a 12-channel phased array head
coil and a home–assembled 4T scanner (Siemens Syngo, Erlangen)
using a double-tuned 1H/23Na
transmit-receive RF birdcage coil (RAPID Biomedical, Wurzburg). 3D
true-FISP scans were acquired at 3T for phase based conductivity
reconstruction with the following parameters: TR=4.8ms; TE=2.4ms;
matrix=320×320×104; 1.2mm isotropic resolution; FA=45°; 3
averages; TA=11:22min. In the present study, we adopted the transmit
and receive (transceive) phase to extract electrical conductivity, σ,
using the following equation: σ=Δφ/2ωµ0,
where φ denotes transceive phase, ω Larmor frequency, μ0 vacuum
magnetic permeability, and
Δ Laplacian operator (4,5). To reduce artefacts arising from boundary
voxels, a 3D local polynomial fitting method was implemented (6). 3D
sodium images were acquired using the twisted projection imaging
(TPI) sequence (7). Imaging parameters were: TR=160ms; TE=0.4m;
matrix=643;
3.44mm, isotropic nominal resolution; 5120 scanning projections; 2
averages; TA=25min. Additional RF transmit maps (B1Tx)
were acquired at the sodium frequency to correct B1Tx inhomogeneity (8). To facilitate the co-registration to individual
brain anatomy, a 1mm isotropic MPRAGE image was acquired. For each
subject, TSC and conductivity maps were co-registered and spatially
normalized to MNI space using SPM (9). Different ROIs derived from
MNI template, were defined within a set of areas including frontal,
occipital, parietal and temporal grey matter (GM) and white matter
(WM). The brain synthetic TSC (sTSC) was extracted based on saline
solution phantom model after temperature correction: sTSC=A∙σ+B,
where A and B are constants. To investigate the association between
sTSC and sodium MRI, Pearson correlation and Bland–Altman analysis
was used.Results
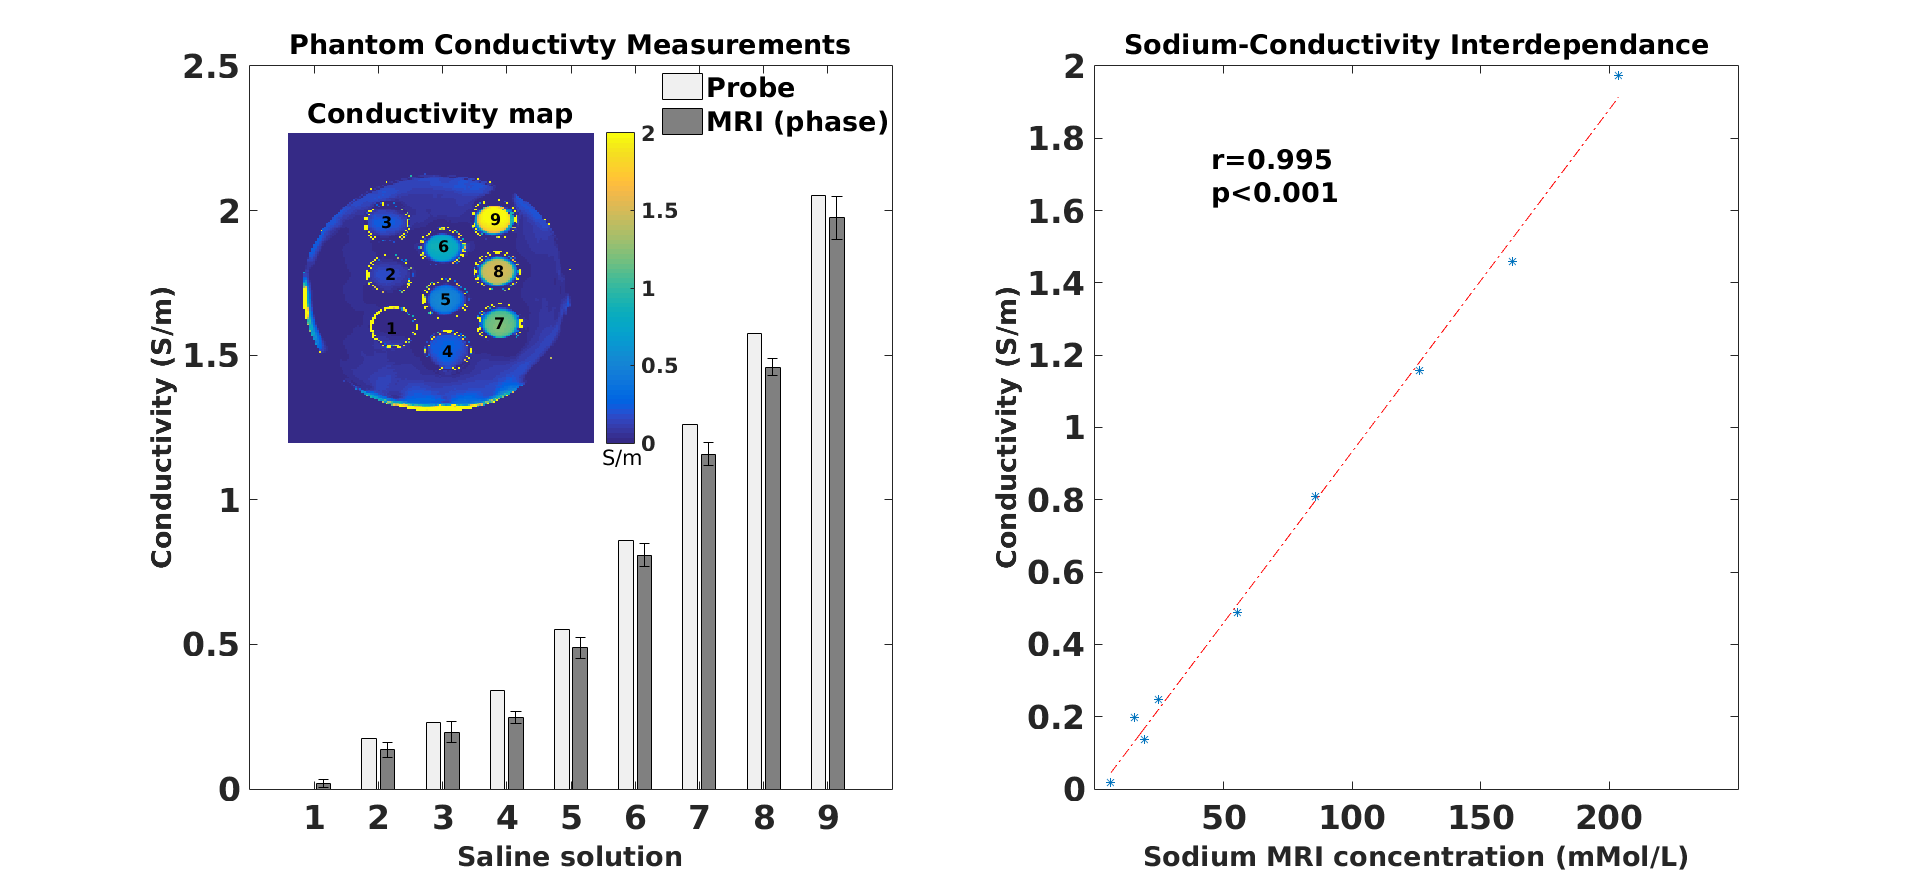
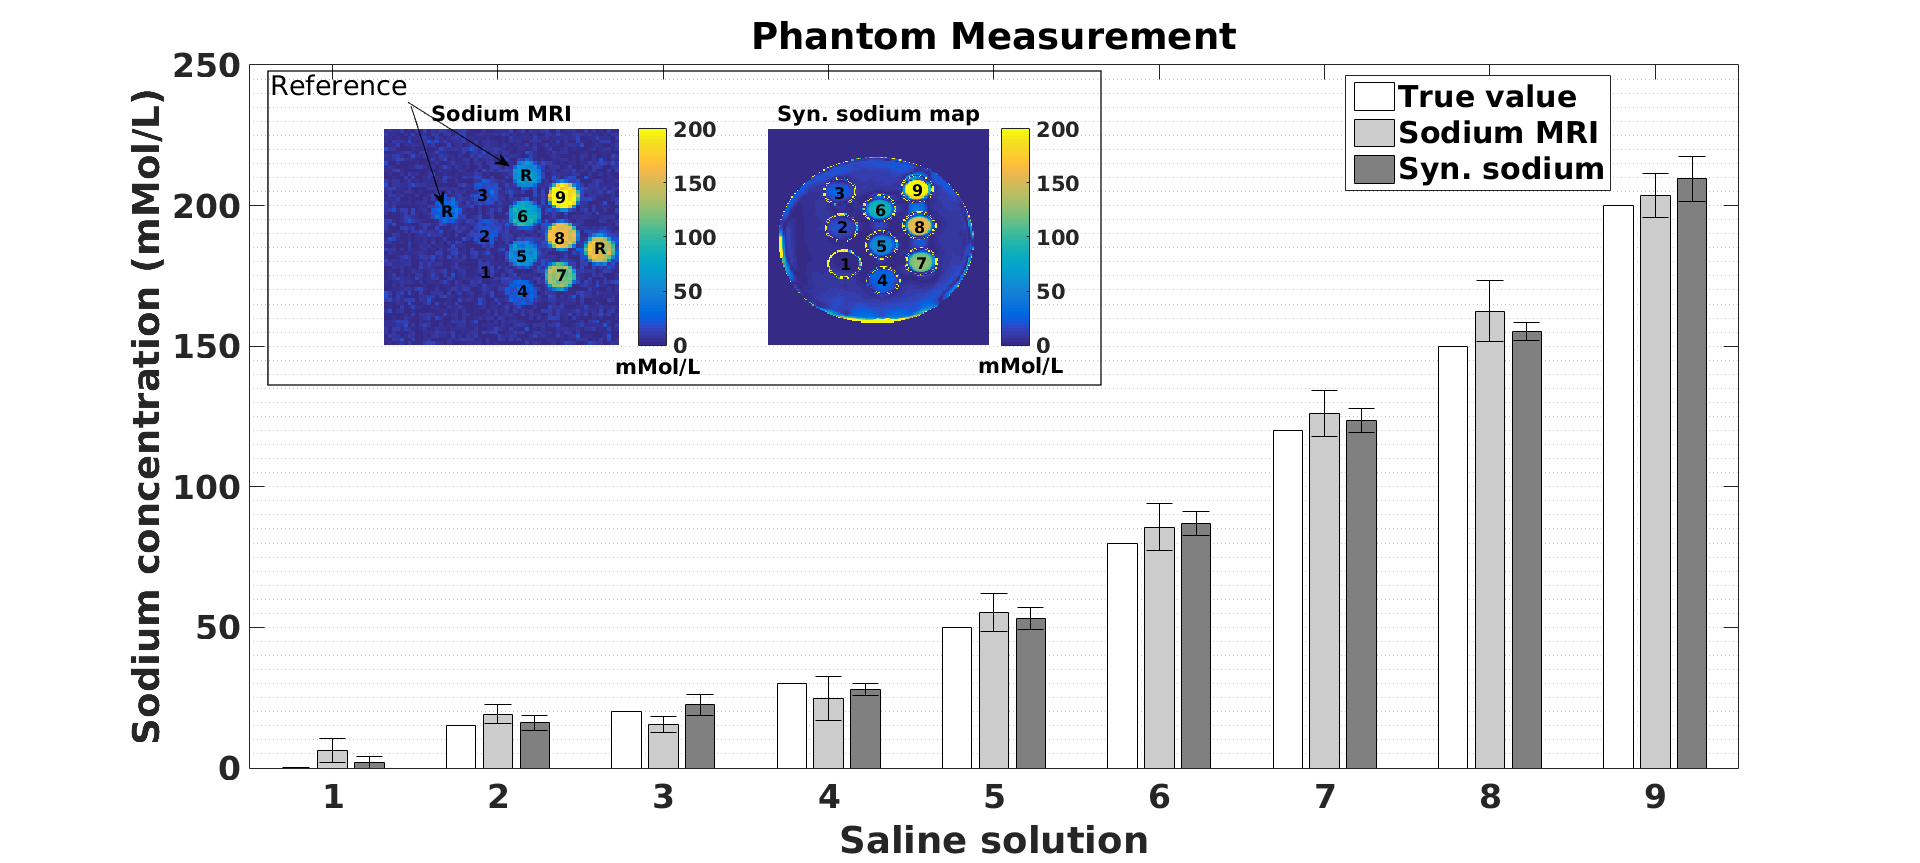
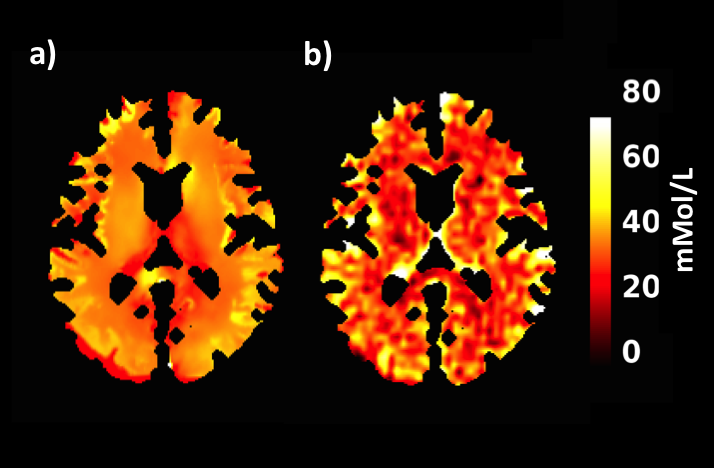
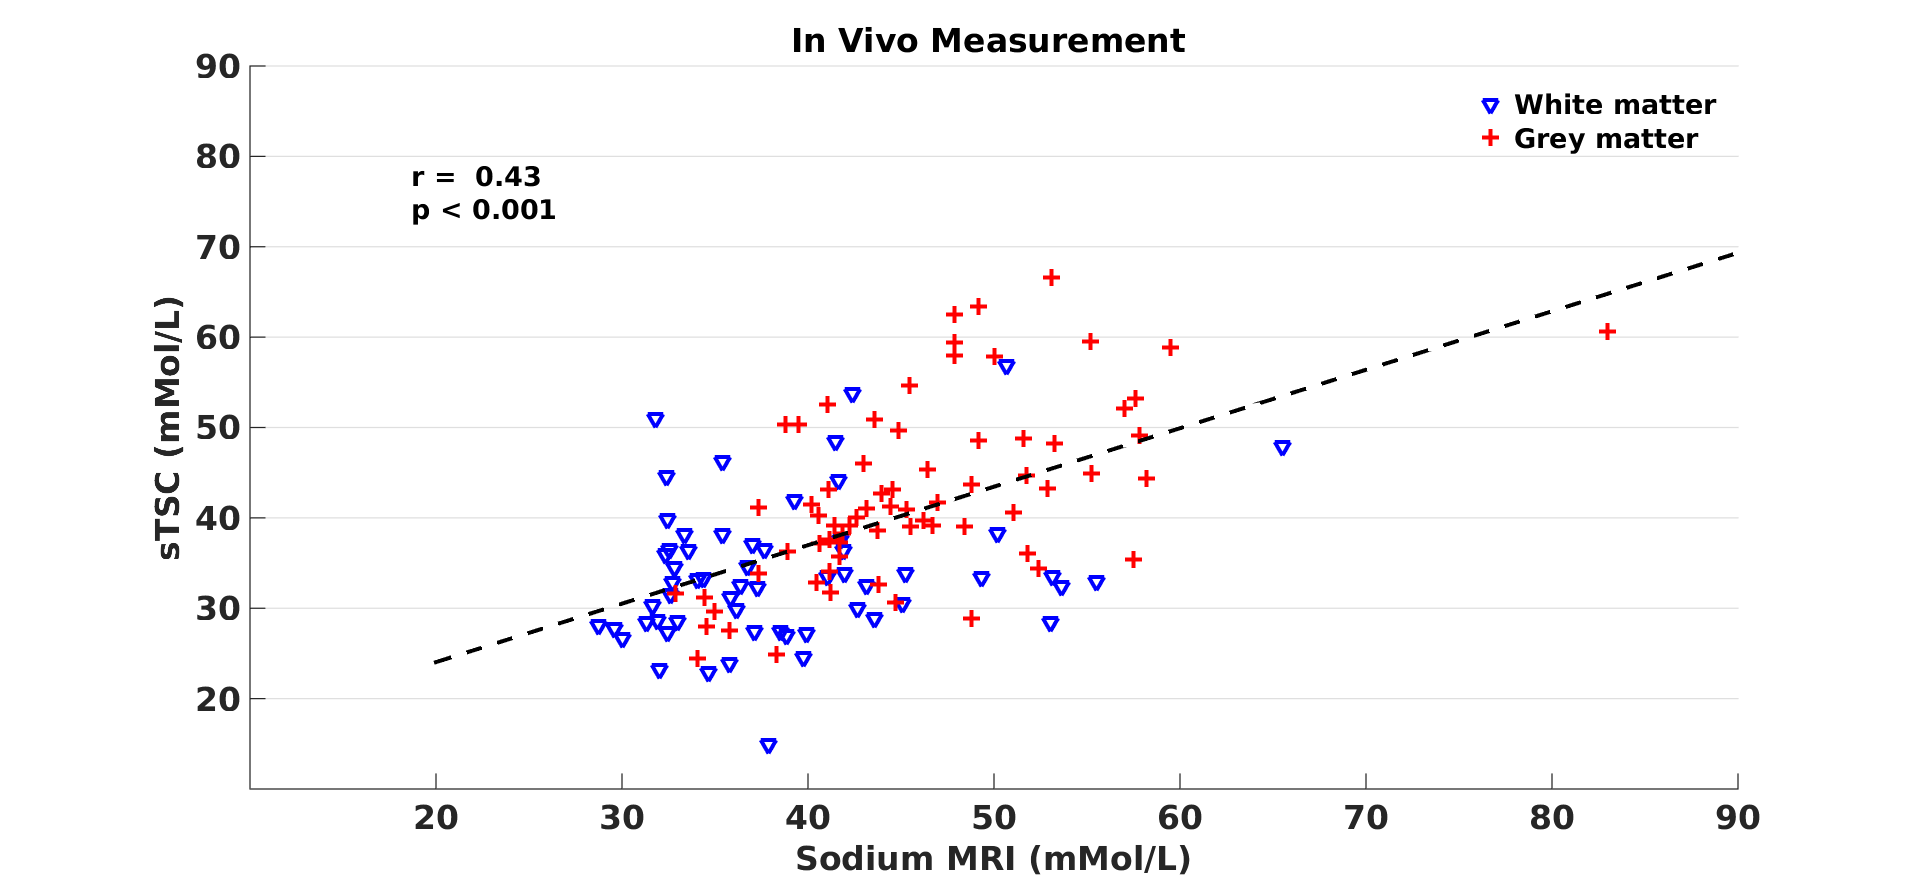
Conductivity mapping was found to be in good agreement with probe measurement (Figure-1a). Including all tubes, linear regression yields sTSC=72.91×σ−3.40 after body temperature correction (37°C). The conductivity extracted sodium map was largely comparable to sodium MRI measurement (Figure-2). Significantly high resolution and SNR are obtained using synthetic sodium reconstruction (Figure-2, top panel). Across subjects, the sTSC map statistically correlated with sodium MRI. Figure-3a) and -3b) show the brain map in a representative subject using sTSC and direct sodium MRI measurement, respectively. In addition, detailed in vivo sodium concentrations of different brain ROIs were also explored in eight different subjects (r=0.43, p<0.001, Figure-4). Bland-Altman analysis revealed discrepancies with a mean difference between both methods ~4mMol/L with most differences located within the 95% confidence interval (Figure-5).Discussion and Conclusion
In the present study, we demonstrated the feasibility of extracting a TSC map based on tissue conductivity at 3T using a body temperature saline solution model. Temperature correction is required because a constant bias dramatically influences the model. In contrast with phantom results, in vivo correlations revealed a discrepancy between direct and synthetic MRI mapping, which can be attributed to low resolution of sodium MRI and/or use of saline solutions rather than gels. Additionally, sodium MRI reflects the total combination of intracellular and extracellular sodium in the tissue, while according to previous report (10), due to the membranes capacitance isolation effects, electrical conductivity is highly extracellular sodium weighted which may cause systematic errors. The suitability of the proposed approach for clinical routines facilitating high-quality sodium mapping remains to be explored.Acknowledgements
This work was supported by the Helmholtz Alliance ICEMED - Imaging and Curing Environmental Metabolic Diseases.References
1. Boada FE, LaVerde G, Jungreis C, Nemoto E, Tanase C, Hancu I. Loss of cell ion homeostasis and cell viability in the brain: what sodium MRI can tell us. Curr. Top. Dev. Biol. 2005;70:77–101.
2. van Lier ALHMW, Paul W. de B, Sebastian A. A, Peter R. L, Jan J.W. L, Cornelis A.T van den B, Andrew G. W. 23Na-MRI and EPT: Are sodium co ncentration and electri cal conductivity at 298 MHz (7T) related? In: ISMRM (International Society Magnetic Resonance in Medicine); 2013. p. 0115
3. Pethig R. Dielectric Properties of Biological Materials: Biophysical and Medical Applications. Electr. Insul. IEEE Trans. On 1984;EI-19:453–474.
4. Katscher U, Voigt T, Findeklee C, Vernickel P, Nehrke K, Dössel O. Determination of electric conductivity and local SAR via B1 mapping. IEEE Trans. Med. Imaging 2009;28:1365–1374.
5. Shin J, Kim MJ, Lee J, Nam Y, Kim M-O, Choi N, Kim S, Kim D-H. Initial study on in vivo conductivity mapping of breast cancer using MRI. J. Magn. Reson. Imaging JMRI 2015;42:371–378.
6. Katscher U, Djamshidi K, Voigt T, Ivancevic M, Abe H, Newstead G, Keupp J, Philips Research. Estimation of Breast Tumor Conductivity using Parabolic Phase Fitting. In: ISMRM (International Society Magnetic Resonance in Medicine); 2012. p. 3482.
7. Romanzetti S, Mirkes CC, Fiege DP, Celik A, Felder J, Shah NJ. Mapping tissue sodium concentration in the human brain: a comparison of MR sequences at 9.4Tesla. NeuroImage 2014;96:44–53.
8. Sacolick LI, Wiesinger F, Hancu I, Vogel MW. B1 mapping by Bloch-Siegert shift. Magn. Reson. Med. 2010;63:1315–1322.
9. Ashburner J. Computational anatomy with the SPM software. Magn. Reson. Imaging 2009;27:1163–1174. 10. Schwan HP, Li K. Capacity and Conductivity of Body Tissues at Ultrahigh Frequencies. Proc. IRE 1953;41:1735–1740.
Figures