1943
Combination of MT and R2* measurements to distinguish between contributions of semisolids and iron to R11Advanced MRI Section, LFMI, NINDS, National Institutes of Health, Bethesda, MD, United States, 2Center for Functional and Molecular Imaging, Georgetown University Medical Center, Washington, DC, United States
Synopsis
In human brain, the apparent longitudinal relaxation rate (R1) primarily originates from magnetization transfer (MT) effects associated with the macromolecular 1H-proton fraction (f), although in some regions the iron concentration may contribute as well (Rooney, 2007). To quantify their relative contributions at 7 T, we measured f and R1 of water protons (R1,WP) corrected for MT effects using a pulsed, transient MT approach (van Gelderen, 2016). The iron concentration was taken from literature and correlated with R2*. The results indicate that the combination of R2* and MT measurements may provide a sensitive means to quantify R1,WP, f and iron concentration.
Introduction
Previous studies have shown that R1 contrast in brain is predominantly determined by the macromolecular 1H-proton (MP) fraction f 1,2. Therefore, methods 3–5 based on monitoring the longitudinal relaxation of water 1H-protons (WPs) followed by a two pool, i.e. WPs and MPs, exchange model analysis have been used 2,4,5 to estimate f. However, these studies generally require extensive experiments to solve for the unknown parameters in the two pool model, often requiring a number of simplifying assumptions 3–5. These assumptions may not be correct in regions with high iron concentration. For example, iron may affect the intrinsic R1 of WP (R1,WP) in the absence of MT effects. Here we applied a previously introduced pulsed MT method to measure R1,WP and correlated it with R2* as a surrogate of iron concentration, as well with putative iron concentrations derived from previously published histological measurements 6,7.Methods
Seven human subjects (ages 23-49, average age 32.3, 3 females) were scanned under an IRB approval on a 7 T Siemens scanner. The MP fraction was determined using pulsed saturation recovery experiments, followed by two pool exchange model 5 analysis:
$$FS_{WP}(t)=1- \frac{M_{WP}(t)}{M_{WP}(\infty)}=a_{1}e^{-\lambda_{1}t}+a_{2}e^{-\lambda_{2}t}$$[1]
$$\lambda_{1,2}=(R_{1,WP}+R_{1,MP}+k_{MW}+k_{WM}\pm\sqrt{(R_{1,MP}-R_{1,WP}+k_{MW}-k_{WM})^{2}+4k_{MW}k_{WM}})/2$$[2]
$$a_{1,2}=\pm\frac{FS_{WP}(0)(R_{1,WP}+k_{WM}-\lambda_{2,1})-FS_{MP}(0)k_{WM}}{\lambda_{1}-\lambda_{2}}$$[3]
$$(1-f)k_{WM}=fk_{MW}$$[4]
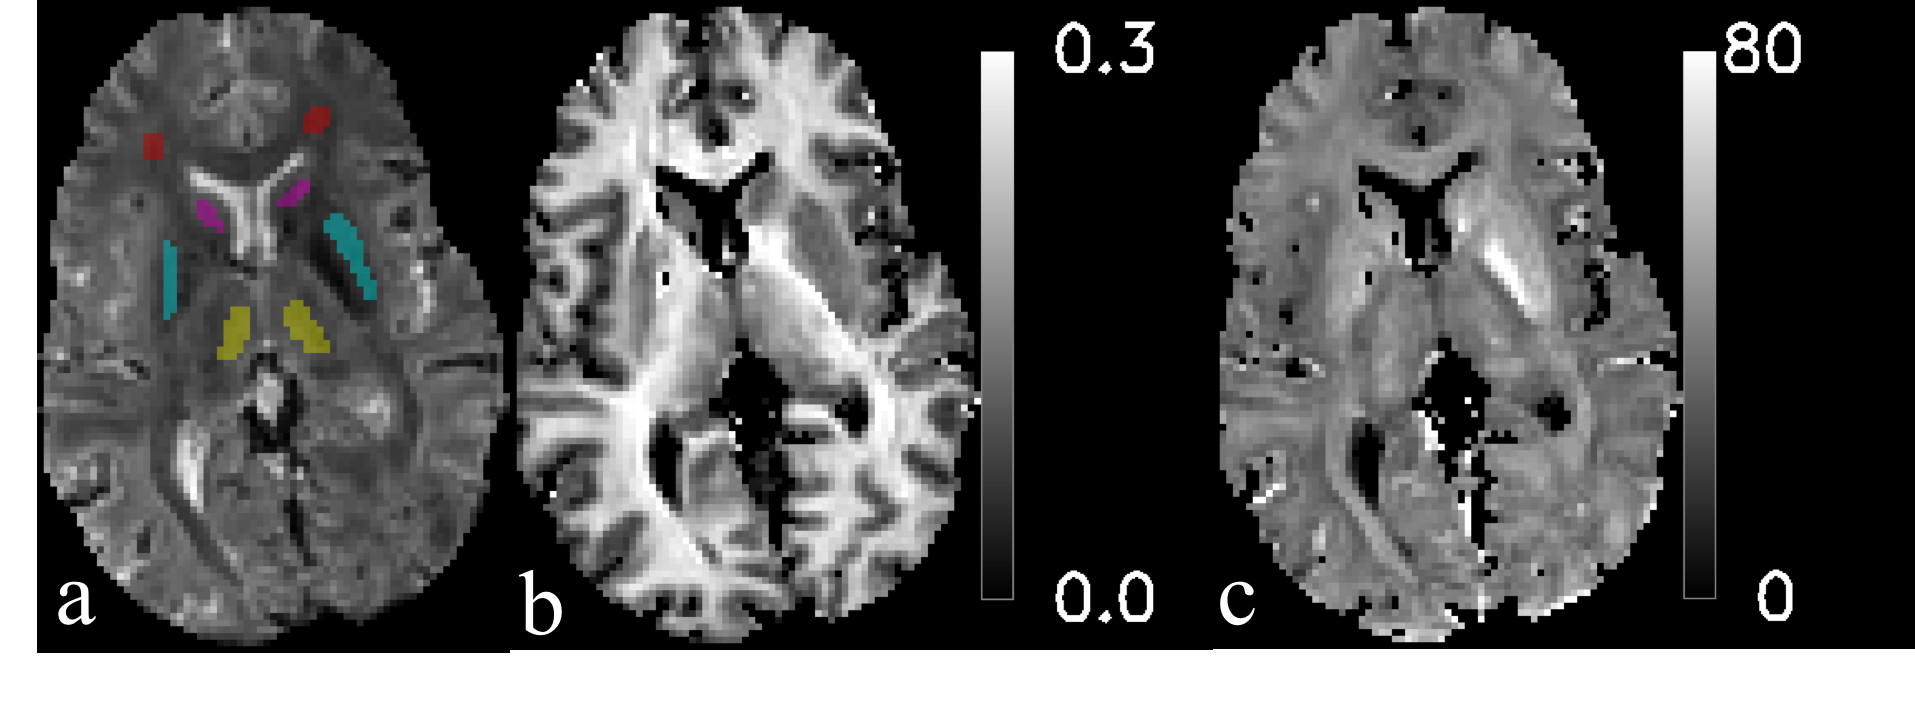
Here, M is the longitudinal magnetization, R1 is its relaxation rate, FS is fractional saturation, λ1 and λ2 are fast and slow rate constants of the saturation recovery, and a1 and a2 are the corresponding amplitudes. kWM and kMW are the MT exchange rates between two pools. f is the MP fraction. An inversion recovery (IR) or a composite saturation recovery (SR) pulse, were used to differentially modulate the two pools, followed by EPI acquisition at variable delay t to sample FSWP(t). The IR pulse was an adiabatic hyperbolic secant pulse, with a duration of 5.12 ms, an energy of 0.51 (μT)2s, a B1 amplitude of 833 Hz and a β of 1400 s-1 8. The SR pulse had a duration of 6 ms and consisted of a train of 16 hard pulses with angles 60°, -120°, 120°, -120°, ….120°, -60°, with a B1 amplitude of 833 Hz 2. The delay times for the IR experiment were 6, 63, 144, 282 and 1200 ms, for the SR they were: 7, 127, 258, 401 and 559 ms. The field-of-view was 240x180 mm. The echo time (TE) for EPI was 24 ms. The TRs were 6 and 3 s for IR and SR experiments respectively. The use of two different preparation pulses facilitated fitting of λ1 and λ2, using Eq. [1], and furthermore allowed extraction of kMW, kWM, f, and R1,WP, using Eqs. [2-3], with assuming R1,MP = 2 s-1 and FSMP(0) = 0.93 for the SR experiment as determined previously 2. R2* was measured using a MGRE sequence with TR of 1 s, TE of 3.2 ms, 28 even (same gradient polarity) echoes with spacing of 1.54 ms, and the same resolution and field-of-view as the EPI scans. A single exponential decay for the transverse magnetization: $$$M_{\bot}(t)=M_{\bot0}e^{-R_{2}^{*}t}$$$, was fitted to the magnitude data of different echoes, where $$$M_{\bot0}=M_{\bot}(0)$$$. Only echo times between 7.8 ms to 44.8 ms were used for the fitting, to avoid influence from the fast decaying myelin water component 9. Four ROI’s were hand drawn, in Caudate nucleus (CN), Putaman (PUT), Thalamus (TH) and Frontal white matter (FWM), as exemplified by Fig. 1. The iron concentration in the four ROI’s was calculated using formulae reported previously 6,7. The subject-wise ROI-averaged correlations between R1,WP and the iron concentration, between R1,WP and R2*, and between R2* and the iron concentration were studied using linear regression.
Results and Discussion
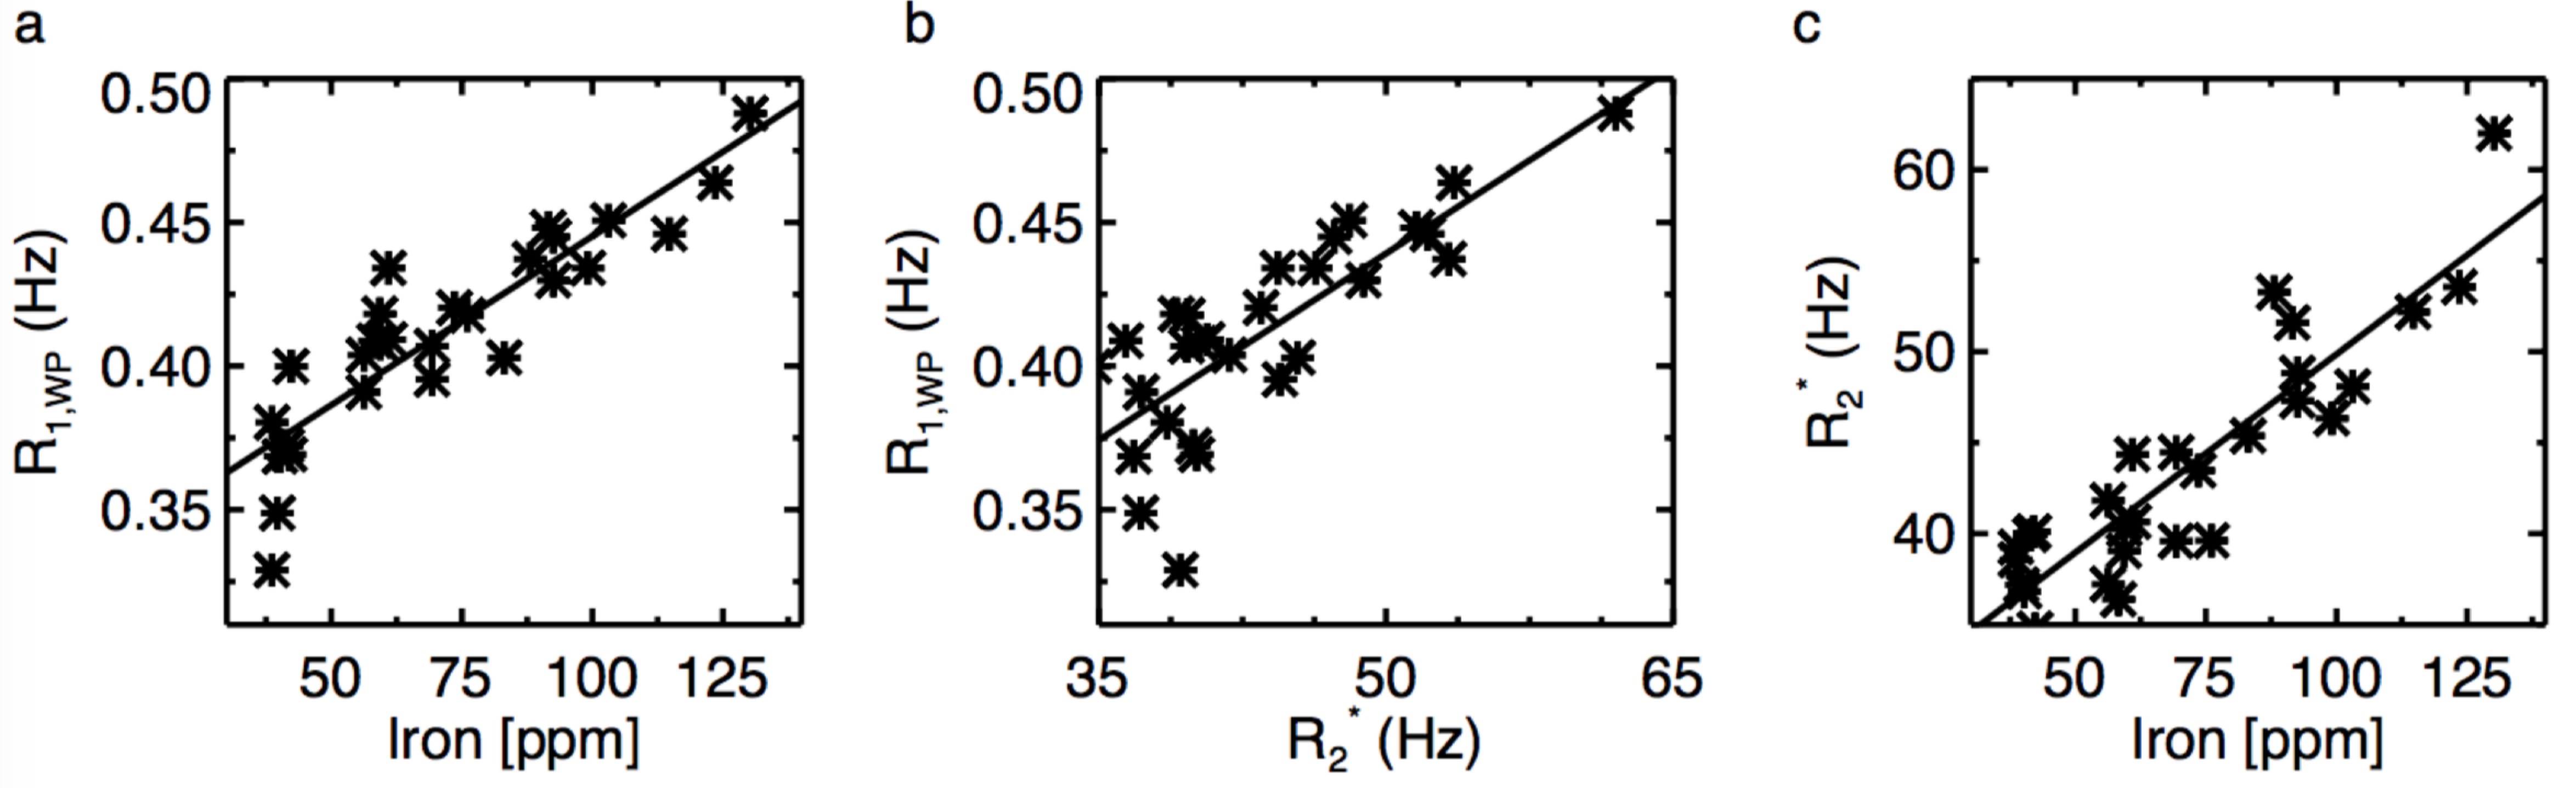
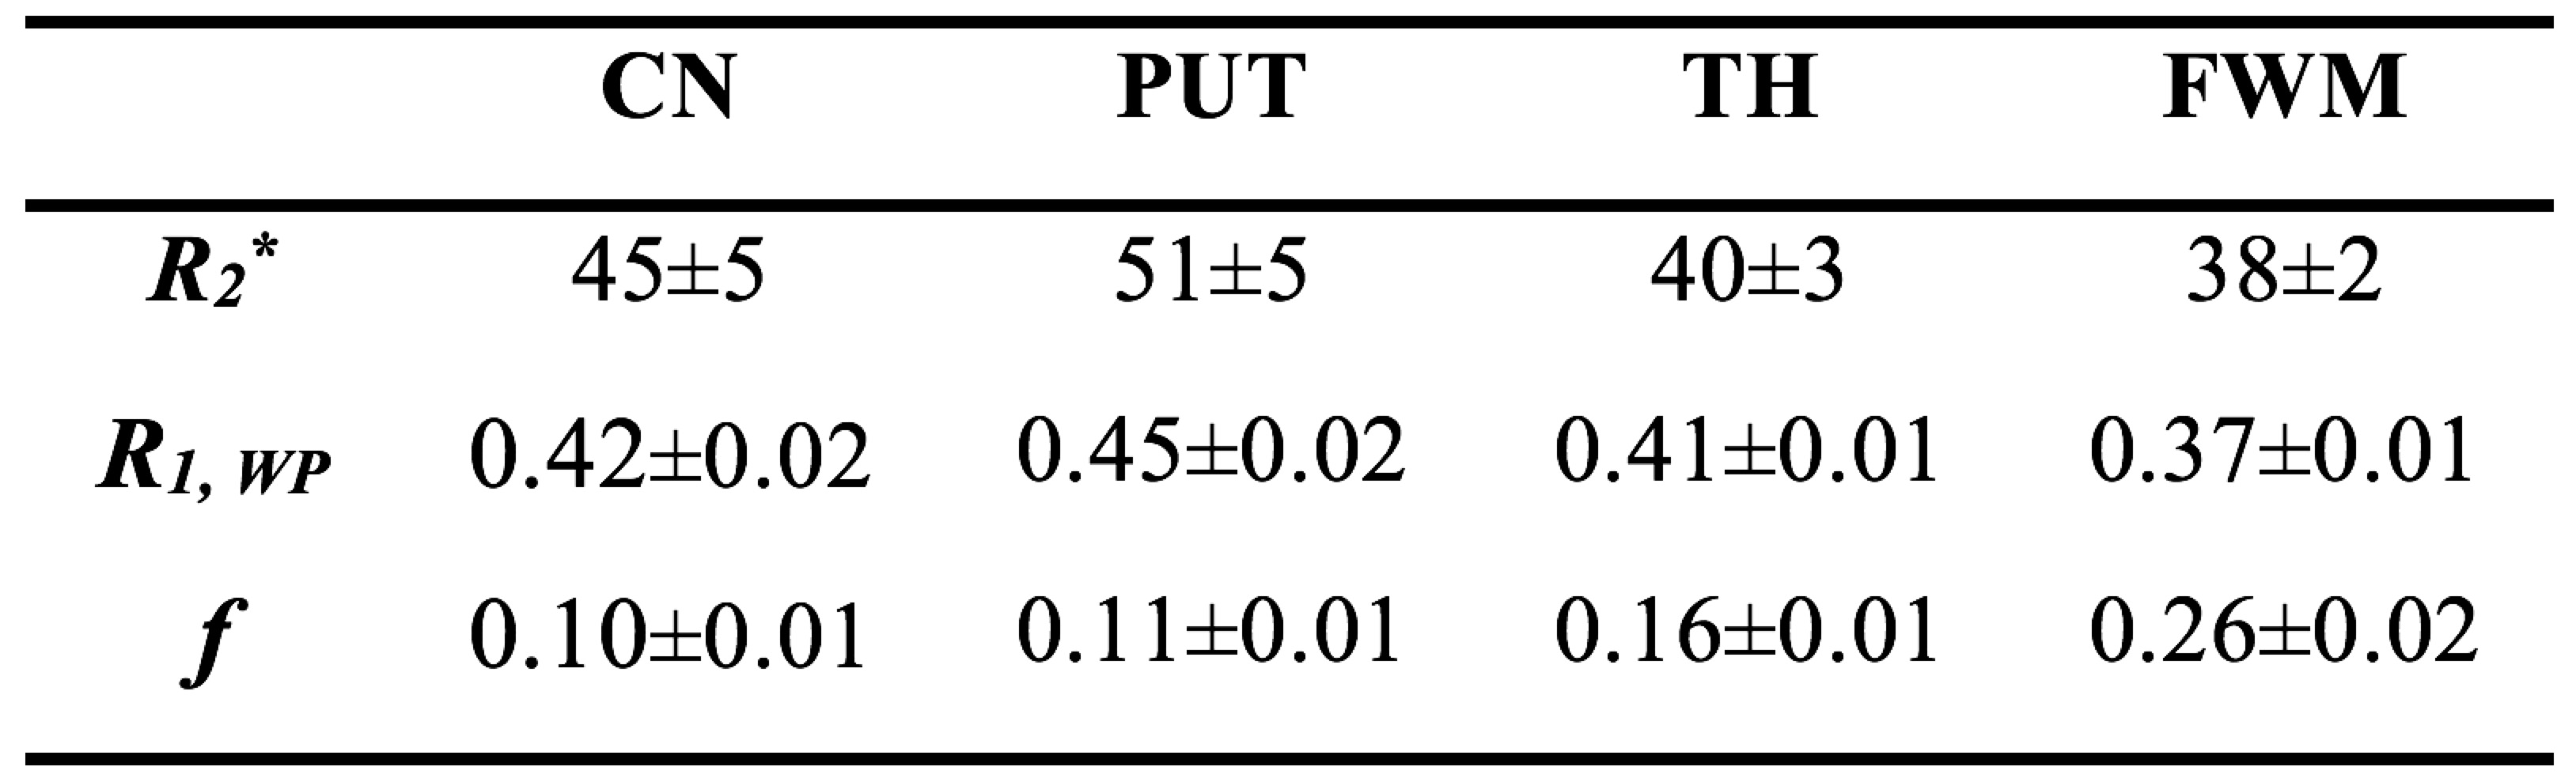
Table 1 shows the fitting results of R2*, f and R1,WP. Linear regression of R2* with the iron concentration gives: $$$R_{2}^{*}(C_{Fe})=0.218C_{Fe}+28.1$$$ with adjusted R2 of 0.79, where is the fresh weight concentration of non-heme iron in parts per million (ppm). Linear regression of R1,WP with the iron concentration gives: $$$R_{1,WP}(C_{Fe})=0.00118C_{Fe}+0.33$$$ with adjusted R2 of 0.78. And linear regression of R1,WP with R2* gives: $$$R_{1,WP}(R_{2}^{*})=0.00433R_{2}^{*}+0.22$$$ with adjusted R2 of 0.60. These three correlations are shown in Fig. 2. The results show that R2* is correlated with the iron concentration, consistent with previous reported linear correlation of R2* with iron 10–12. Importantly R2* can be used to reliably estimate R1,WP to reduce the number of unknowns in Eqs. [1-4] and can possibly be used to facilitate the extraction of MP fraction.Acknowledgements
This research was supported by the Intramural Research Program of the National Institutes of Health, National Institute of Neurological Disorders and Stroke (NS 002990-15).References
1. Rooney WD, Johnson G, Li X, Cohen ER, Kim S-GG, Ugurbil K, Springer CS. Magnetic field and tissue dependencies of human brain longitudinal 1H2O relaxation in vivo. Magn. Reson. Med. [Internet] 2007;57:308–318. doi: 10.1002/mrm.21122.
2. van Gelderen P, Jiang X, Duyn JH. Effects of magnetization transfer on T1 contrast in human brain white matter. Neuroimage [Internet] 2015;128:85–95. doi: 10.1016/j.neuroimage.2015.12.032.
3. van Gelderen P, Jiang X, Duyn JH. Rapid measurement of brain macromolecular proton fraction with transient saturation transfer MRI. Magn. Reson. Med. [Internet] 2016:n/a--n/a. doi: 10.1002/mrm.26304.
4. Dortch RD, Moore J, Li K, Jankiewicz M, Gochberg DF, Hirtle JA, Gore JC, Smith SA. Quantitative magnetization transfer imaging of human brain at 7T. Neuroimage 2013;64:640–649. doi: 10.1016/j.neuroimage.2012.08.047.
5. Gochberg DF, Gore JC. Quantitative magnetization transfer imaging via selective inversion recovery with short repetition times. Magn. Reson. Med. 2007;57:437–441. doi: 10.1002/mrm.21143.
6. Adisetiyo V, Jensen JH, Ramani A, Tabesh A, Di Martino A, Fieremans E, Castellanos FX, Helpern JA. In vivo assessment of age-related brain iron differences by magnetic field correlation imaging. J. Magn. Reson. Imaging 2012;36:322–331. doi: 10.1002/jmri.23631.
7. Hallgren B, Sourander P. The Effect of Age on the Non-Haemin Iron in the Human Brain. J. Neurochem. [Internet] 1958;3:41–51. doi: 10.1111/j.1471-4159.1958.tb12607.x.
8. Tannús A, Garwood M, Tannus A, Garwood M. Adiabatic pulses. In: NMR in Biomedicine. Vol. 10. ; 1997. pp. 423–434. doi: 10.1002/(SICI)1099-1492(199712)10:8<423::AID-NBM488>3.0.CO;2-X.
9. Sati P, van Gelderen P, Silva AC, Reich DS, Merkle H, de Zwart JA, Duyn JH. Micro-compartment specific T2? relaxation in the brain. Neuroimage 2013;77:268–278. doi: 10.1016/j.neuroimage.2013.03.005.
10. Gelman N, Gorell JM, Barker PB, Savage RM, Spickler EM, Windham JP, Knight R a. MR imaging of human brain at 3.0 T: preliminary report on transverse relaxation rates and relation to estimated iron content. Radiology [Internet] 1999;210:759–767. doi: 10.1148/radiology.210.3.r99fe41759.
11. Martin WRW, Wieler M, Gee M. Midbrain iron content in early Parkinson disease: A potential biomarker of disease status. Neurology 2008;70:1411–1417. doi: 10.1212/01.wnl.0000286384.31050.b5.
12. Langkammer C, Krebs N, Goessler W, Scheurer E, Ebner F, Yen K, Fazekas F, Ropele S. Quantitative MR Imaging of Brain Iron?: A Postmortem Validation Study. Radiology [Internet] 2010;257:455–462. doi: 10.1148/radiol.10100495.
Figures