1941
Cause of death or caused by death: Differentiation of thromboemboli and post-mortem clots using quantitative MRI1Ludwig Boltzmann Institute for Clinical Forensic Imaging, Graz, Austria, 2BioTechMed, Graz, Austria, 3Institute of Pathology, Medical University Graz, Graz, Austria, 4Institute of Medical Engineering, Graz University of Technology, Graz, Austria, 5Institute of Forensic Medicine, Medical University Graz, Graz, Austria
Synopsis
MRI is increasingly being used in post-mortem examinations to assist in determining cause of death. Post-mortem changes, such as the formation of post-mortem clots (PMC), present a specific challenge in forensic imaging where differentiation between these alterations and pathological findings (e.g. thromboemboli) is essential. This work imaged thromboemboli and PMC samples collected during autopsy at 3T. K-means clustering was applied to analyse voxel-grouping in the resulting quantitative data. Clusters specific to a single clot type were identified in 3 of the 4 samples. Preliminary findings indicated the existence of at least one common differentiating cluster specific to PMC.
Purpose
Post-mortem investigations increasingly involve examinations using MRI. Especially for the investigation of cardiac causes of death, post-mortem MRI (PMMR) has a compelling relevance due to its soft tissue contrast. Approximately 60% of sudden coronary deaths are caused by coronary thrombosis,1 making the examination and characterisation of thromboemboli in a post-mortem context extremely important. A challenge specific to these examinations are changes in the composition and appearance of blood due to decomposition and post-mortem alterations, which are otherwise not observed in a clinical setting. One such alteration is the formation of post-mortem clots (PMC) which need to be carefully distinguished from ante-mortem thromboemboli. Multi-parametric quantitative MRI has previously been applied to characterise various types of thromboemboli extracted from patients with pulmonary embolism.2 This motivated the current work which sought to differentiate between ante-mortem thromboemboli, a potential cause of death, and PMC through multivariate analysis of T1, T2 and T2*.Methods
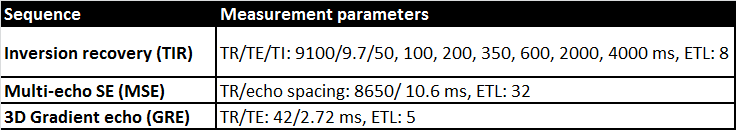
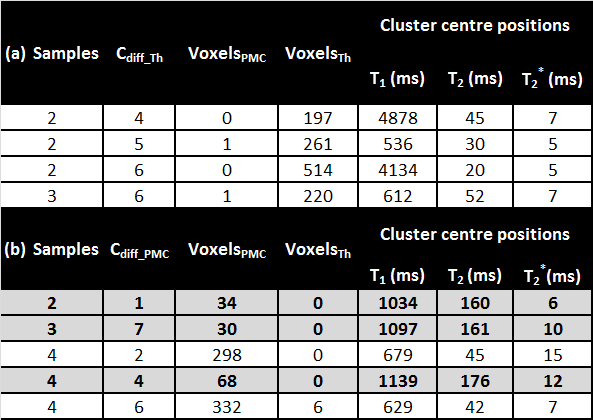
Sample pairs (n=4), consisting of a thromboembolus and a PMC from the same cadaver, were collected during pathological autopsies. Samples were macroscopically classified by a pathology resident. Within 24 hours of extraction, sample pairs were imaged at approximately 23°C at 3T (Skyra, Siemens AG, Germany) in test tubes using a 1-channel Tx/Rx mouse coil (RAPID Biomedical). Inversion recovery, multi-echo SE and gradient echo sequences were used to acquire quantitative MRI data (voxel size: 0.59x0.59x3mm³) (Table 1). Data analysis was performed in Matlab (R2012b) and RStudio. Quantitative maps were calculated by fitting data mono-exponentially (T1, T2 & T2*). Sample-wise clustering using k-means (k=10) was applied to identify voxel clusters with similar relaxation properties. For each sample pair, cluster membership was compared with the known clot type (thromboembolus/PMC) to identify differentiating clusters (Cdiff). Cdiff were defined as clusters containing only a single clot type (>98%, nvoxel). Cluster centres were compared across samples to investigate a general multivariate model based on T1, T2, T2* for the differentiation of thromboemboli from PMC.Results
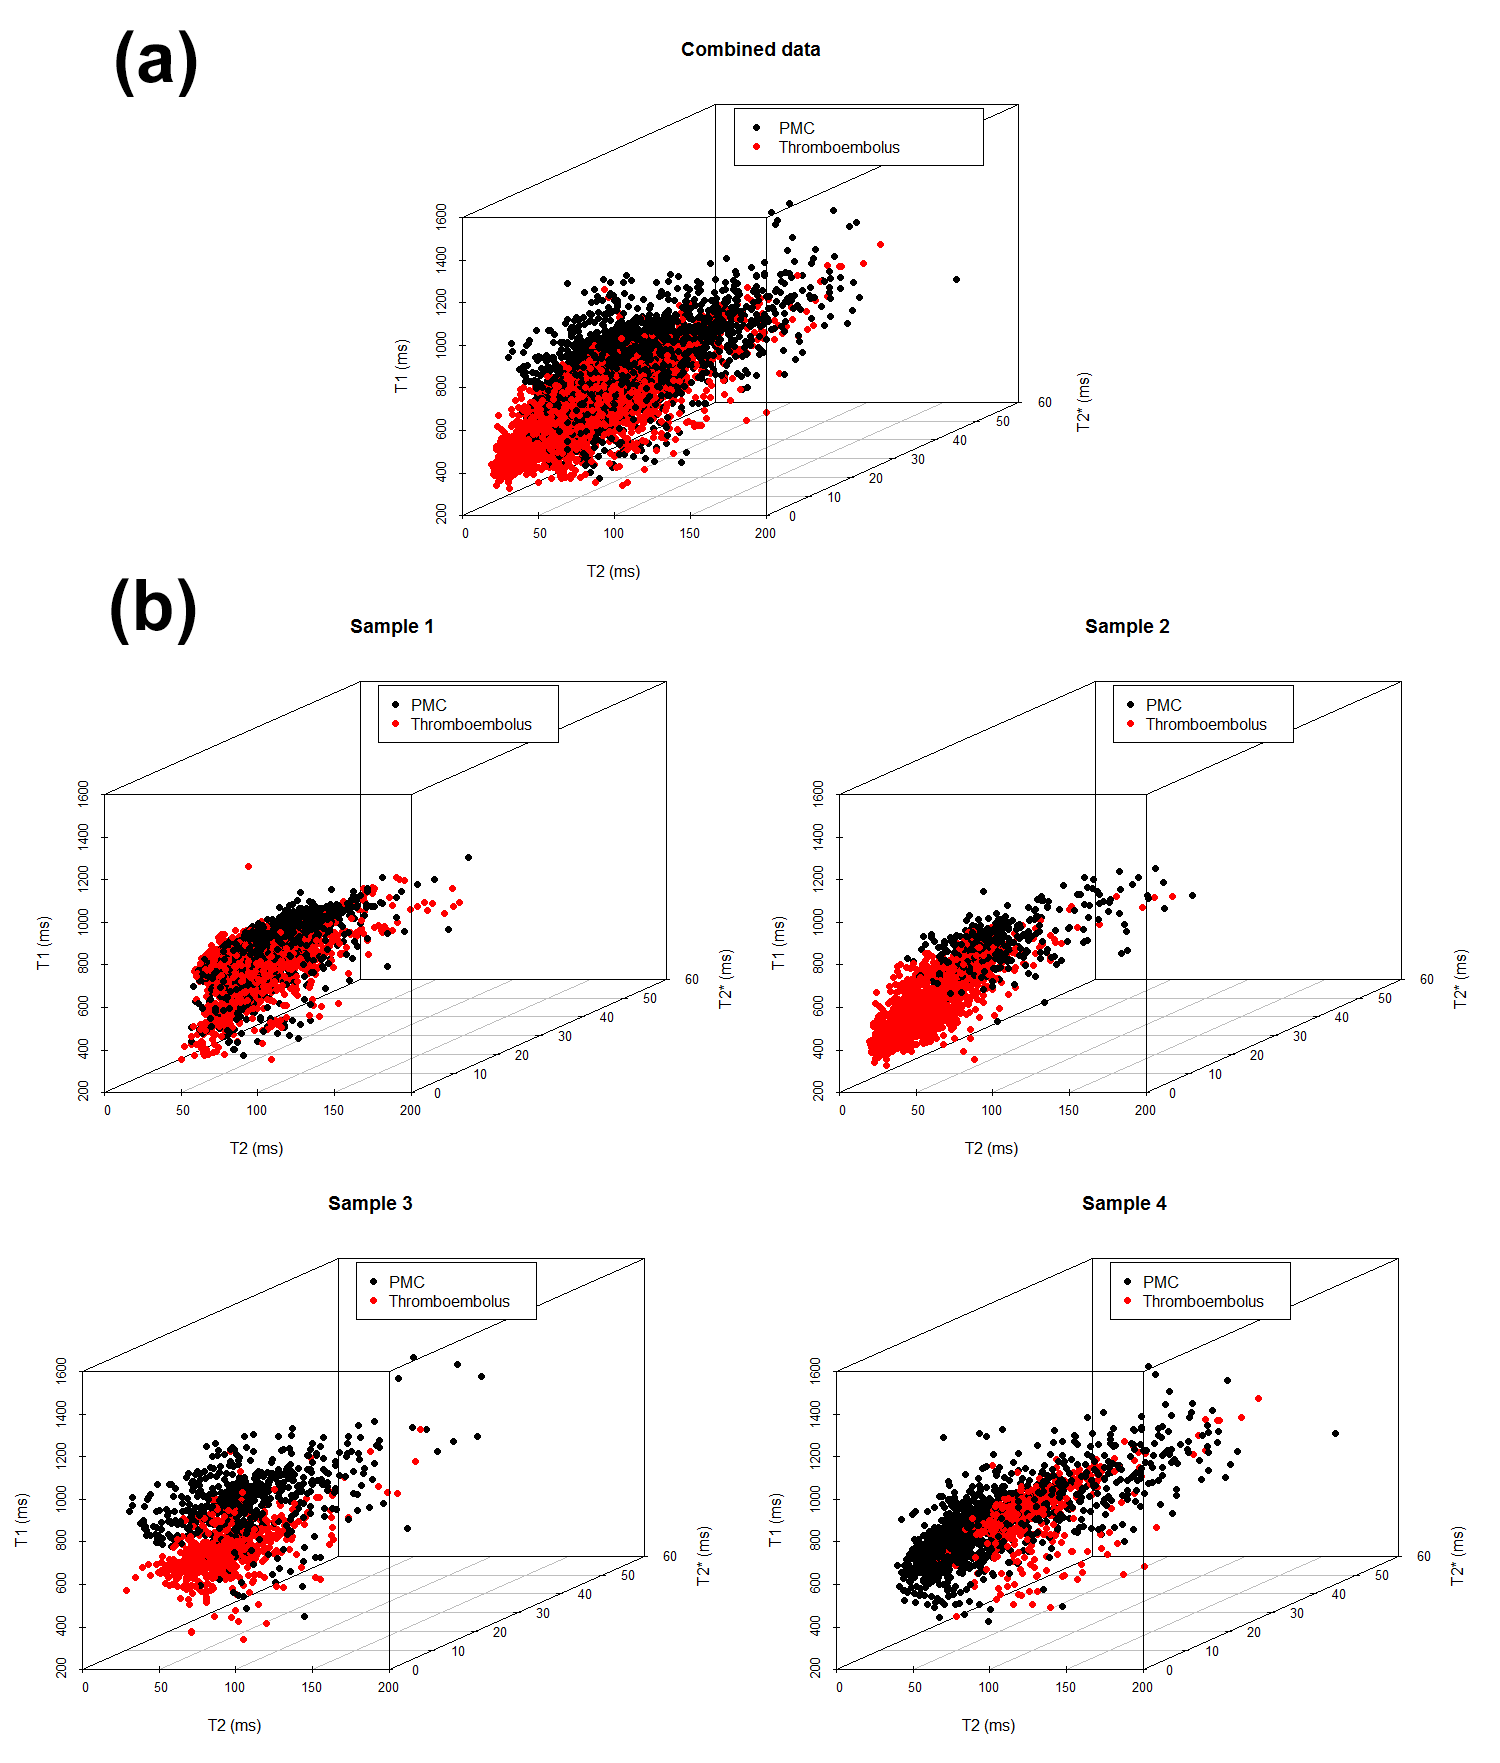
Although data indicated differences between the
two clot types (for example, Figure 1), reliable classification based on a single quantitative parameter
was not possible. The multivariate (3D) approach used to visualise quantitative
data (Figure 2) indicated the potential assignability of groups of voxels to a
specific type of clot. Sample-wise
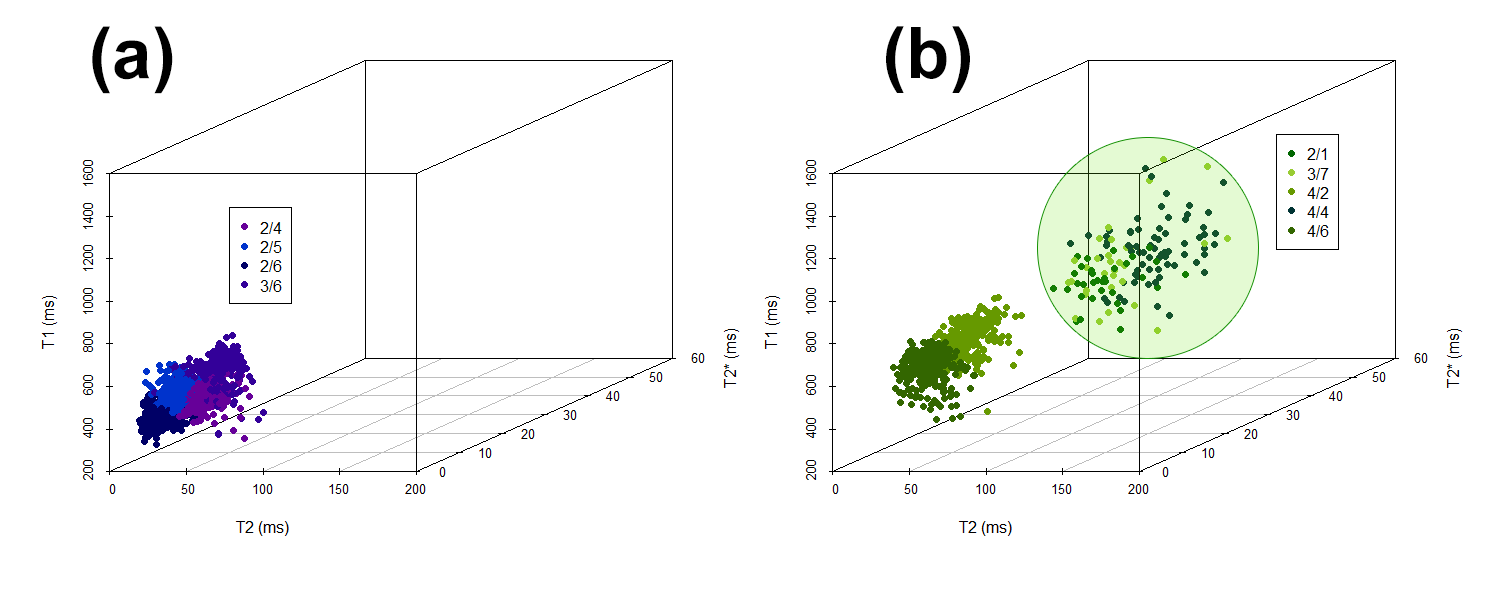
k-means clustering demonstrated the presence of multiple Cdiff (Table 2,Figure 3) in 75% of
samples. A single differentiating
cluster specific to PMC (Cdiff_PMC) (Figure 3b) was
identified in each of these samples. The position of the cluster centre (mean ±
SD) in multivariate space was T1=1090±53 ms, T2=165 ms±9
ms and T2*=9±3 ms. For all three samples, no thromboemboli voxels were present in this Cdiff_PMC.
Discussion
Preliminary findings indicated the existence of at least one Cdiff-PMC, which was observed in 3 of the 4 of sample pairs. The definition of this cluster, in terms of the position of its centre in multivariate (T1, T2, T2* ) space, demonstrates an initial step towards establishing a generalised model for differentiating thromboemboli and PMC clots using quantitative MRI. Both thromboemboli and PMC occur in various forms,3 meaning the underlying variation between samples should not be underestimated. The additional Cdiff identified in individual samples (Table 2) may therefore provide essential information for future differentiation models and should not be disregarded at this preliminary stage. Where differentiation between the thromboembolus und PMC was not possible in the multivariate space (one sample), the composition of the PMC (high proportion of erythrocytes, currant jelly clot) was suspected to have not only led to the thrombus-like visual appearance of the clot, but also to similarities in the relaxation behaviour of the thromboembolus and PMC in MRI.Conclusion
These preliminary findings are very promising, however additional samples are required to further enhance and validate the initial results obtained in this work.Acknowledgements
No acknowledgement found.References
1. Virmani R, Burke AP, Farb A. Sudden cardiac death. Cardiovascular Pathology. 2001;10(5):211-218.
2. Vidmar J, Kralj E, Bajd F, et al. Multiparametric MRI in characterizing venous thrombi and pulmonary thromboemboli acquired from patients with pulmonary embolism. Journal of Magnetic Resonance Imaging. 2015;42(2):354-361.
3. Dettmeyer, RB. Forensic Histopathology: Fundamentals and Perspectives. 2014. Heidelberg, Germany: Springer-Verlag.
Figures
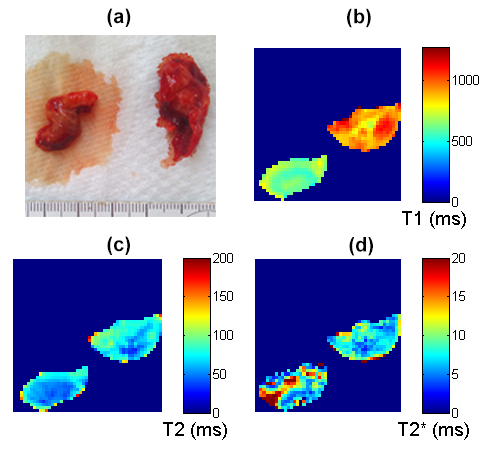
Figure 1: Sample 3 (thrombus (left), PMC (right))
(a) photograph (b) T1 map (c) T2 map (d) T2* map.