1940
Determination of Oxygenation Extraction Fraction for People with Sickle Cell Anemia using Calibration Model Specific to SCA Blood1Department of Radiology, Johns Hopkins University School of Medicine, Baltimore, MD, United States, 2F.M. Kirby Research Center for Functional Brain Imaging, Kennedy Krieger Institute, Baltimore, MD, United States, 3Division of Pediatric Hematology, Johns Hopkins University School of Medicine, Baltimore, MD, United States, 4Division of Hematology, Duke University, Durham, NC, United States
Synopsis
For the blood T2-based MRI oximetry methods, the calibration model to convert blood T2 to blood oxygenation (Y) is critical to calculate the brain oxygen extraction fraction (OEF). Here, we established a calibration model specific to people with sickle cell anemia (SCA) using in vitro blood T2 measurements on SCA blood samples under various conditions. The results show that the use of calibration models based on normal blood underestimate Y, and thus overestimate OEF, for individuals with SCA. Using a fast T2 protocol to measure oxygenation in the internal jugular vein (IJV), the whole-brain OEF values of individuals with SCA were determined and compared with healthy volunteers.
Introduction
An increased oxygen extraction fraction (OEF) is an indicator of decreased cerebrovascular reserve and may help predict the risk of cerebral infarction in people with sickle cell anemia (SCA). MRI T2 oximetry1–4 can conveniently convert measured venous blood T2 values to venous oxygenation fraction (Yv) using a predetermined calibration, which can then be used to estimate OEF. Currently, calibration models established for healthy adults5,6 and neonates7 are being applied to people with SCA8. However, SCA blood could have a different T2 dependence of Y. Here, we established a calibration curve specific to people with SCA by measuring T2 in their blood samples as a function of Y and hematocrit (Hct). Whole-brain OEFs of a group of individuals with SCA were derived using this calibration model. For comparison, the whole-brain OEF of healthy volunteers was also measured and analyzed using a calibration model based on blood T2 data from normal human blood samples.Methods
Experiments were performed on a 3T Philips Achieva scanner. Thirteen healthy volunteers (35 ± 8 yrs; 7M / 6F; Hct: 0.42+/-0.03) and six people with SCA (22 ± 3 yrs; 3M / 3F; HbS: 81%+/-8%; HbF: 9%+/-5%; Hct: 0.27+/-0.05) with no history of stroke, recent transfusion, or renal impairment were enrolled after informed consent.
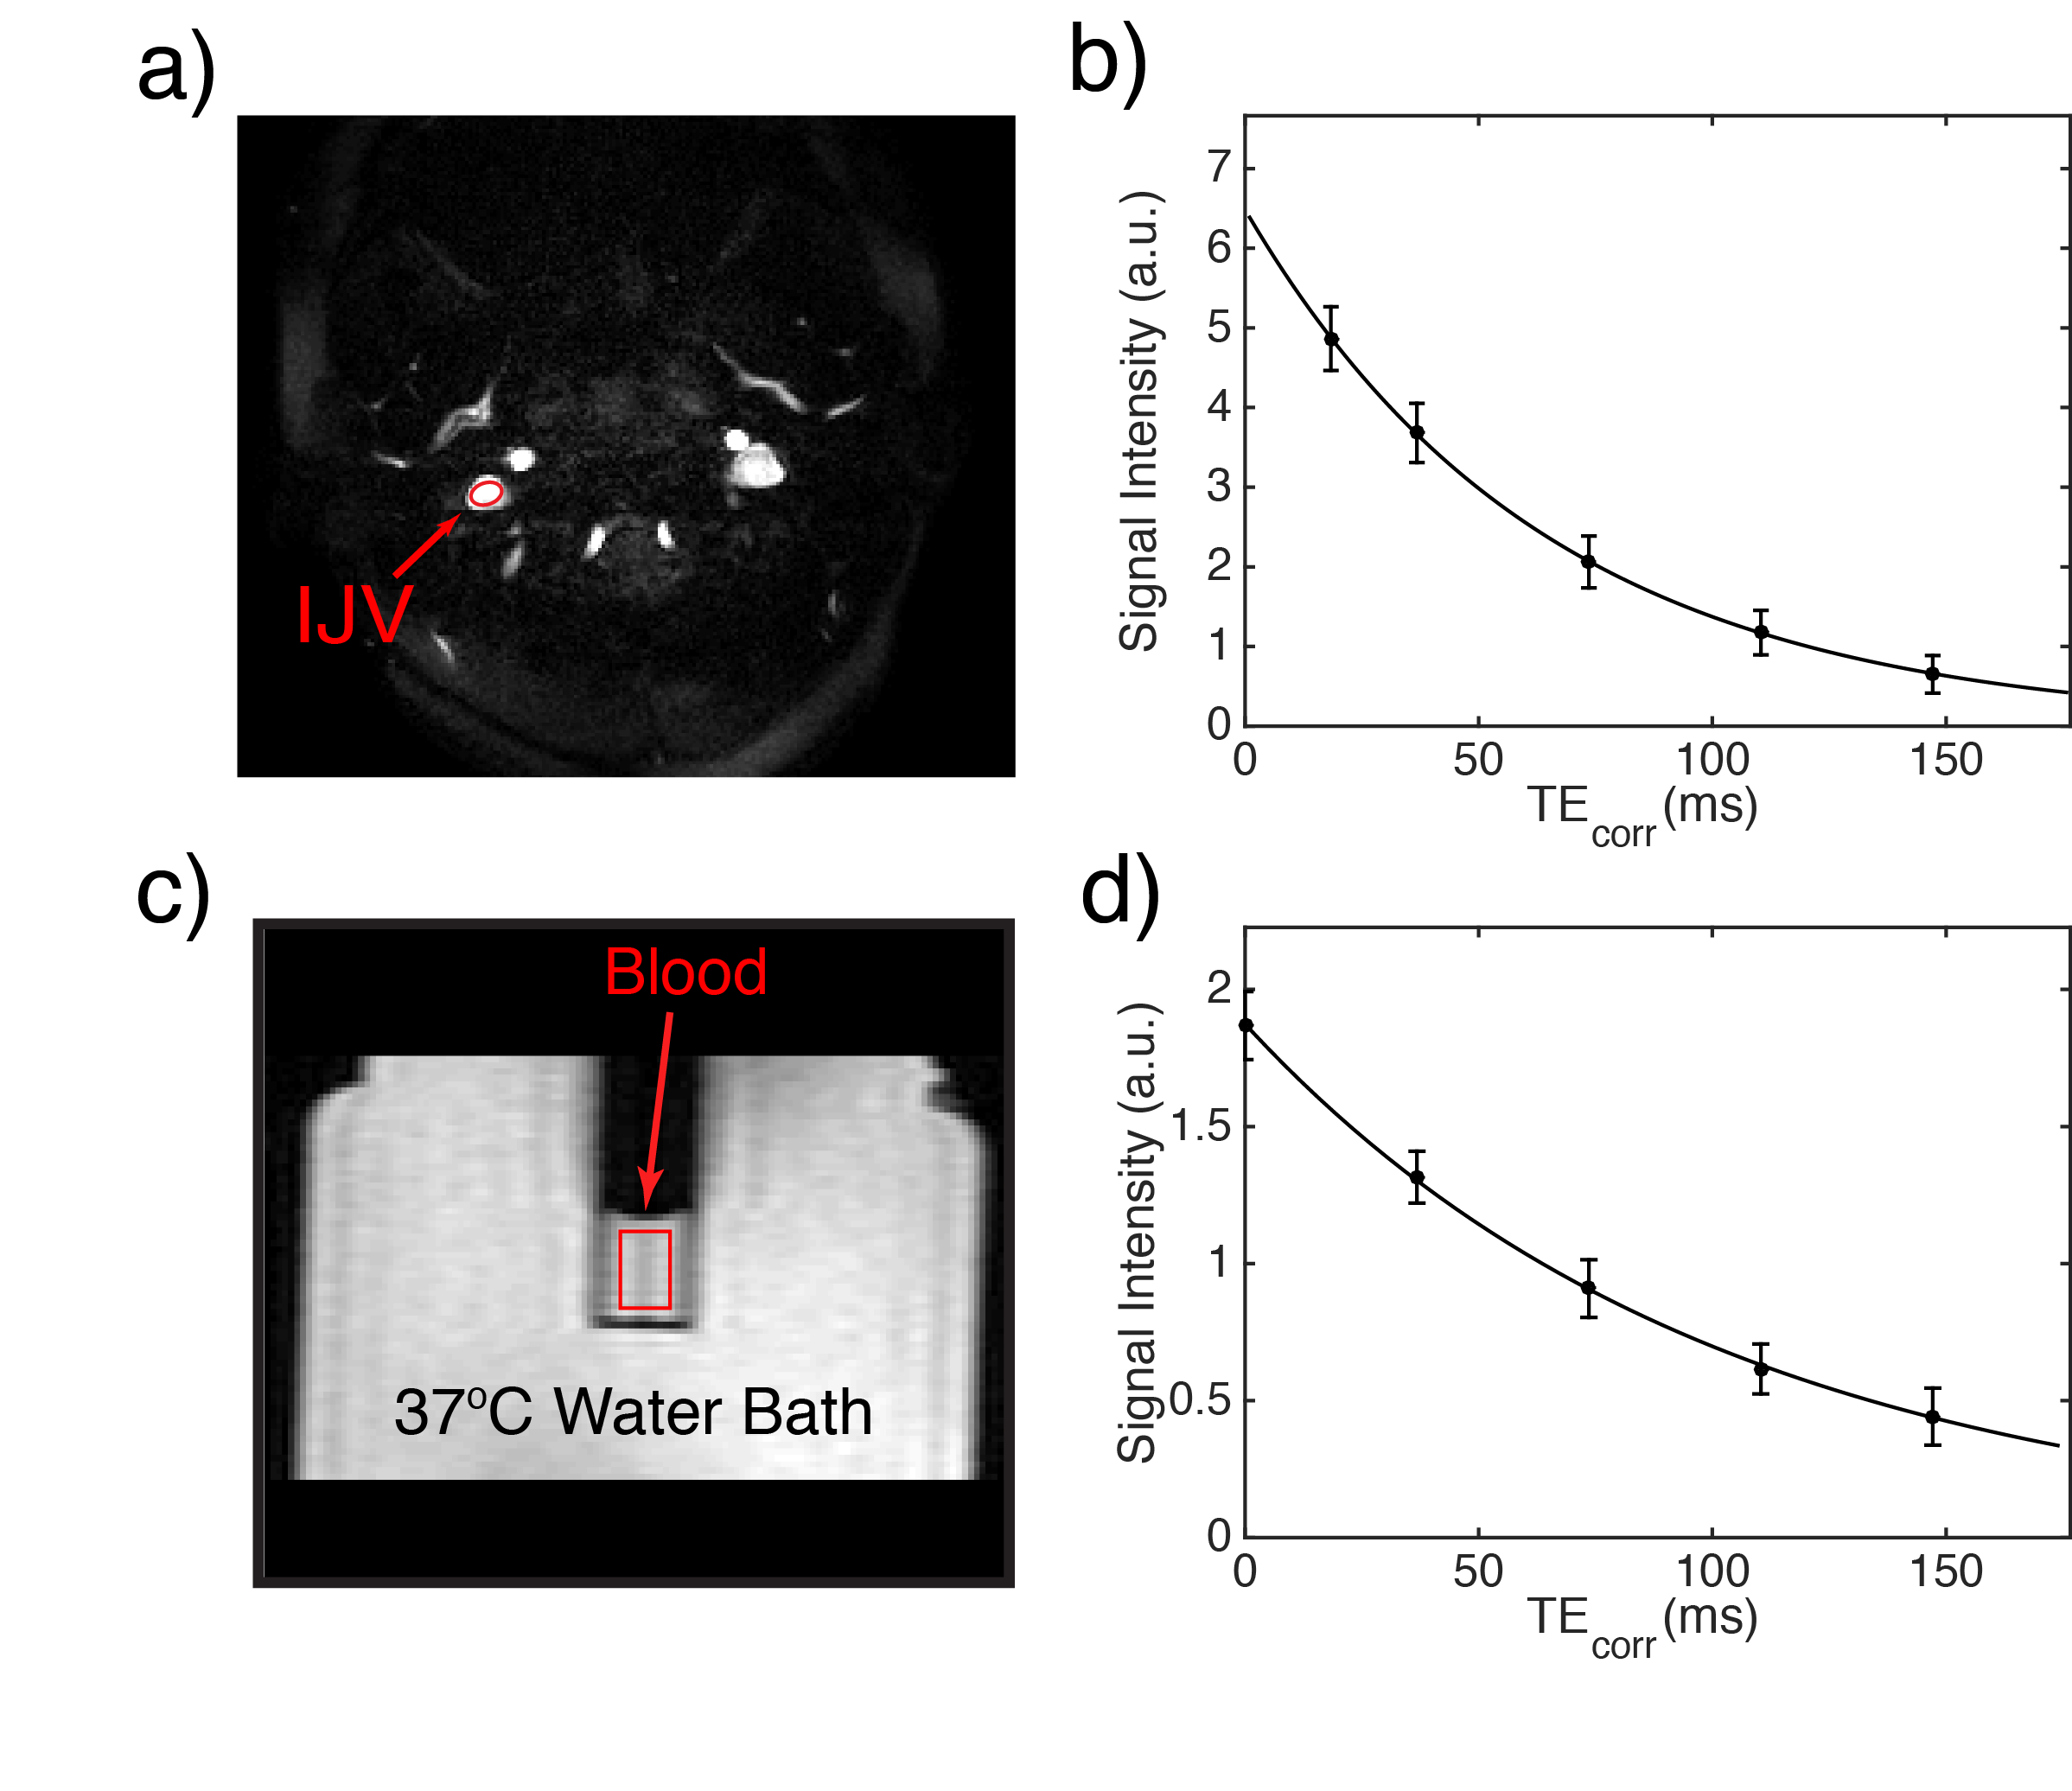
Venous blood T2 values were measured in the internal jugular vein (IJV) (Fig. 1a,b) using a 48 sec protocol3. The acquisition pulse sequence included a CPMG T2prep module with the echo times of [20, 40, 80, 120, 160] ms and constant inter-echo spacing of 10 ms. A 1.75 ms 90x180y90x composite pulse was used for the CPMG refocusing pulses, and the echo times were corrected correspondingly3,9.
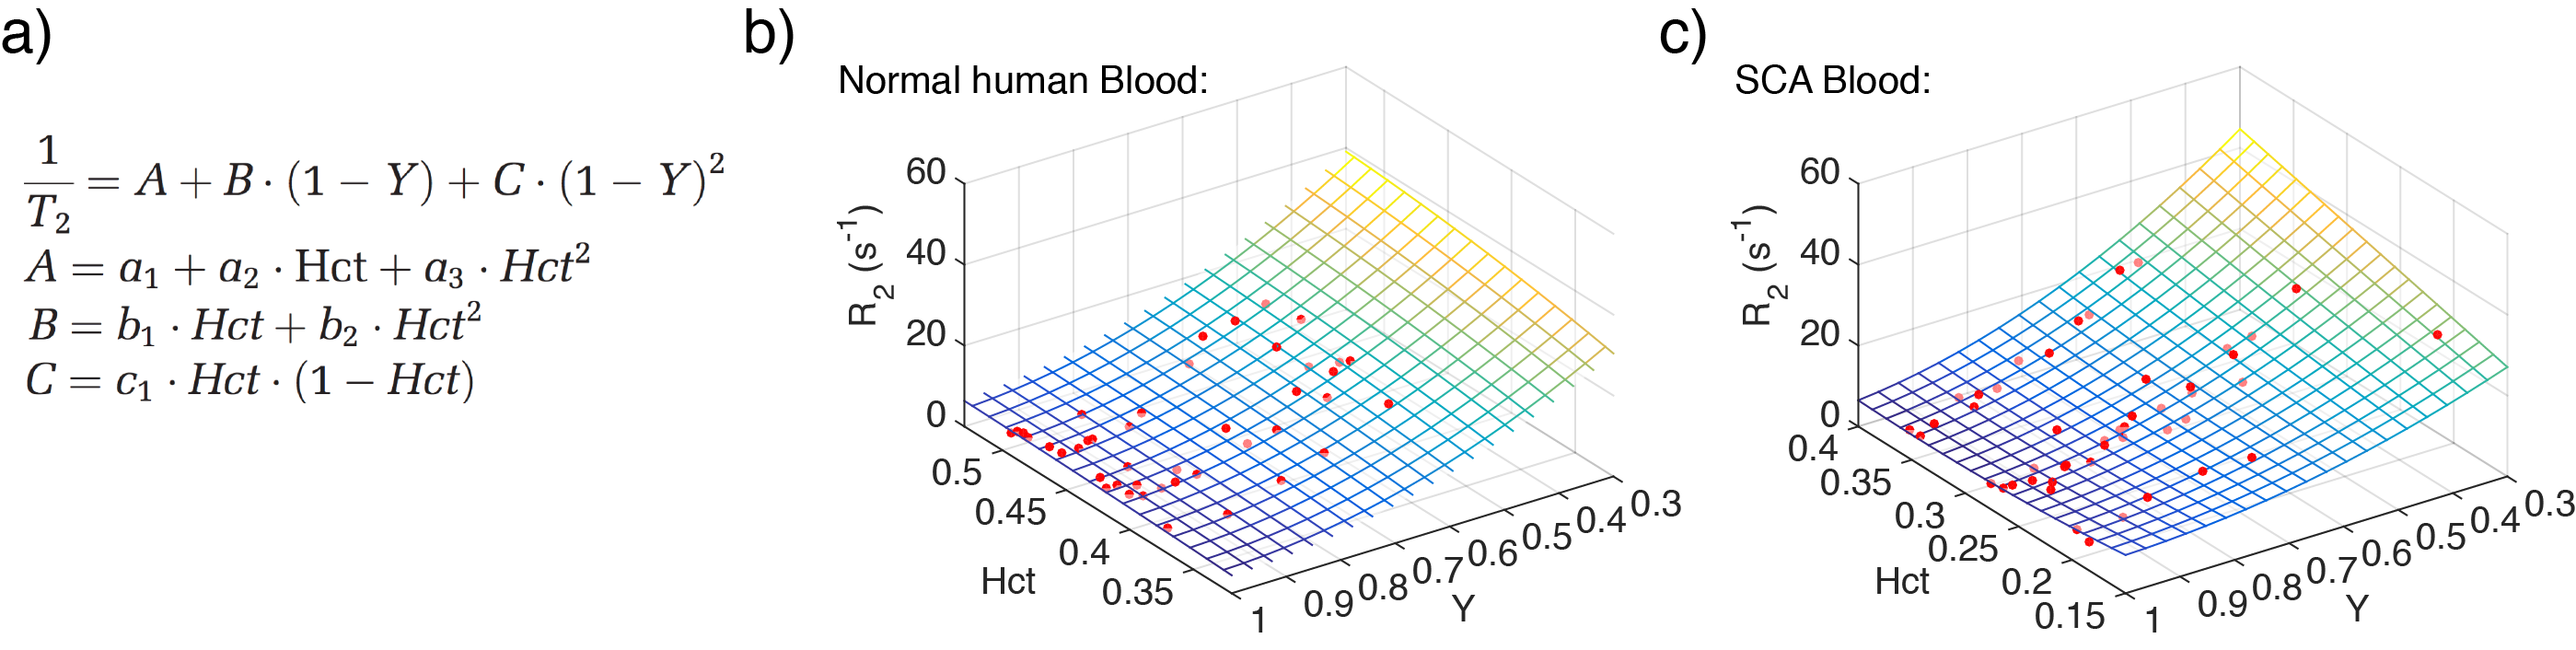
In vitro T2 measurements were conducted on blood drawn from the healthy volunteers and people with SCA on the same day under physiological conditions (T=37ºC) following previous protocols7,10. Nitrogen and air gas were used to prepare different oxygenation levels (ranging from ~50% to 100%) for each blood sample. CPMG experiments in vitro (Figs 1c,d) were performed with echo times of [0, 40, 80, 120, 160] ms and the same 10 ms inter-echo spacing as in-vivo experiments. The entire in vitro protocol was only 1 min to prevent sedimentation of erythrocytes. Blood oxygenation was measured immediately after every measurement using a blood analyzer. Blood T2 values measured in vitro from both normal and SCA samples were separately fitted relative to Y and Hct using the empirical model proposed by Lu et al.5 (Fig. 2a). Then venous blood T2 values in healthy volunteers and people with SCA were converted to venous Y (Yv) using these calibration curves from normal and SCA blood and their individual Hct. The whole-brain OEF was calculated as 1-Yv.
Results
Excellent fitting was obtained for the results of the in vitro experiments. The relationship between blood T2, Y and Hct for both the normal and SCA blood samples are illustrated with surface plots in Fig2. b,c. The red dots indicate the experimental data points and the mesh shows the model-fitted surface.
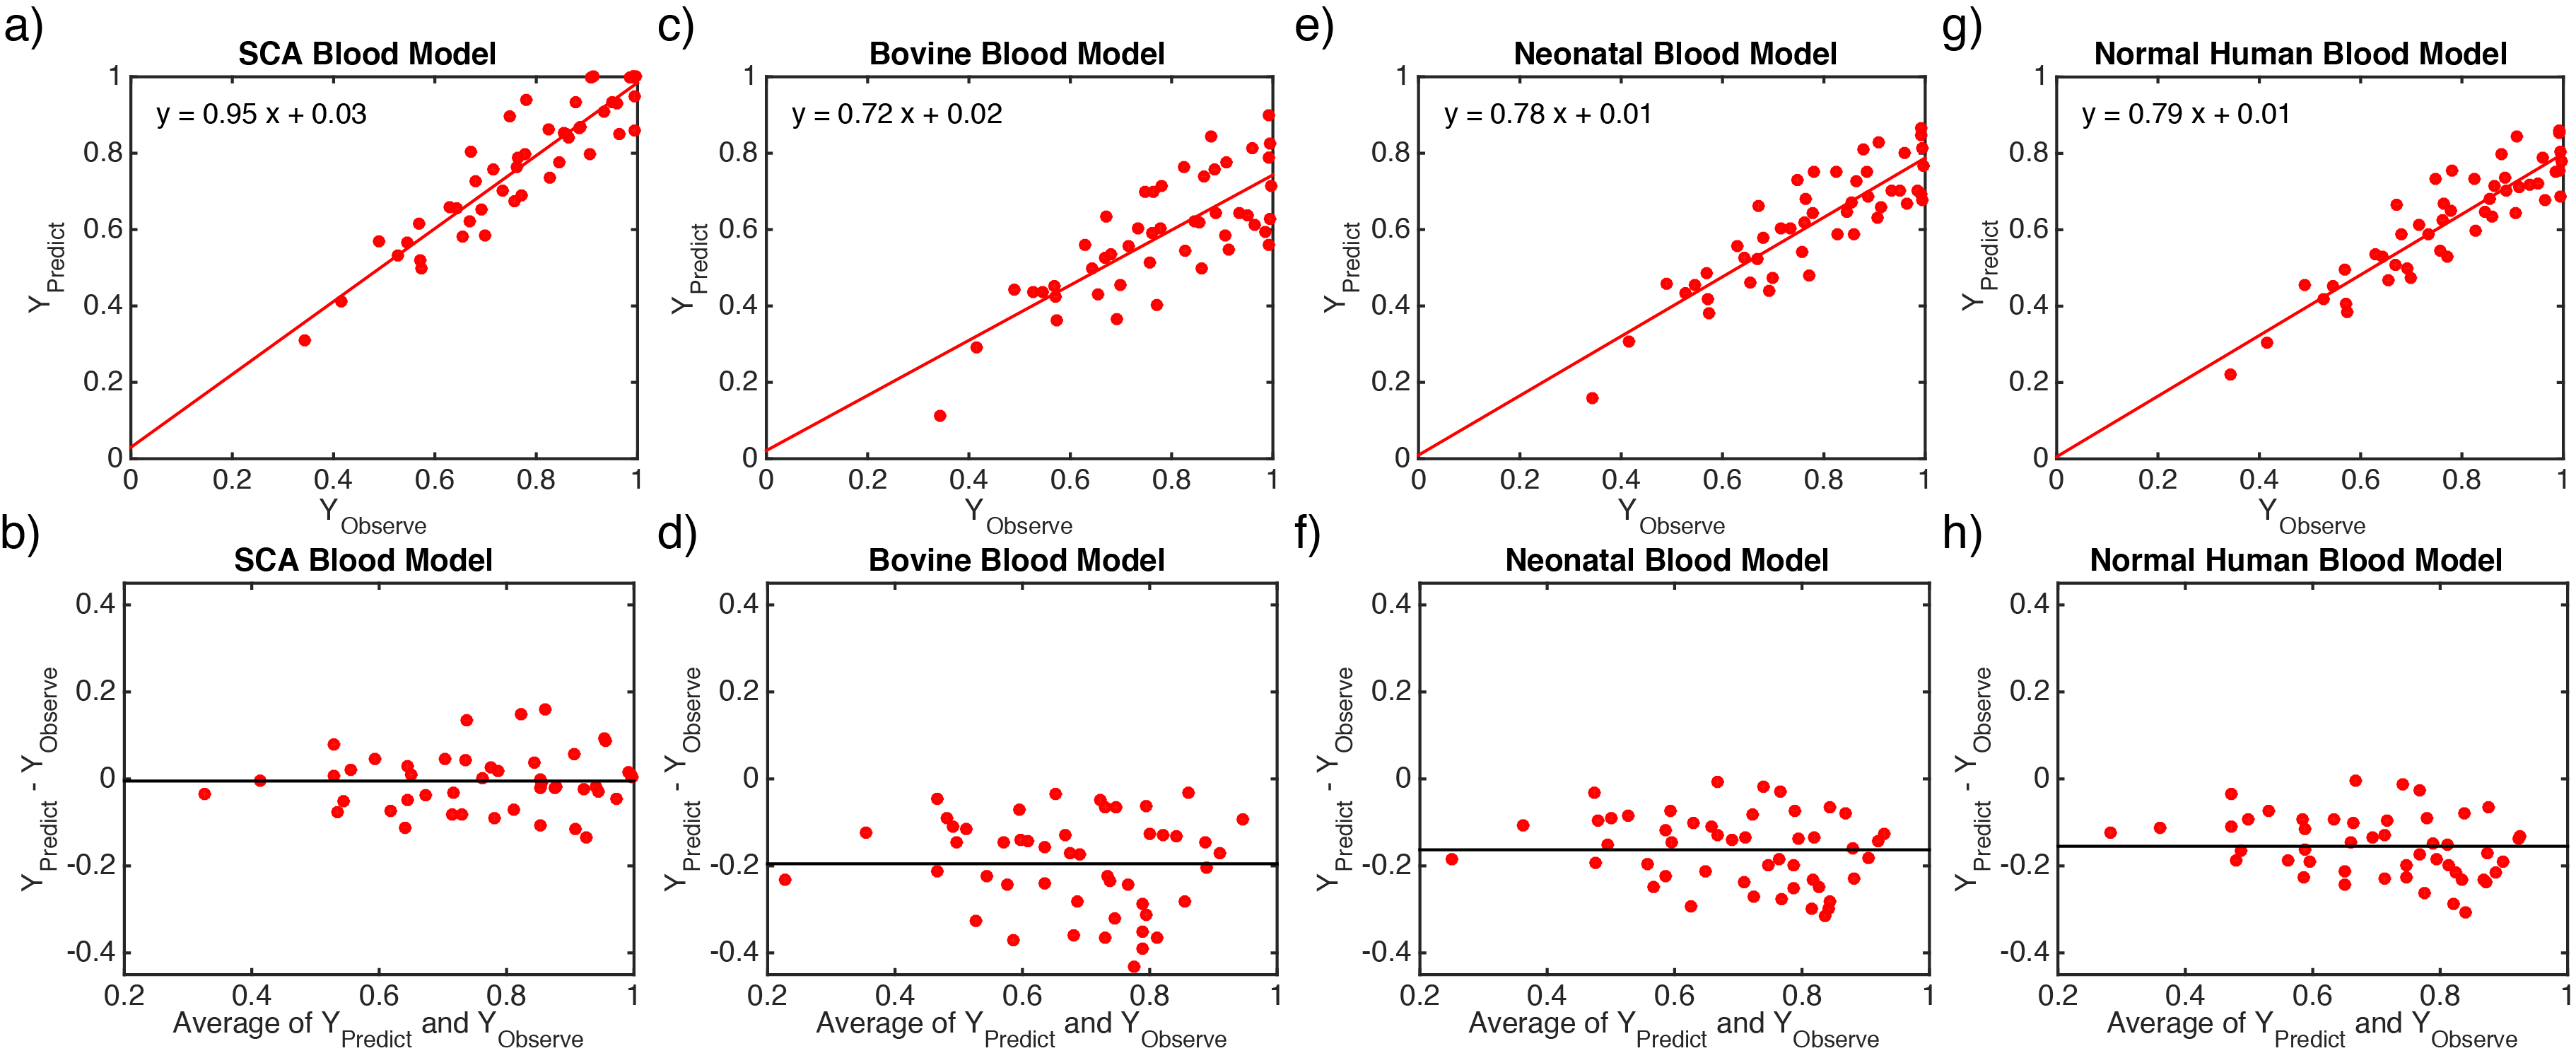
In comparison of the predicted and measured Y for SCA blood samples, only our calibration model for SCA blood showed correct values (Fig. 3a,b), while 10%-20% underestimations of Y were observed for three existing calibration models5–7 (Figs. 3c-h).
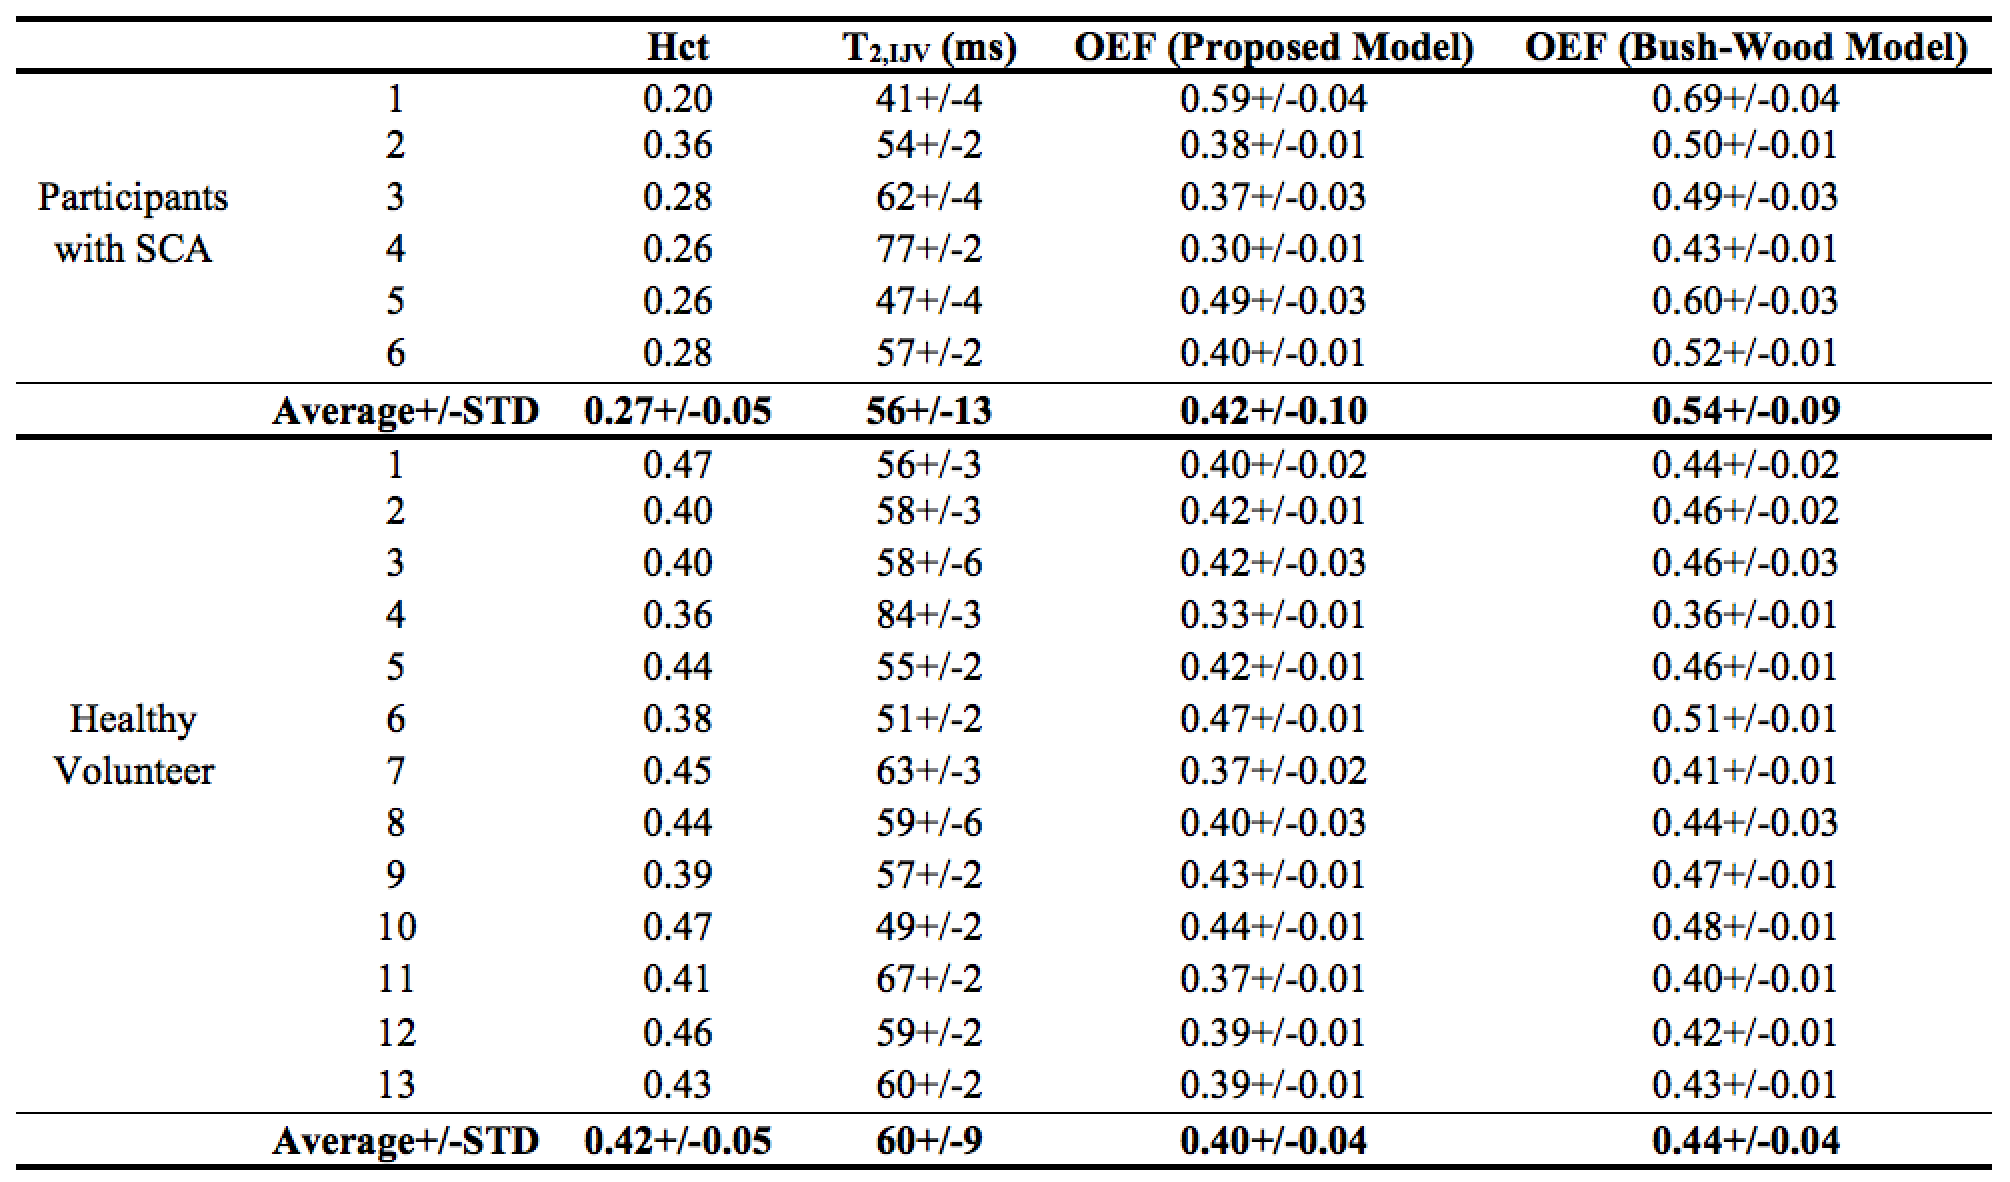
Using our SCA in vitro blood model, the averaged whole-brain OEFs of participants with SCA were measured as 0.42+/-0.10 (Table 1), 22% lower than the values of 0.54+/-0.09 estimated using a calibration model6 based on normal human blood with Hct range of 0.1-0.55. Compared with healthy volunteers, participants with SCA have larger variations (p<0.004) and slightly higher (p<0.54) average values of whole-brain OEF, 0.42+/-0.10 vs 0.40+/-0.04.
Discussion and Conclusion
We developed an empirical blood T2-Y calibration model for SCA blood. For people with SCA, underestimations of Yv or overestimations of OEF were observed when using previously developed calibration models5–7. This may be caused by erythrocytes’ irregular shape and HbS polymerization11 and requires a specific calibration. The average whole-brain OEF values estimated using our SCA blood calibration model did not have significantly higher values than healthy volunteers, which is consistent with an earlier PET study12, but contradictory to an earlier T2 oximetry study8 using the calibration model derived from normal blood5.Acknowledgements
No acknowledgement found.References
1. Wright GA, Hu BS, Macovski A. Estimating oxygen saturation of blood in vivo with MR imaging at 1.5 T. J. Magn. Reson. Imaging 1991;1:275–83.
2. Lu H, Ge Y. Quantitative evaluation of oxygenation in venous vessels using T2-Relaxation-Under-Spin-Tagging MRI. Magn. Reson. Med. 2008;60:357–63.
3. Qin Q, Grgac K, van Zijl PCM. Determination of whole-brain oxygen extraction fractions by fast measurement of blood T(2) in the jugular vein. Magn. Reson. Med. 2011;65:471–9.
4. Jain V, Magland J, Langham M, Wehrli FW. High temporal resolution in vivo blood oximetry via projection-based T2 measurement. Magn. Reson. Med. 2013;70:785–90.
5. Lu H, Xu F, Grgac K, Liu P, Qin Q, van Zijl P. Calibration and validation of TRUST MRI for the estimation of cerebral blood oxygenation. Magn. Reson. Med. 2012;67:42–9.
6. Bush A, Borzage M, Detterich J, Kato RM, Meiselman HJ, Coates T, Wood JC. Empirical model of human blood transverse relaxation at 3 T improves MRI T 2 oximetry. Magn. Reson. Med. 2016;Epub ahead.
7. Liu P, Chalak LF, Krishnamurthy LC, Mir I, Peng S, Huang H, Lu H. T1 and T2 values of human neonatal blood at 3 Tesla: Dependence on hematocrit, oxygenation, and temperature. Magn. Reson. Med. 2016;75:1730.
8. Jordan LC, Gindville MC, Scott AO, et al. Non-invasive imaging of oxygen extraction fraction in adults with sickle cell anaemia. Brain 2016;139:738–50.
9. Foltz WD, Stainsby JA, Wright GA. T2 accuracy on a whole-body imager. Magn. Reson. Med. 1997;38:759–768.
10. Li W, Liu P, Lu H, Strouse JJ, van Zijl PCM, Qin Q. Fast measurement of blood T1 in the human carotid artery at 3T: Accuracy, precision, and reproducibility. Magn. Reson. Med.:Epub ahead.
11. Harris JW. Studies on the Destruction of Red Blood Cells. VIII. Molecular Orientation in Sickle Cell Hemoglobin Solutions. Anc. Doc. Pearl Gt. Price 1950;75:197–201.
12. Herold S, Brozovic M, Gibbs J, Lammertsma AA, Leenders KL, Carr D, Fleming JS, Jones T. Measurement of regional cerebral blood flow, blood volume and oxygen metabolism in patients with sickle cell disease using positron emission tomography. Stroke. 1986;17:692–8.
Figures