1939
Hemodynamic response to respiratory challenge evaluated by dynamic R2’ imaging: application for acute renal ischemia caused by microsphere-induced renal artery embolism1Academy for Advanced Interdisciplinary Studies, Peking University, Beijing, People's Republic of China, 2interventional radiology and vascular surgery, Peking University First Hospital, Beijing, People's Republic of China, 3College of Engineering, Peking University, Beijing, People's Republic of China, 4Philips Healthcare, Suzhou, People's Republic of China, 5Institute of Science and Technology for Brain-Inspired Intelligence, Fudan University, Shanghai, People's Republic of China, 6Department of Radiology, Peking University First Hospital, Beijing, People's Republic of China
Synopsis
The clinical use of iodinated or gadolinium contrast agents for renal hemodynamic imaging is limited in the presence of renal dysfunction due to its increased risks of exacerbating renal damage. Therefore, we performed a modified HRI technique with a specific-designed magnetic-susceptible sequence that could separate R2’ from the BOLD signals in a unilateral microemboli-induced AKI model. The results show that R2’ in normal or less affected regions reduced after carbogen challenge, while the R2’ in the most affected lesions increased significantly. The dR2’ map could indicate the most affected areas accurately confirmed with the final anatomic T2w image.
Introduction & Purpose
The clinical use of iodinated or gadolinium contrast agents for renal hemodynamic imaging is limited in the presence of renal dysfunction due to its increased risks of exacerbating renal damage. Therefore, a non-invasive technique devoid of contrast media administration is essential in the assessment of renal impairment. Recent studies have demonstrated the use of hemodynamic response imaging (HRI), a BOLD-contrast MRI method combined with hypercapnia and hypercapnic-hyperoxia respiratory challenges, for monitoring renal hemodynamic dysfunctions in acute kidney injure (AKI) and chronic kidney disease (CKD) animal models1. In this study, we performed a modified HRI technique with a specific-designed magnetic-susceptible sequence that could separate R2’ from the BOLD signals in a unilateral microemboli-induced AKI model.Materials and Methods
Study protocol
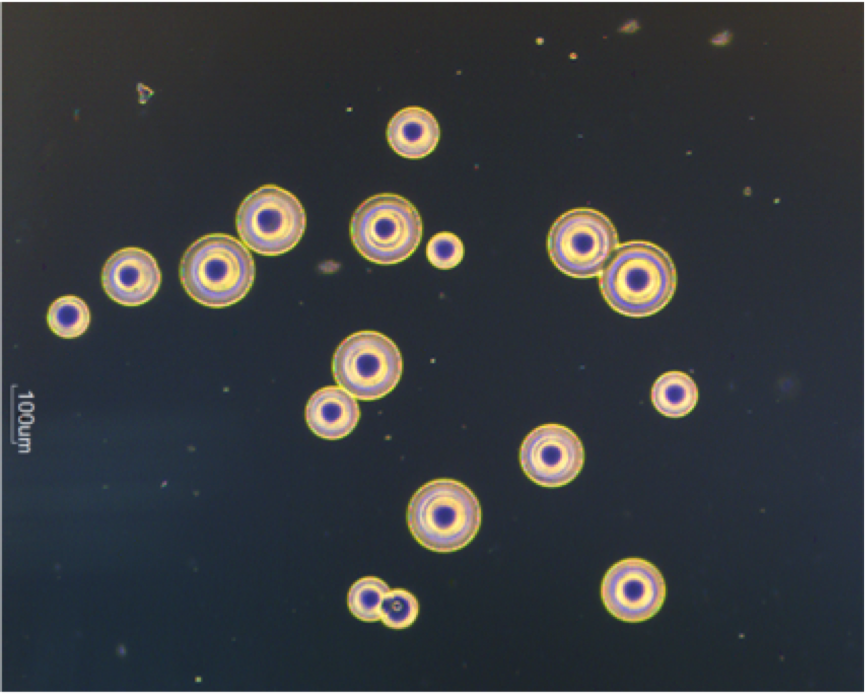
Animal experiments were performed in accordance with the guidelines and approval of the Animal Care and Use Institutional Committee, on New Zealand White rabbits (n = 20). Before the surgery, anesthesia was induced by an intravenous injection of pentobarbital sodium. Microemboli-induced AKI was induced by injection of a 50000-microsphere dose (acryl beads, 40-120 um in diameter) into the right renal artery. A 4F catheter was first injected into the right femoral artery and moved to the ostium of the right renal artery under the guidance of digital subtraction angiography (DSA). Then microspheres (Fig 1) suspended in 2.0 ml of physiological saline were injected slowly.
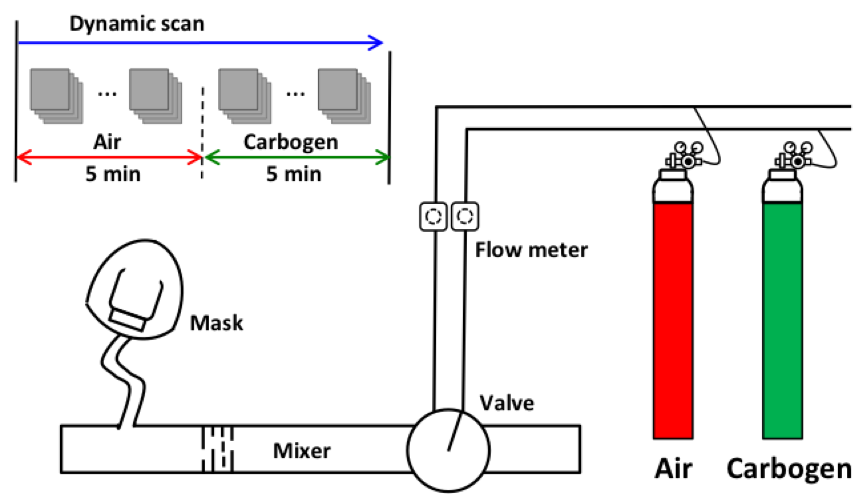
Immediately after the surgery, the rabbits were transferred to an MR table for imaging. All the animals underwent a series of gas challenges by alternating room air and carbogen mixture (5% of CO2, and 95 of O2). HRI scan was implemented throughout the gas challenge procedure as previously described2. The experiment device and the scanning protocol are shown in Fig 2.
MRI Methods
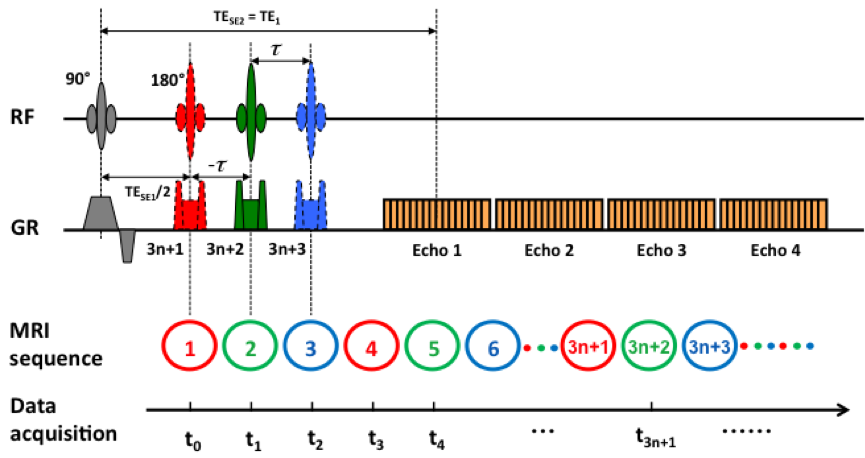
All the MRI experiments were carried out on a 3.0 Tesla MR scanner (Achieva, Philips Medical Systems, Best, Netherlands). A dynamic psMASE-ME sequence2 was utilized to acquire the source data. Diagram of the psMASE-ME sequence is displayed in Fig 3. Briefly, a four-echo asymmetric spin-echo (ASE) EPI sequence with periodic shifted 180° pulse was implemented dynamically. Meanwhile, the current image data as well as the neighboring data formed an image group for further R2’ fitting. The detailed imaging parameters were: field of view (FOV) = 150 × 150 mm2, matrix size = 70 × 70, repetition time (TR) = 2000 ms, TE1/TE2/TE3/TE4 = 60/80/100/120 ms, echo space = 20 ms, τ = -10/0/10 ms, slice thickness = 5 mm, SENSE factor = 2.
Quantitative Analysis
To mitigate respiratory motion artifacts, two-dimensional affine registration was performed with in-house software programed with MATLAB (MathWorks Inc., Natick, MA, USA). R2’ maps were generated as reported previously2. The percentage change in SI (ΔS), induced by carbogen challenge was calculated from the average of fifty repetitions for each condition.
Results
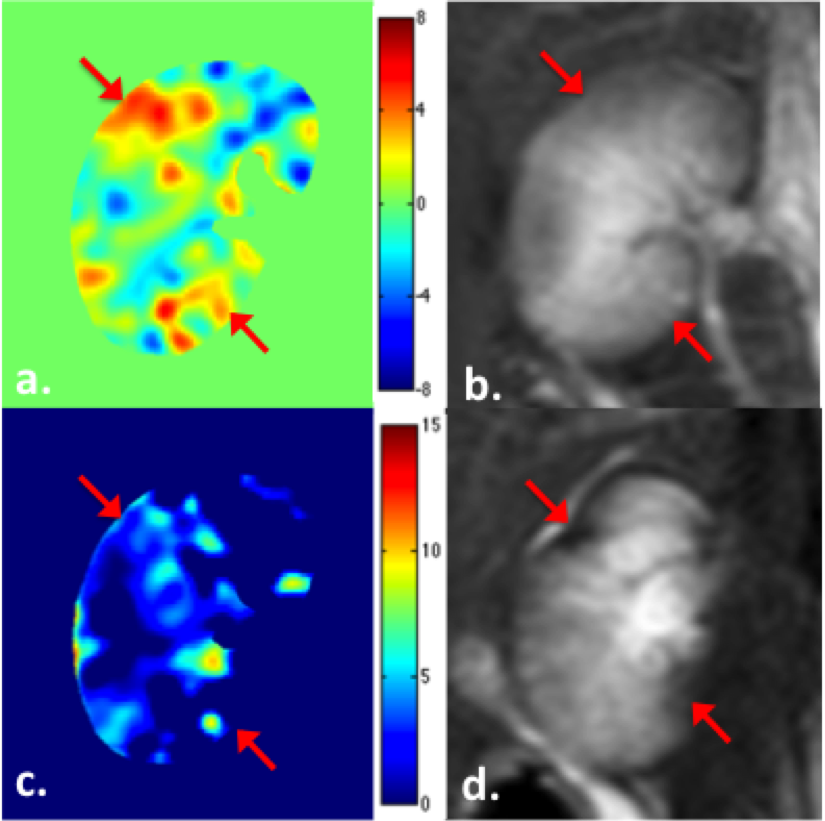
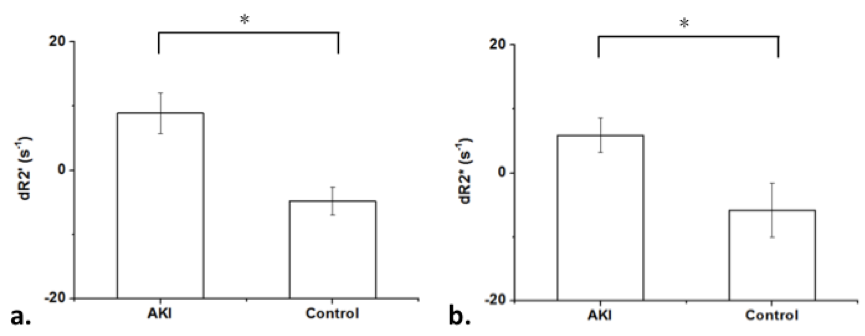
The calculated renal R2’ maps revealed pronounced signal changes in the lesions suffer from acute ischemia in response to carbogen inspiration. Representative dR2’ (= R2’air – R2’carbogen) map (a), R2’ map derived from psMASE-ME sequence (c) and T2w images obtained immediately after microsphere injection (b) and 4 weeks thereafter (d) are shown in Fig 4. The red arrows indicate the most affected areas in the right kidney confirmed with the final anatomic T2w image. Remarkable R2’ change have been detected in these lesions immediately after AKI modeling. The R2’ in normal or less affected regions reduced after carbogen challenge, while the R2’ in the most affected lesions increased significantly (Fig 5).Discussion & Conclusion
This study demonstrates that the R2’ based renal HRI technique could be used in the assessment of renal dysfunction without the potential risk associated with contrast-agents administration. Comparing to conventional HRI techniques, mapping of the transverse relaxation rate of R2’ allows us to characterize the hypoxia status of the tissue in particular. Compared temporal resolution was achieved using the proposed dynamic psMASE-ME sequence. HRI has shown to be sensitive to changes in renal perfusion and vascular reactivity, which could provide non-invasive indices of renal hemodynamics and oxygenation availability.Acknowledgements
No acknowledgement found.References
1. Milman Z, et al. American journal of nephrology, 2014, 39(3): 268-278.
2. Wang C, et al. NMR in Biomedicine, 2016, 29(11): 1601-1607.
Figures