1938
Relaxation Times and Magnetic Susceptibility of Human Umbilical Cord Blood at 3 Tesla1Department of Medical Biophysics, University of Toronto, Toronto, ON, Canada, 2Department of Obstetrics and Gynecology, Mount Sinai Hospital, Toronto, ON, Canada, 3Department of Pediatrics and Diagnostic Imaging, University of Toronto, Toronto, ON, Canada, 4Division of Cardiology, The Hospital for Sick Children, Toronto, ON, Canada, 5Mouse Imaging Centre, The Hospital for Sick Children, Toronto, ON, Canada, 6Department of Physiology and Experimental Medicine, The Hospital for Sick Children, Toronto, ON, Canada
Synopsis
With an increasing proportion of fetal cardiovascular MRI scans being performed at 3 Tesla, there is growing need for an accurate calibration, which characterizes relationships between MRI properties (T1, T2, susceptibility) and blood properties (oxygen-saturation, sO2 and hematocrit, Hct) at 3T. Accordingly, relaxometry measurements were performed at 3T on cord blood specimens (N=89) with a broad range of hematocrits (0.09<Hct<0.82) and oxygen-saturations (7%<sO2<100%). We also measured fetal blood susceptibility, which, to our knowledge, has never been reported. The data were effectively described by a simple, two-compartment model for blood.
Introduction
With the help of fast, magnetization-prepared pulse sequences, relaxation time and susceptibility measurements in the vessels of the late-gestation human fetus are now achievable1-3. Using appropriate calibration data, these relaxometry and susceptibility measurements can be used to estimate hematocrit (Hct) and/or oxygen saturation (sO2). In a recent publication, we described the relationship between fetal blood T1 and T2 and Hct and sO2 at 1.5 Tesla4.
The prospect of a
two-fold SNR boost has increased the proportion of fetal MRI scans performed at 3 Tesla5. With
this in mind, the present study extends our previous work by
characterizing the relationship between fetal blood relaxation times
and Hct and sO2 at 3T.
We
also include measurements of fetal blood susceptibility, which, to our knowledge, have never before been reported.
Methods
Specimen Handling: Umbilical cord blood samples were harvested from 6 human placentas following caesarean at >37 weeks gestation. The 30-50mL of blood obtained from each collection was divided into 15, 2mL specimens, which were processed (by removal/addition of plasma and nitrogen gas exposure) to provide a range of Hct and sO2. Specimens were kept in sealed vacutainer tubes and placed in a 0.2 mM Gd DTPA doped water bath during scanning. Bath water was heated to 37°C during relaxometry, but not susceptibility measurements. Susceptibility was measured at room-temperature to avoid convection effects within the bath, which could corrupt phase subtractions. Given the limited effect of temperature on susceptibility6, our findings remain applicable to in-vivo conditions. Following MRI, specimen Hct and sO2 were measured using an ABL-800 FLEX Blood Gas Analyzer.
MRI Acquisition
Relaxometry: T1 was measured using a series of standard inversion recovery (IR) acquisitions at 9 inversion times, TI, from 24–8000 ms. T2 relaxation times were measured at 6 echo spacings (τ180=8.4, 12, 18, 24, 30, 36 ms) using a multi-echo spin-echo pulse sequence.
Susceptibility: To isolate the blood's field contribution from those of the gas within the tube and the background B0 homogeneity, each blood specimen was paired with a
“reference” specimen - a vacutainer tube filled to an
equivalent height with the solution in the surrounding bath. Along with blood specimen phase maps (Φblood),
phase maps of reference specimens (Φref) and the empty water bath (Φempty) were acquired. A 3D fast-spin-echo image was also obtained
for construction of a susceptibility model. The procedure for calculating susceptibility
from Φblood, Φref, and Φempty is outlined in Figure 1.
Data Processing
Estimating Relaxation Times and Susceptibility: T1
was evaluated
by fitting the mean signal, S, in manually drawn ROIs within each specimen tube to the exponential: S=A+B·exp(-TI/T1). T2 was estimated by fitting ROI signal to A·exp(-TE/T2)+B. Susceptibility estimates were obtained by determining the bath-specimen susceptibility difference, Δχ, which most closely matched the acquired phase data (see Figure 1).
Model Fitting: Data were fit to established models representing blood as a two compartment system (plasma and erythrocytes) in the fast exchange regime.7,8 Compartments have individual susceptibilities (χery/plas) and relaxation rates (R1,ery/plas=(T1,ery/plas)-1, R2,ery/plas=(T2,ery/plas)-1). Relative compartment sizes are determined by Hct. Due to the paramagnetic nature of deoxyhemoglobin, erythrocyte properties relate to sO2:
\begin{eqnarray*}\chi_{ery}&=&\chi_{ery,0}+(1-sO_2)\Delta\chi_{deo}\ , \\R_{1,ery}&=&R_{1,ery,0}+(1-sO_2)\Delta R_{1,deo}\ , \\R_{2,ery}&=&R_{2,ery,0}+(1-sO_2)\Delta R_{2,deo}\ .\\\end{eqnarray*} The model for T2 also incorporates a plasma-erythrocyte frequency shift, $$$\Delta \omega = \omega_0 + (1-sO_2)\Delta \omega_{deo}$$$ (arising from a susceptibility difference), and a correlation time, τ, for plasma-erythrocyte spin exchange. Fits to cord blood data therefore provide estimates of: χery0, χplas, R2,ery,0, R2,plas, R1,ery,0, R1,plas, Δχdeo, ΔR2,deo, ΔR1,deo, ω0, Δωdeo, τ.
Results
Figure 2 shows T1, T2, and susceptibility data for cord blood specimens. Specimen manipulations provided a range of 0.09-0.82 for Hct and 7-100% for sO2. Data are shown alongside fitted model predictions in Figure 3. Figure 4 shows data for specimens with normal, late-gestation Hct (0.4<Hct<0.5). Estimated model parameters are summarized in Table 1.
Significant improvement in T1 data fit quality was observed when the parameter R1,plas was allowed to vary between subjects. This is largely due to comparatively high R1,plas for patient #1 (circular data markers in Figures 2-4), which may result from elevated plasma protein content.
Discussion & Conclusion
In general, fitted parameter values are consistent with those reported at 1.5T4 and similar to published values for adult blood8,9. Our observations suggest that the data might be better described by a more complex model that included diffusion (the effects of which are more pronounced at higher field) and accounted for plasma protein content. Nevertheless, variations in relaxation time and susceptibility were largely explained by current two-compartment models. The data and parameters we report facilitate accurate interpretation of fetal blood susceptibility and relaxometry data acquired at 3T.
Acknowledgements
The authors thank the donors, the RCWIH BioBank, the Lunenfeld-Tanenbaum Research Institute, and the Mount Sinai Hospital/University Health Network Department of Obstetrics and Gynecology, for the human specimens used in this study (http://biobank.lunenfeld.ca).References
[1] Sun, L., Macgowan, C.K., Sled, J.G., et al. Circulation 2015; 131:1313-1323.
[2] Zhu, M.Y., Milligan, N., Keating, S., et al. Am J Obstet Gynecol 2015; 214:367.e1-367.e17.
[3] Neelavalli, J., Jella, P. K., Krishnamurthy, U, et al. J Magn Reson Imaging 2013; 39:998-1006.
[4] Portnoy, S., Osmond, M., Zhu, M.Y. et al. Magn Reson Med 2016; doi: 10.1002/mrm.26231.
[5] Victoria, T., Johnson, A. M., Edgar, J. C., et al. Am J Roentgenol, 2016; 206:195-201
[6] Schenck, J.F. Med Phys 1996; 23:815-850.
[7] van Zijl, P. C., Eleff, S. M., Ulatowski, J. A., et al. Nat Med, 1998; 4:159-167.
[8] Li, W., Grgac, K., Huang, A., et al. Magn Reson Med 2015; 76:270-281.
[9] Jain, V., Abdulmalik, O., Propert, K. J., Wehrli, F.W. Magn Reson Med 2012; 68:863-867.
[10] Marques, J. & Bowtell, R. Concepts Magn Reson 2005; 25B:65-78.
Figures
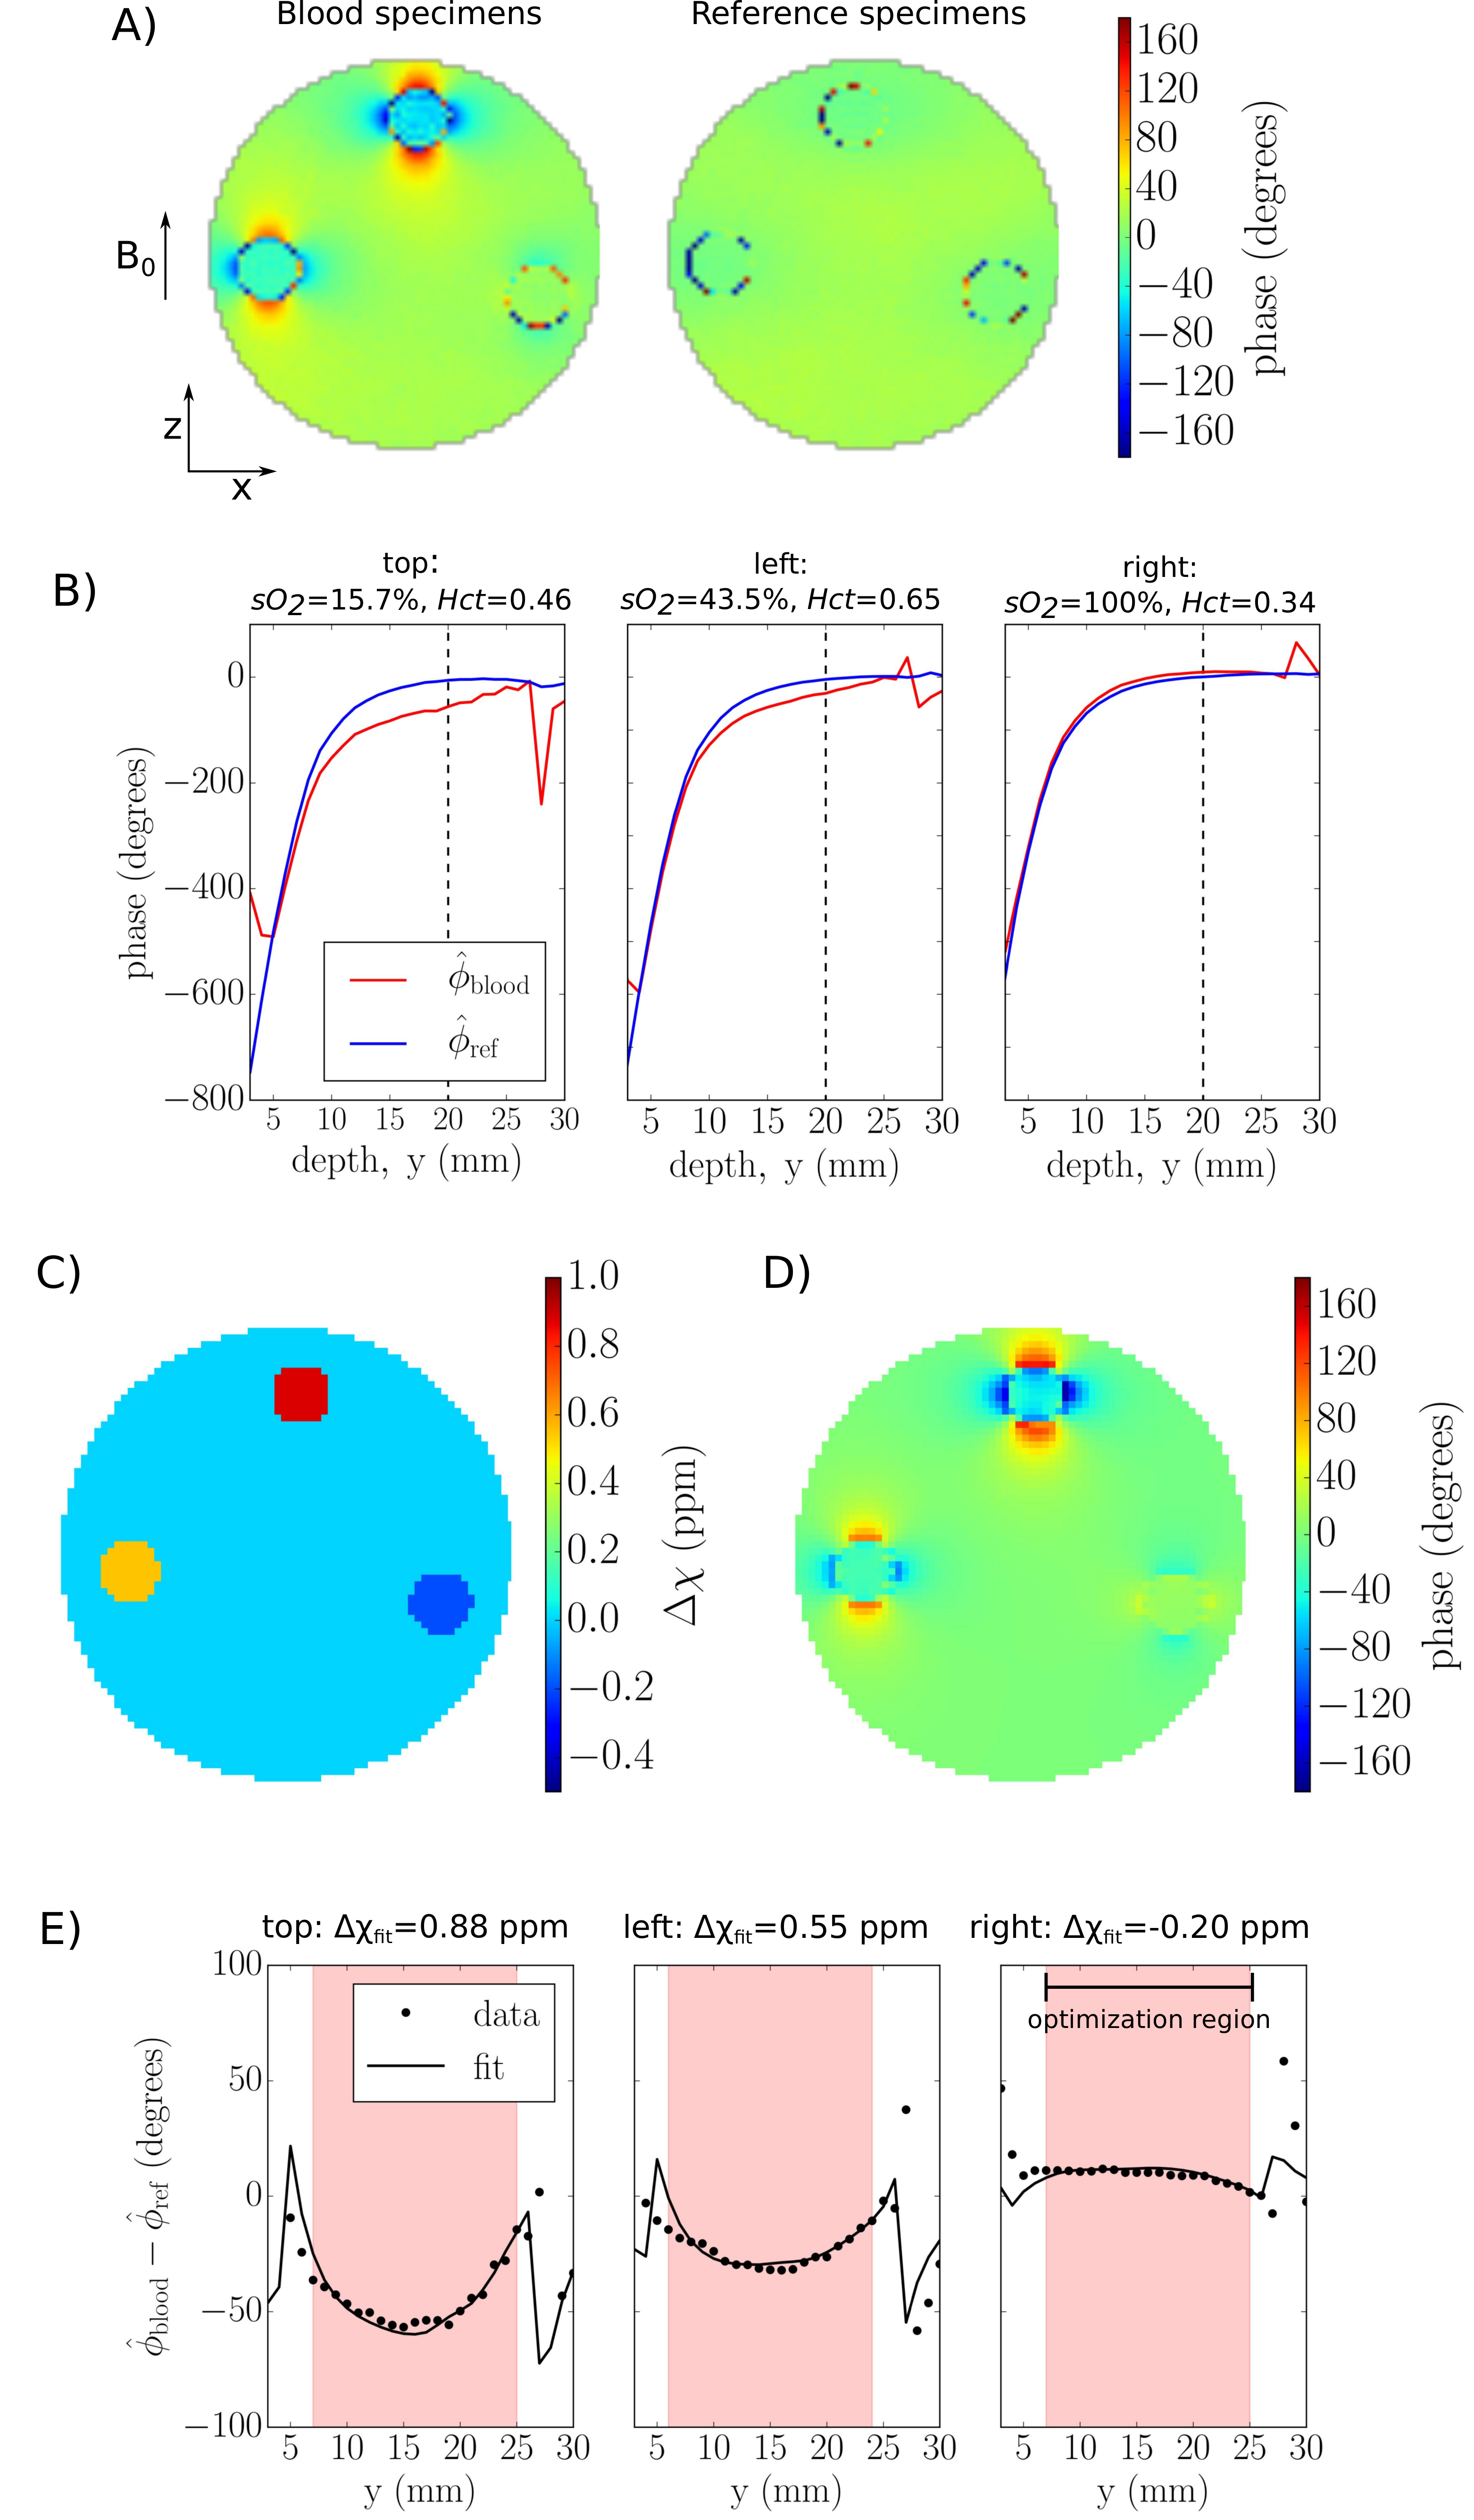
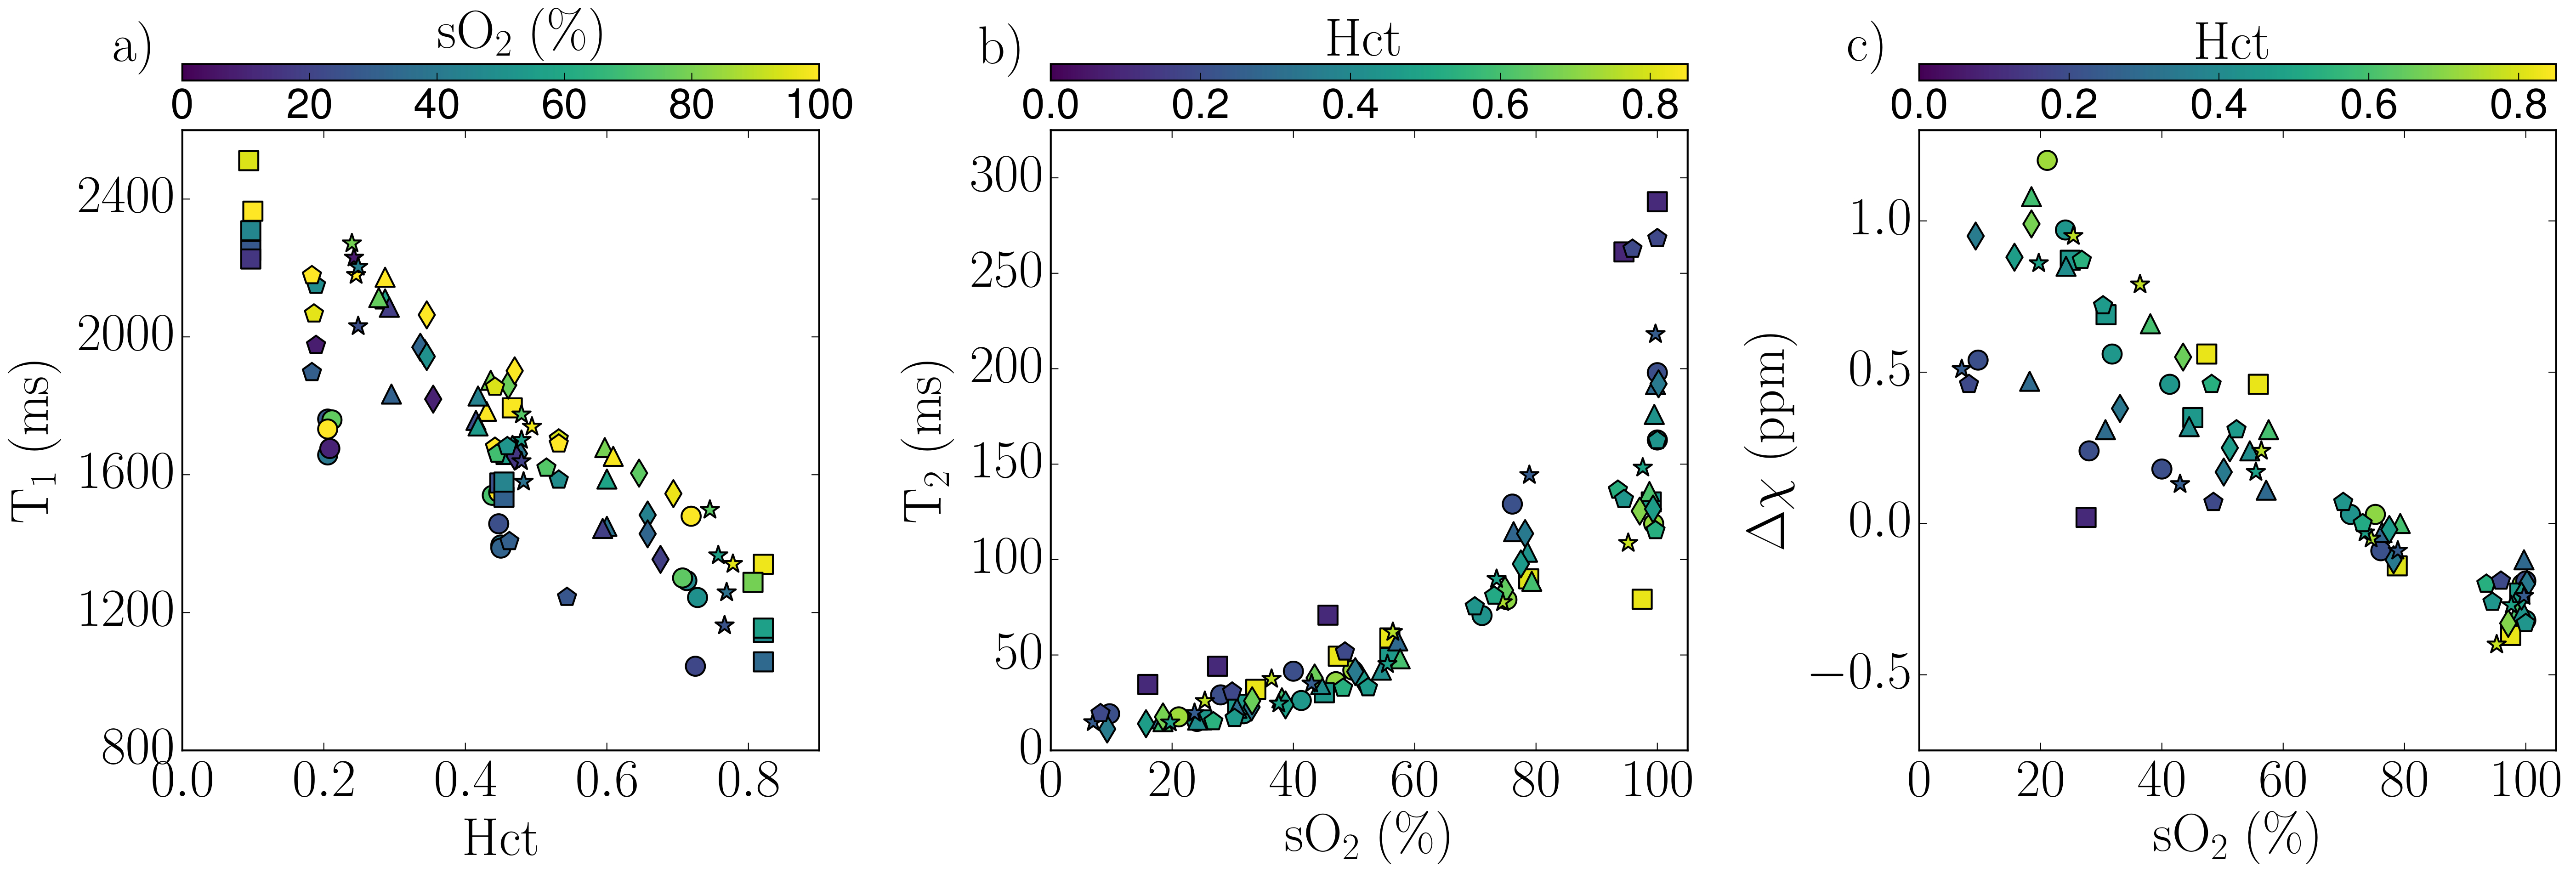
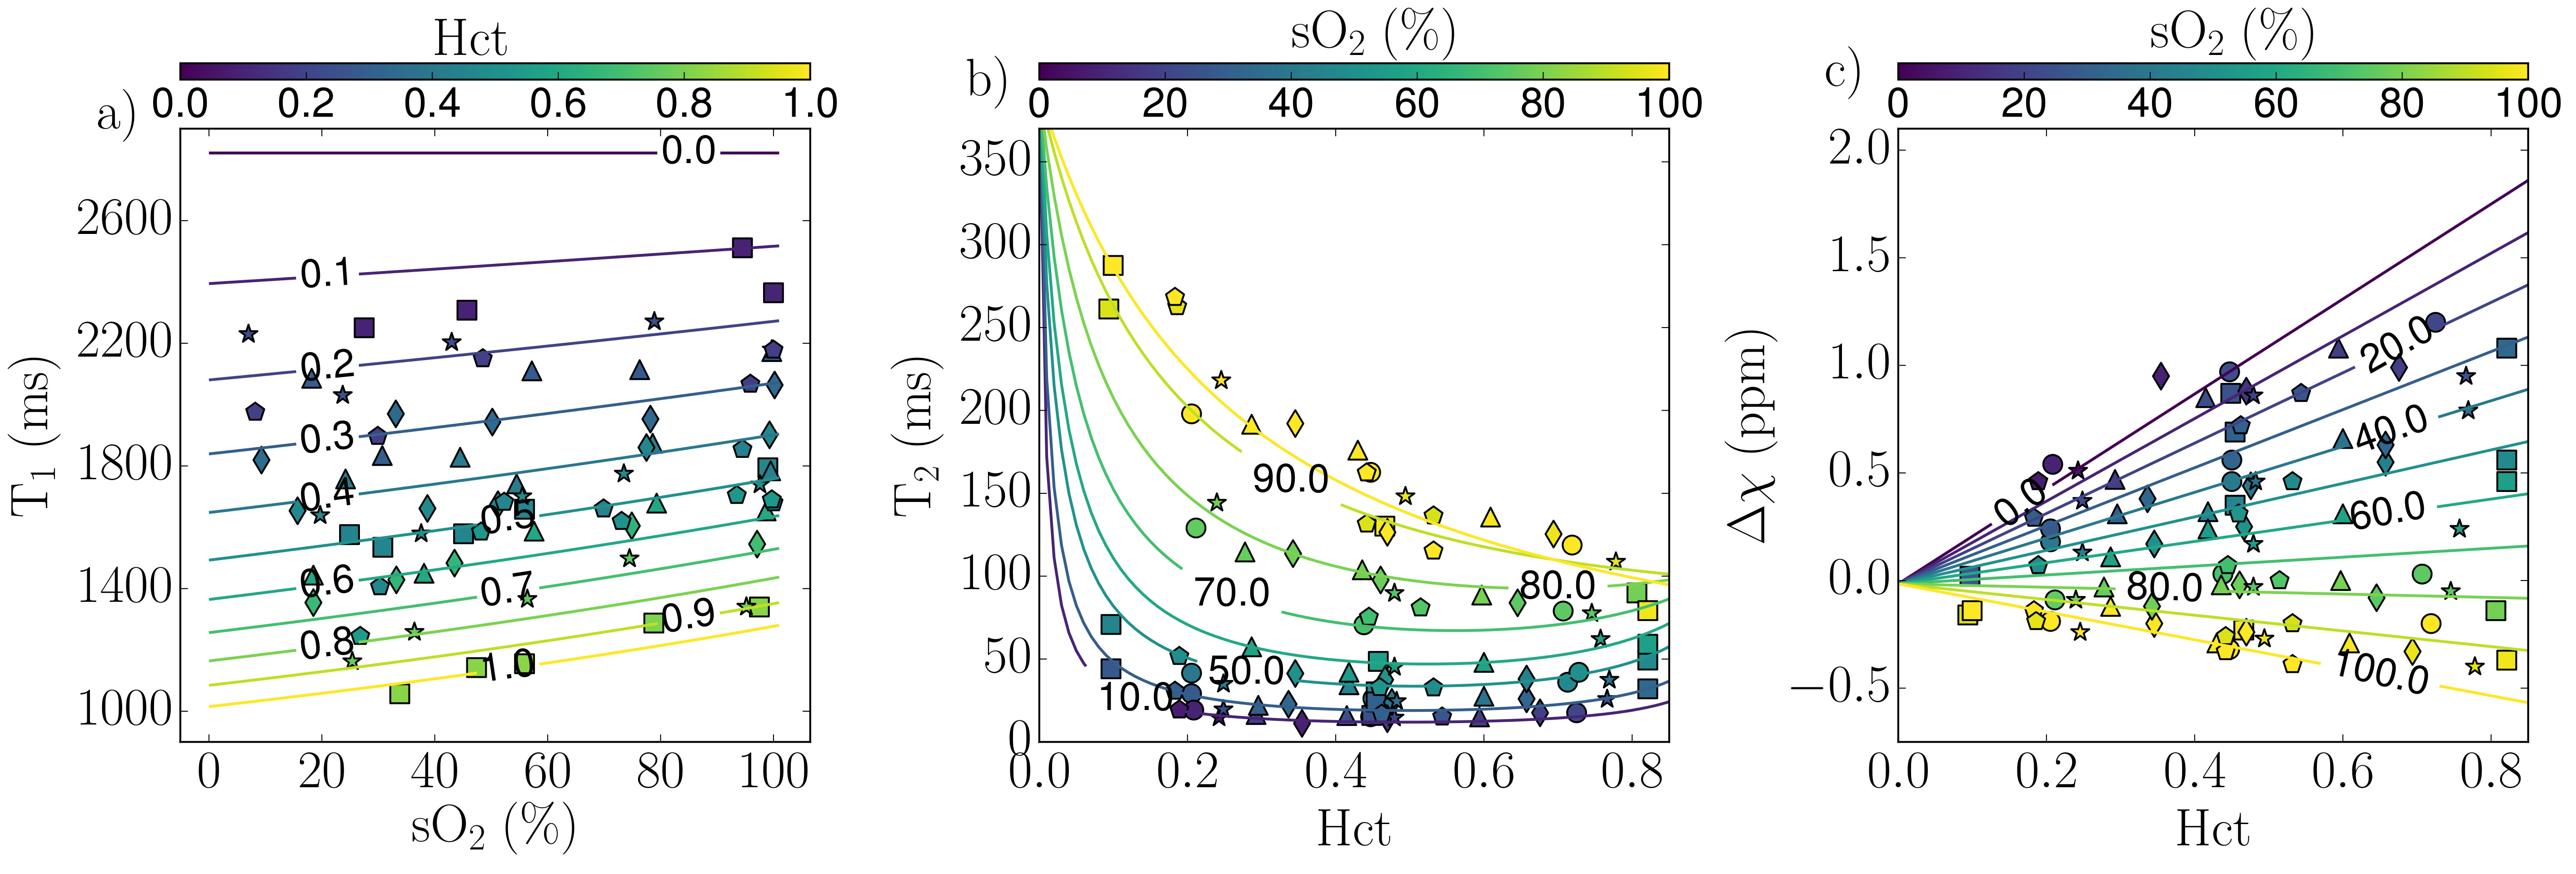
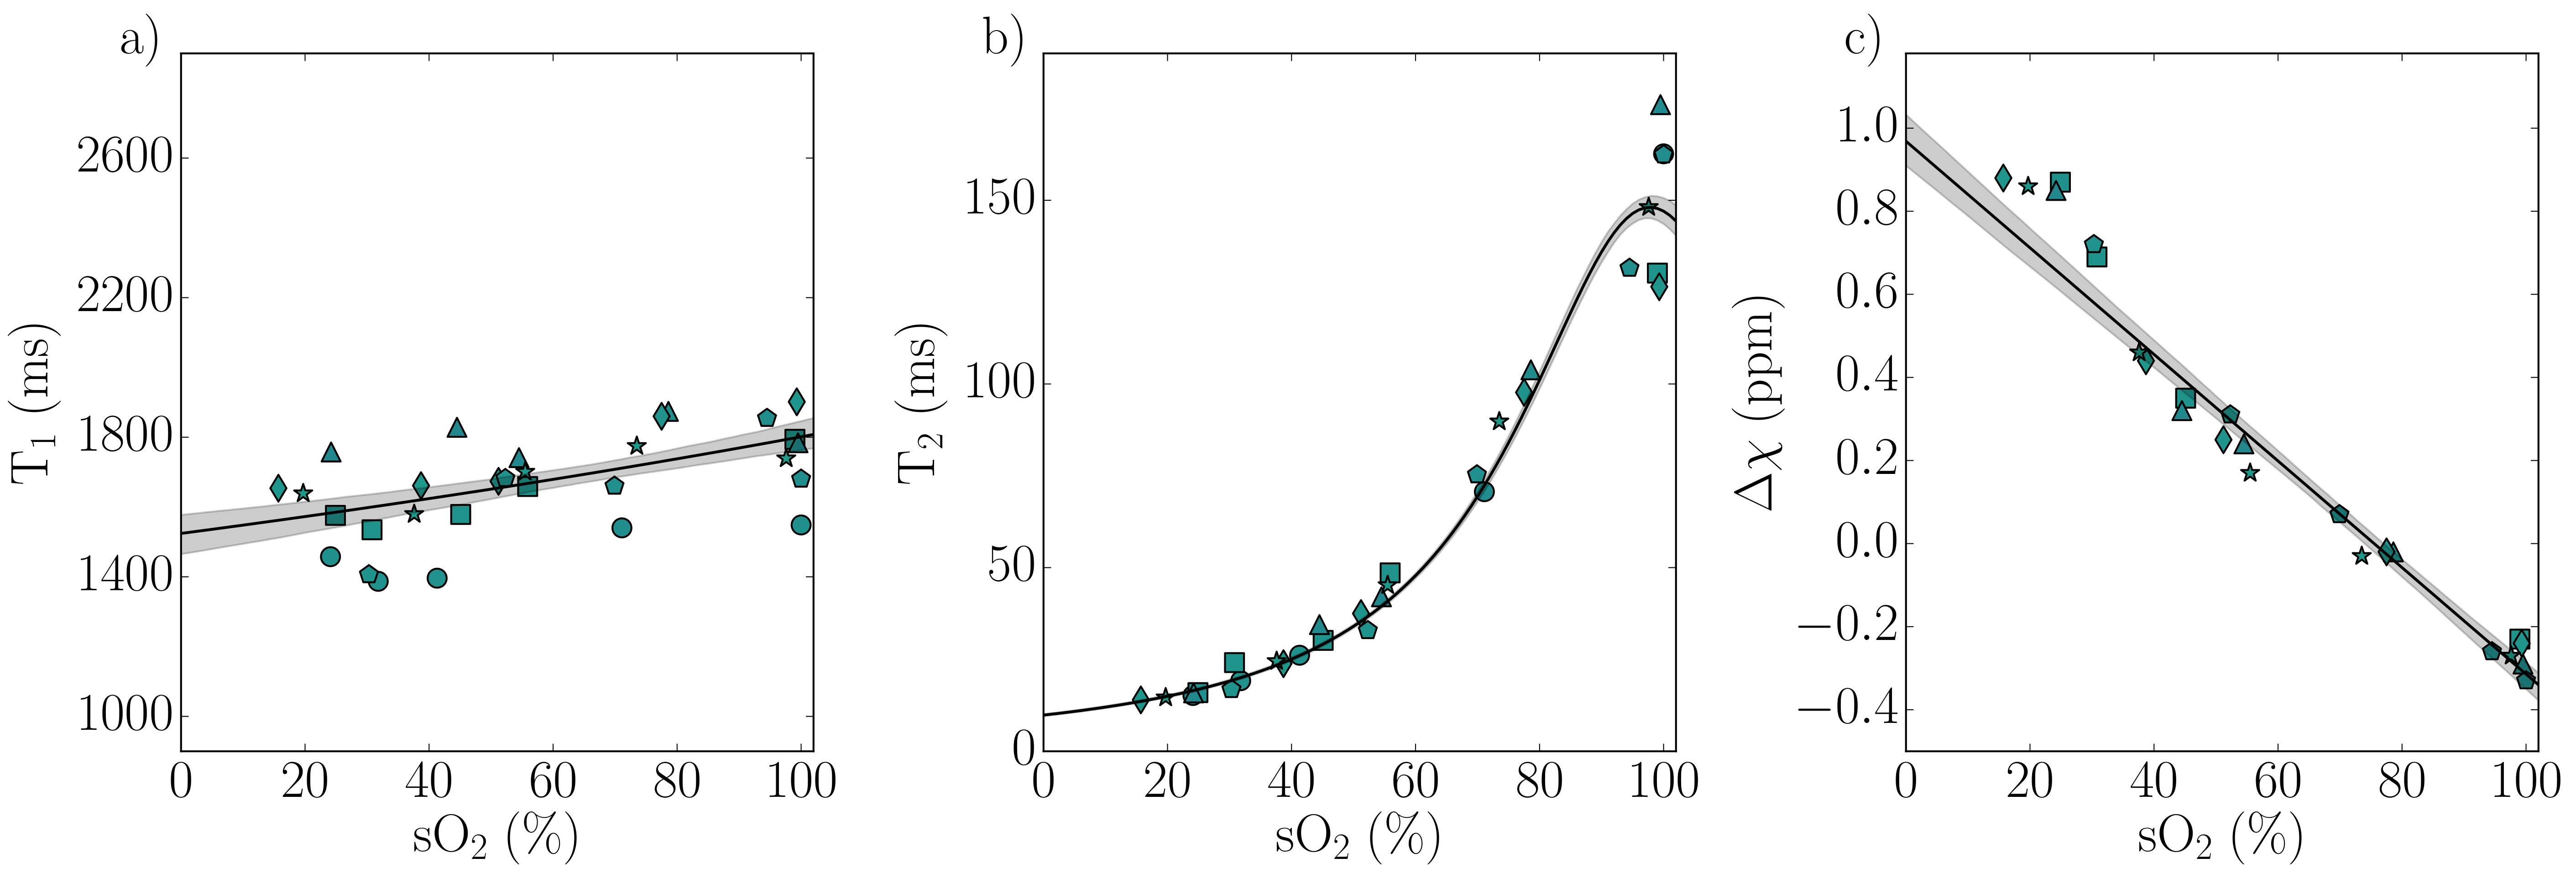
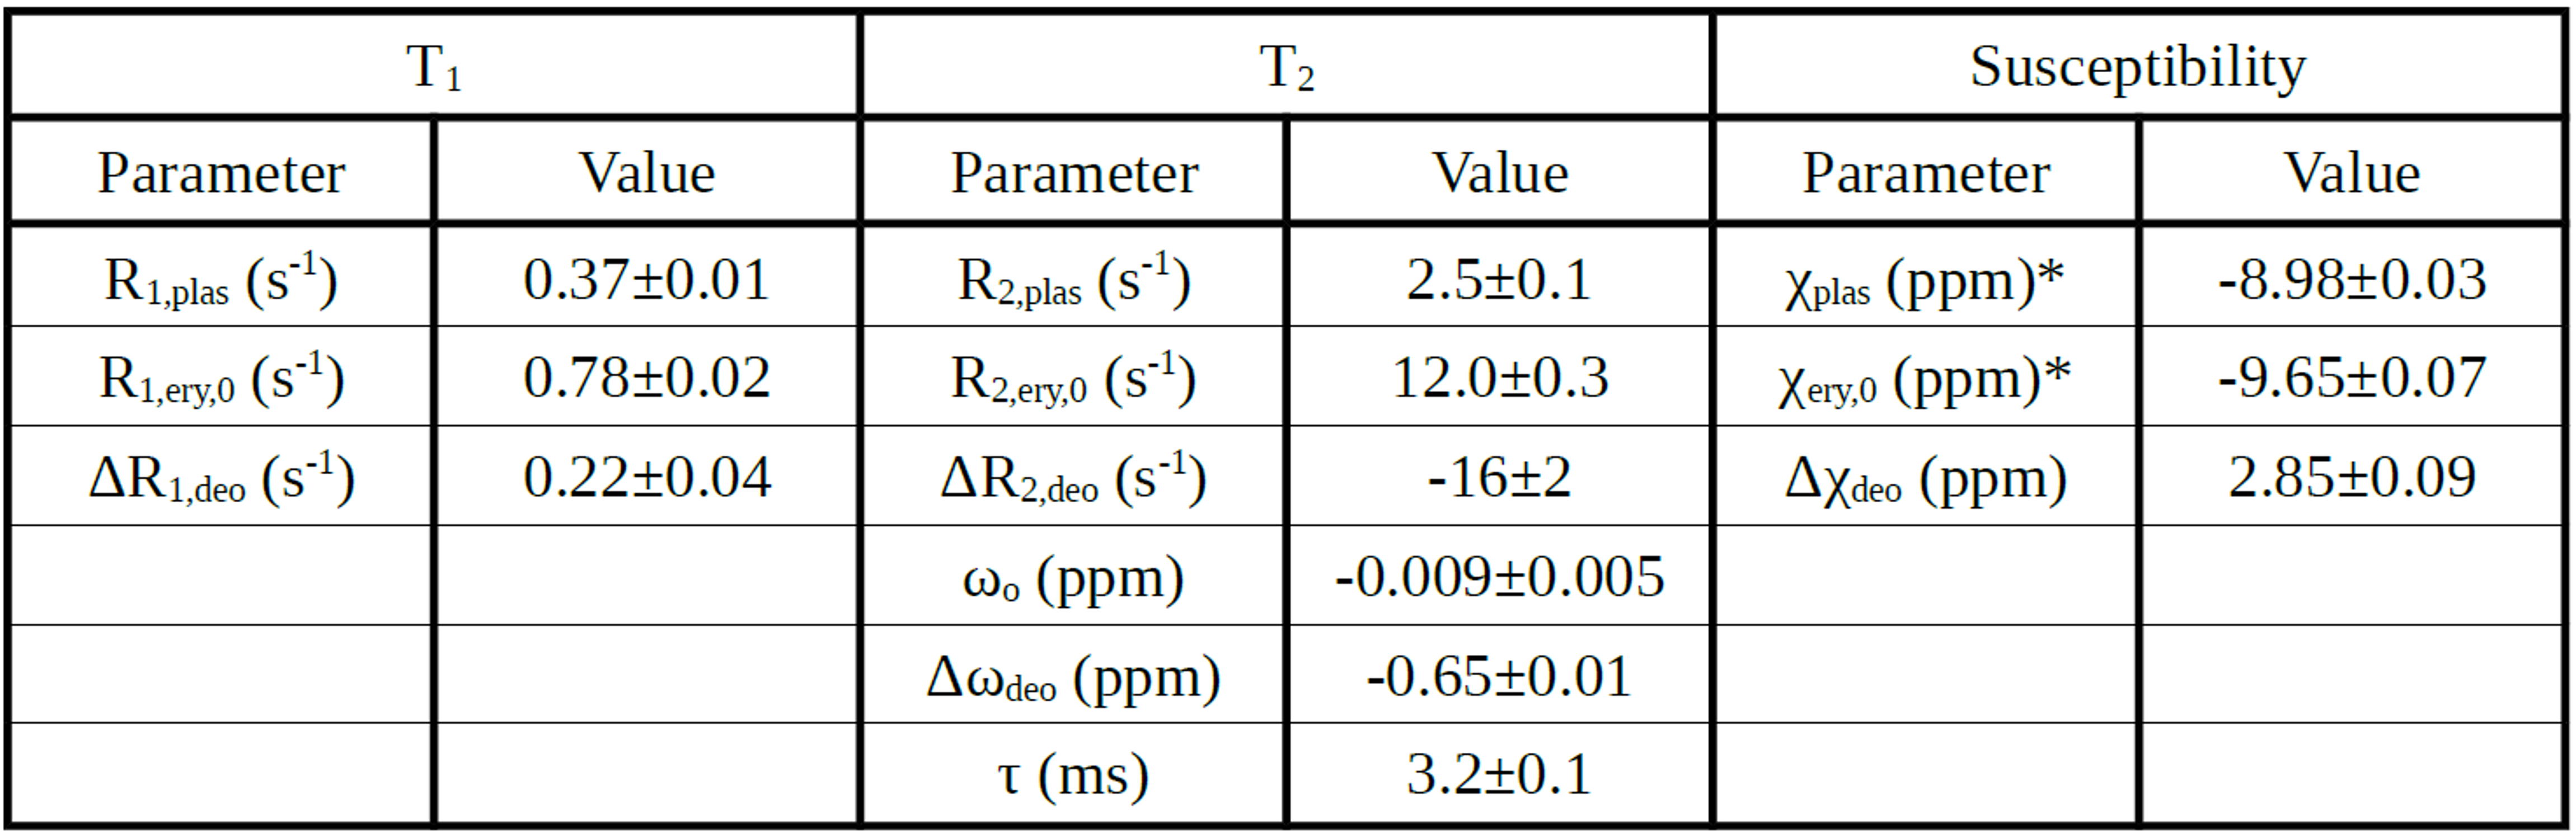
Table 1: Fitted Parameters. Values for χplas and χery,0 are based on assumed bath water susceptibility of -8.97 ppm (χbath=χwater + 0.2x10⁻⁶ ·χM,Gd, where 0.2x10⁻⁶ mol/mL is bath water Gd concentration, χwater=-9.04 ppm and χM,Gd=0.34 mL/mol)6.
Note the non-physical value obtained for ΔR2,deo, (-16 s-1). This likely resulted from the lack of data at short τ180 (<5 ms) to constrain this parameter, together with the inherent model assumptions of fast exchange without diffusion.