1936
Measurement of T1, T2, and flip angle with double-angle inversion-recovery balanced steady state free precession with application to imaging the eye1Research Imaging Institute and Ophthalmology, University of Texas Health Science Center, San Antonio, TX, United States, 2Research Imaging Institute, University of Texas Health Science Center, San Antonio, TX, United States, 3Biomedical Engineering, University of Texas at San Antonio, San Antonio, TX, United States
Synopsis
Fast measurement of T1 and T2 can be made with high signal to noise using inversion-recovery Look-Locker (LL) bSSFP. However, the LL-bSSFP signal is dependent on the flip angle, which must be known for accurate T1 and T2 calculation. In this study we investigated methods to additionally map and correct for the flip angle with the acquisition of two LL-bSSFP scans with two different flip angles, avoiding the need for a separate flip angle mapping protocol. Simulations and scans of the eye showed that T1, T2, and the flip angle could be measured with the double-angle LL-bSSFP method.
Purpose
Fast measurement of T1 can be made using inversion-recovery Look-Locker (LL) methods in which multiple measurements at different inversion times are made after a single inversion pulse.1 Balanced steady state free precession (bSSFP) readouts provide high SNR compared to spoiled gradient echo sequences and additionally allow for T2 measurement.2 However, the LL-bSSFP signal is strongly dependent on the flip angle (FA), which must be known for accurate calculation of T1 and T2.2 In this study we investigate a method to map the FA in addition to T1 and T2 with acquisition of two LL-bSSFP scans with different FA, avoiding the need for a separate FA-mapping protocol.Methods
The LL-bSSFP signal can be modeled as approximately monoexponential with apparent relaxation time T1*.2,3 From fitting T1*, as well as steady state signal Sst, and apparent inversion time, T1 and T2 can be calculated as in.2 The equations for T1* and Sst from2 can be combined to give
$$S\scriptsize{st}\normalsize=M\scriptsize0\normalsize\cdot\sin\alpha\cdot\frac{T\scriptsize1\normalsize^*}{2T\scriptsize1}\quad\quad{Eq.1}$$
If two LL-bSSFP scans are acquired with different FA (denoted as subscripts A and B) with a known ratio of k=αB/αA, then the FA can be found from the ratio SstB/SstA from Eq.4 after fitting Sst, T1*, and INV for both FA. With a FA ratio k=2, FA can be directly calculated as
$$\alpha\scriptsize{A}\normalsize=\arccos(\frac{S\scriptsize{stB}}{2S\scriptsize{stA}}\frac{T\scriptsize1A\normalsize^*}{T\scriptsize1B\normalsize^*})\quad\quad{Eq.2}$$
and then T1 and T2 are calculated from T1*, INV, and α as in.2,3 Herein T1 was calculated from the smaller FA data and T2 from the larger FA data, as T1* is more dependent on T1 with small FA and T2 with large FA.2
LL-bSSFP Bloch simulations were run with multiple T1/T2 and double FA, with TR/TE=5/2.5ms, 180o precession per TR and no phase cycling, instantaneous RF pulses, 180o inversion, and α/2 preparation pulse. The number of excitations was varied (from 200-2260) to allow recovery to 90% of Sst for each T1/T2/α. Twenty points, equally spaced across the acquisition, were used for fitting. Complex Gaussian noise was added for 1000 simulations and the magnitude taken for SNRs of 100 and 25 (maximum Sst / SD of noise magnitude). In addition to fitting as above, the performance of a four-parameter fit of the full LL-bSSFP signal4 directly for T1, T2, M0, and α was tested.
MRI scans were performed at 3T (Siemens). Phantom scans using a 8-channel head coil were performed using LL-bSSFP
with FA=70/35o, FOV=100x100mm, slice thickness=5mm, matrix=176x176, TR/TE=5.3/2.3ms,
21 TIs spaced by 472ms, 2 shots, and 25s between inversions. Scans of the eye
of a human volunteer were performed with a 7cm surface coil. LL-bSSFP was
performed with FA=70/35o, FOV=64x96mm, slice thickness=3.5mm,
matrix=128x192, TR/TE=5.5/2.4ms, 18 TIs spaced by 532ms, 2 shots, and 25s
between inversions. Standard IR-FLASH was also acquired with FOV=100x100mm, matrix=128x128, 5mm
slice, TR/TE=3.6ms, TR=30s, FA=7o, and 11 TIs from 370 to 9000ms.
Results
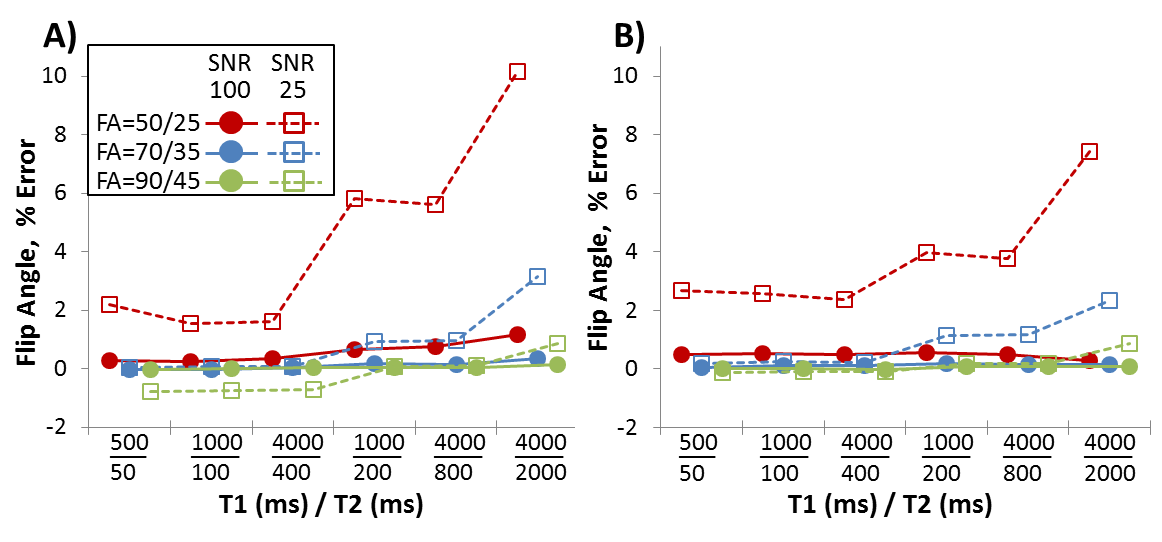
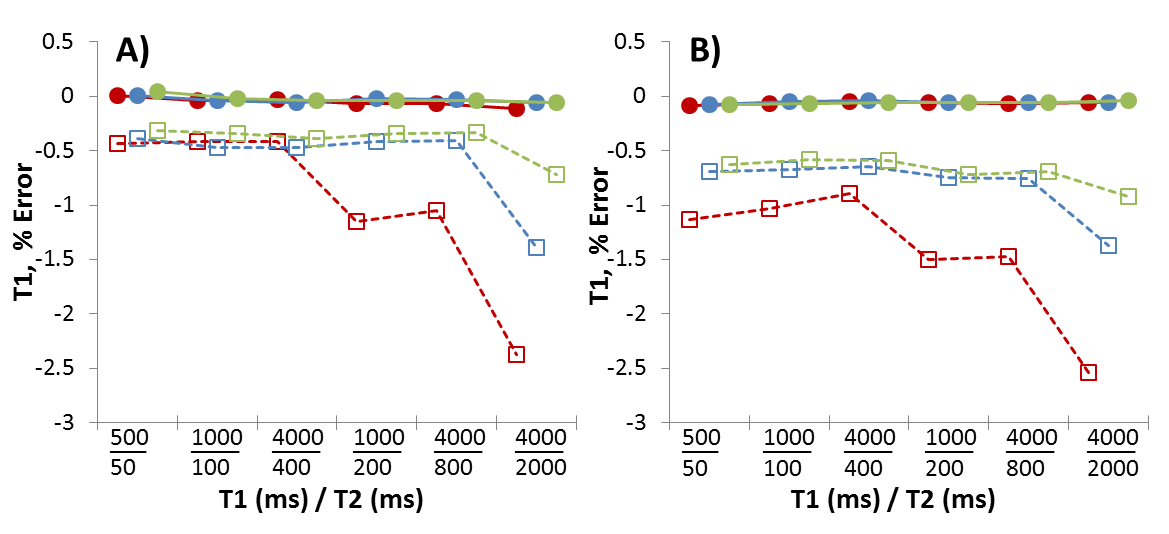
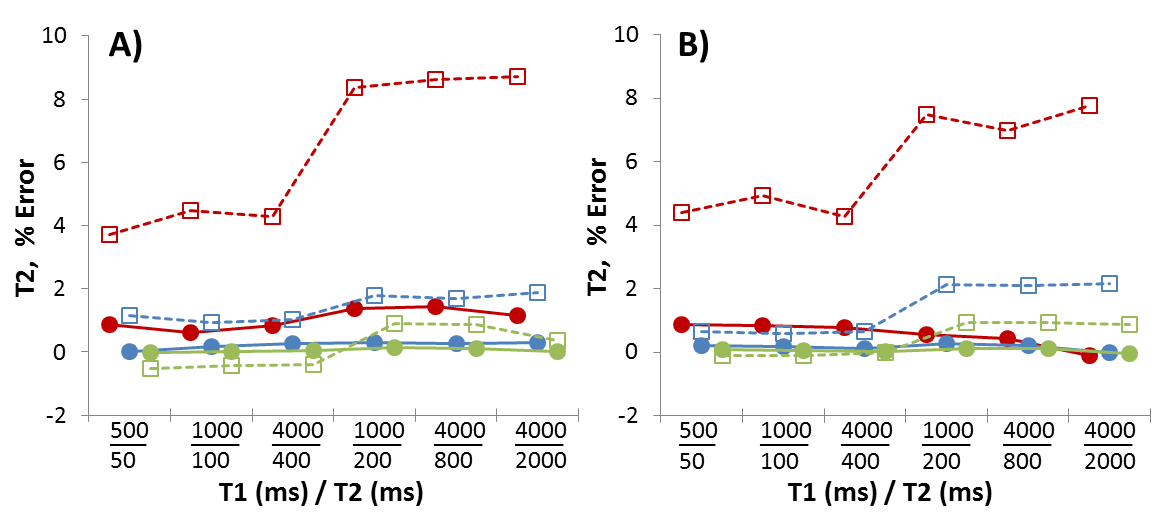
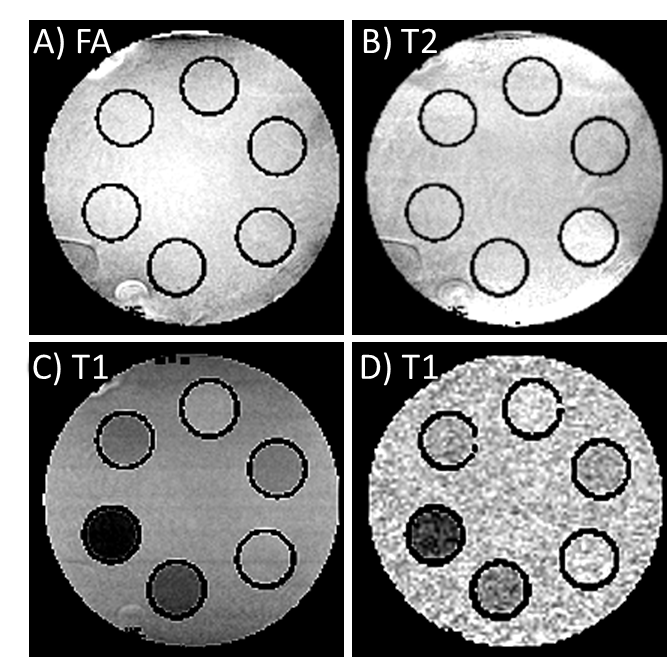
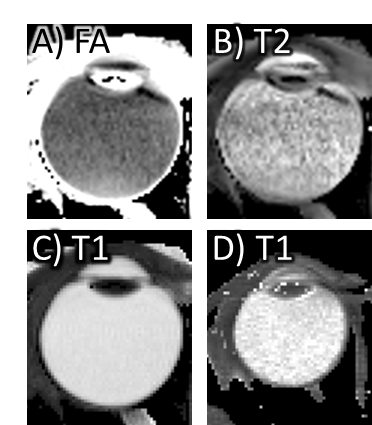
From simulated data, the % error in the calculated FA (Fig 1), T1 (Fig 2), and T2 (Fig 3) were calculated using both fitting methods. Both fitting methods gave similar results, with more biased values occurring with the smallest pair of flip angles (50/25o). Fig 4 and 5 show FA, T2, and T1 maps on a phantom and eye. From the 6 phantoms, T1 from LL-bSSFP correlated with that from IR-FLASH with a slope of 0.92. From LL-bSSFP in the vitreous, FA was 26.2o, T1 was 4.4s, and T2 was 1.9s. T1 from IR-FLASH was 4.6s.Discussion
The LL-bSSFP signal is sensitive to the flip angle, which could be measured with the acquisition of a second fast LL-bSSFP scan with a different FA. The two fitting methods to calculate T1/T2/FA both provided reasonable values, although lower SNR could bias results, with larger FA tending to give more accurate results. There were some errors using Eq.2 at low FA and SNR, but since the FA varies slowly over the image, spatial smoothing could be performed if needed prior to flip angle calculation for data acquired with low flip angles or SNR. T1 from LL-bSSFP tended to be a little lower compared to IR-FLASH, which could be due to noise (as in Fig 2). T1 and T2 calculation from LL-bSSFP data is also sensitive to off-resonance and imperfect slice profiles,4 so further studies should investigate these effects on parametric mapping with the double angle LL-bSSFP method. In conclusion, the double angle LL-bSSFP method can be used to measure T1, T2, and flip angle, avoiding the need for a separate FA-mapping protocol.Acknowledgements
Eric Muir, PhD holds a Voelcker Fund Young Investigator Award from the Max and Minnie Tomerlin Voelcker Fund.References
1. Brix G, Schad LR, Deimling M, et al. Fast and precise T1 imaging using a TOMROP sequence. Magn Reson Imaging 1990;8:351–356.
2. Schmitt P, Griswold MA, Jakob PM, et al. Inversion recovery TrueFISP: quantification of T(1), T(2), and spin density. Magn Reson Med 2004;51:661–667.
3. Gulani V, Schmitt P, Griswold MA, et al. Towards a Single-Sequence Neurologic Magnetic Resonance Imaging Examination: Multiple-Contrast Images From an IR TrueFISP Experiment. Invest Radiol 2004;39:767-774.
4. Cooper
MA, Nguyen TD, Spincemaille P, et al. Flip Angle Profile Correction for T1 and
T2 Quantification With Look-Locker Inversion Recovery 2D Steady-State Free
Precession Imaging. Magn Reson Med 2012;68:1579-1585.
Figures