1935
Spatial distribution of myelin concentration in healthy volunteers measured in GRE myelin water imaging, ViSTa myelin water imaging, quantitative MT and DTI1Department of Electrical and Computer Engineering, Seoul National University, Seoul, Korea, Republic of, 2Department of Biomedical Engineering, Hankuk University of Foreign Studies, Yongin, Korea, Republic of
Synopsis
This study investigated the spatial distribution of several myelin imaging methods. Myelin water fraction in GRE-MWI, apparent MWF in ViSTa-MWI, fractional pool size (F) in qMT, MT saturation, MT ratio, and FA in DTI were compared for their spatial distribution in white matter. Strong correlations were measured particularly between GRE-MWI and ViSTa-MWI and also among MT contrasts. FA showed least correlations with the other parameters.
Introduction
Over the last decades, a number of imaging methods have been proposed as potential biomarkers for myelin. In this work, we utilized three primary modalities, myelin water imaging1, magnetization transfer imaging2, and diffusion tensor imaging3, to investigate the spatial distribution of myelin concentration in healthy volunteers. Two different myelin imaging methods, GRE-myelin water imaging (GRE-MWI)4 and Direct Visualization of Short Transverse Relaxation Time Component (ViSTa) MWI5 were acquired for their (apparent) myelin water fraction. In MT, quantitative MT imaging6 was acquired to generate fractional pool size (F), MT saturation (MT_sat)7, and MT ratio (MTR). Lastly, fractional anisotropy (FA) from diffusion tensor imaging (DTI), which is commonly considered as an indirect measure of myelin concentration in neuroimage8 was also acquired.Methods
Data were collected from three healthy subjects at 3T (IRB approved). GRE-MWI: 2D multi-echo GRE was acquired with TR = 1400 ms, TE = 2.5:2.2:33 ms, flip angle = 79˚, and number of echoes = 15. Complex data were fit to a three-pool complex model to generate myelin water fraction9. ViSTa-MWI: 3D segmented EPI acquisition with double inversion pulses was acquired5. TR/TE = 1160/6.4 ms, TI1/TI2/TD=560/220/300 ms. A reference scan (GRE, TR = 100 ms, flip angle = 25˚) was acquired for apparent MWF calculation. Quantitative MT: SPGR with 500˚ and 800˚ MT pulses (1, 2, 4, 8, and 12 kHz offset frequency) were acquired. Additionally, SPGR without MT pulse, a T1 map, and a transmit B1 map were acquired for qMT data processing10. Using the dataset of 800˚ and 1 kHz MT pulse, MTR and MT_sat were generated. DTI: TR/TE = 3500/72 ms, b-value = 1000 s/mm2, and gradient directions = 36. An FA map was calculated using FSL11. All sequences were acquired at 2 mm isotropic voxel size covering 48 slices except the B1 map (5 mm thickness and 11 slices). The scan times for myelin sequences were adjusted for approximately 10 minutes.
All images were aligned to the FA map using a rigid body registration. A white matter mask was generated by thresholding each image and multiplying all results. Then, a voxel-wise correlation was calculated within the mask for each pair of the six myelin contrasts. Additionally, myelin concentrations were estimated in major fiber bundles using the JHU template. The FA map was registered to the template using nonlinear registration12. This registration information was applied for all the other images. In the JHU atlases, 13 ROIs excluding small fibers, which showed large registration errors, were overlaid to calculate the mean ROI values. Using the ROI data, scatter plots were generated to calculate correlations between GRE-MWI and the other images.
Results
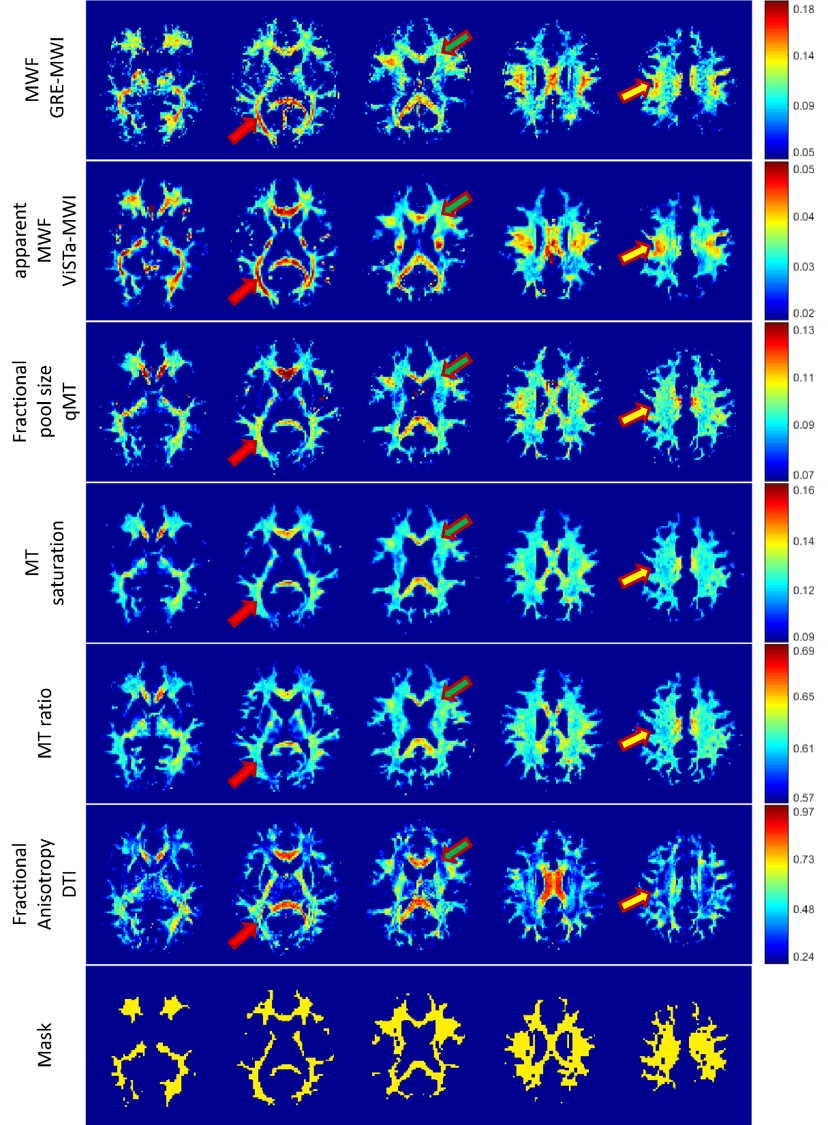
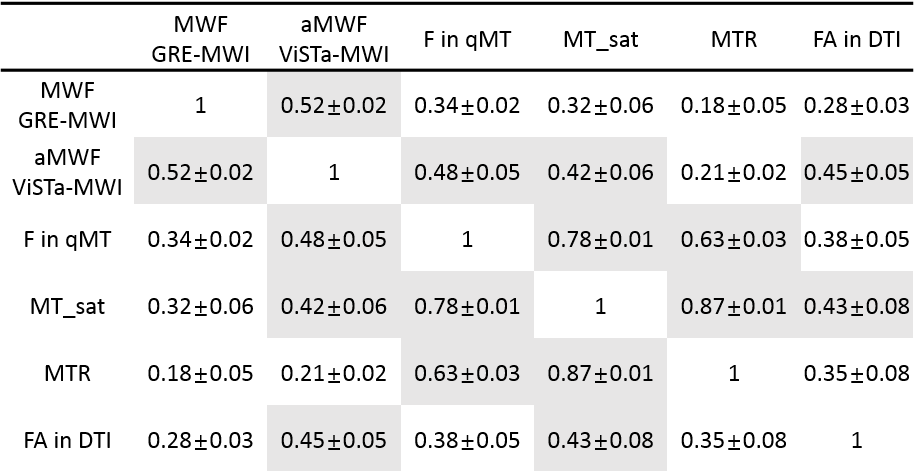
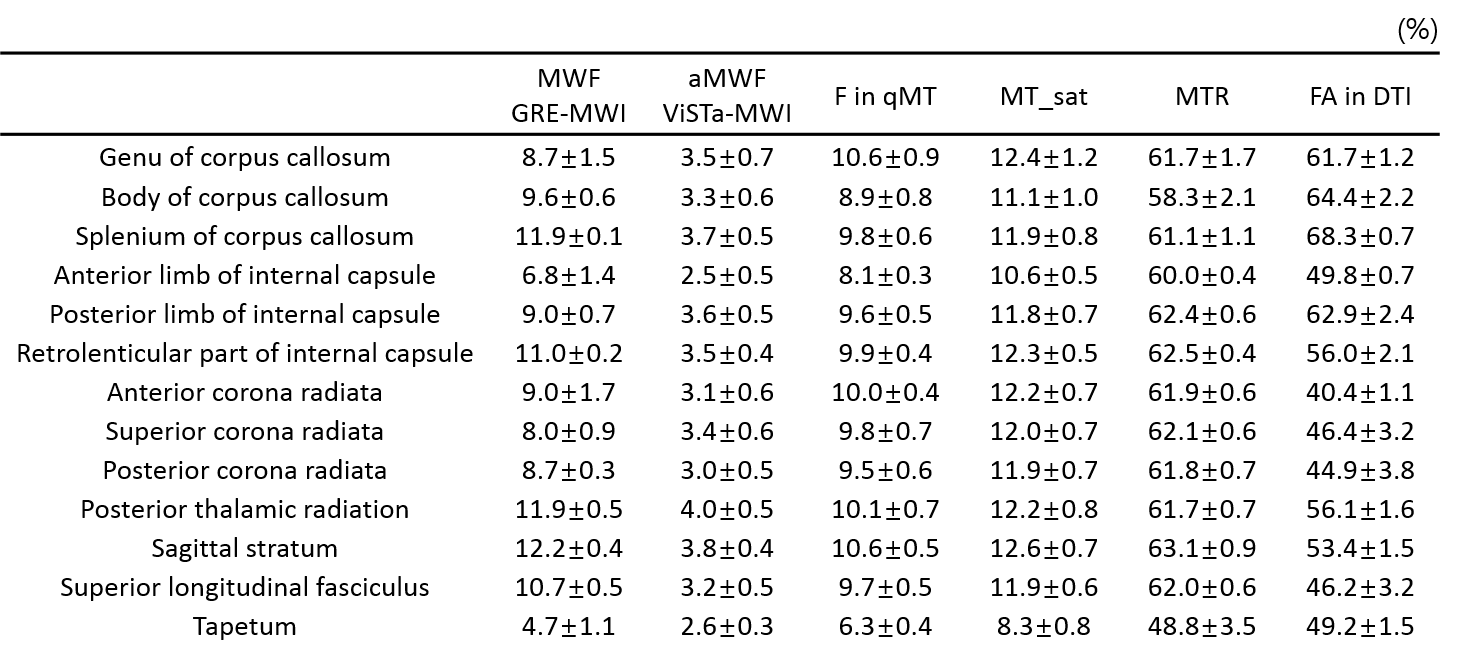
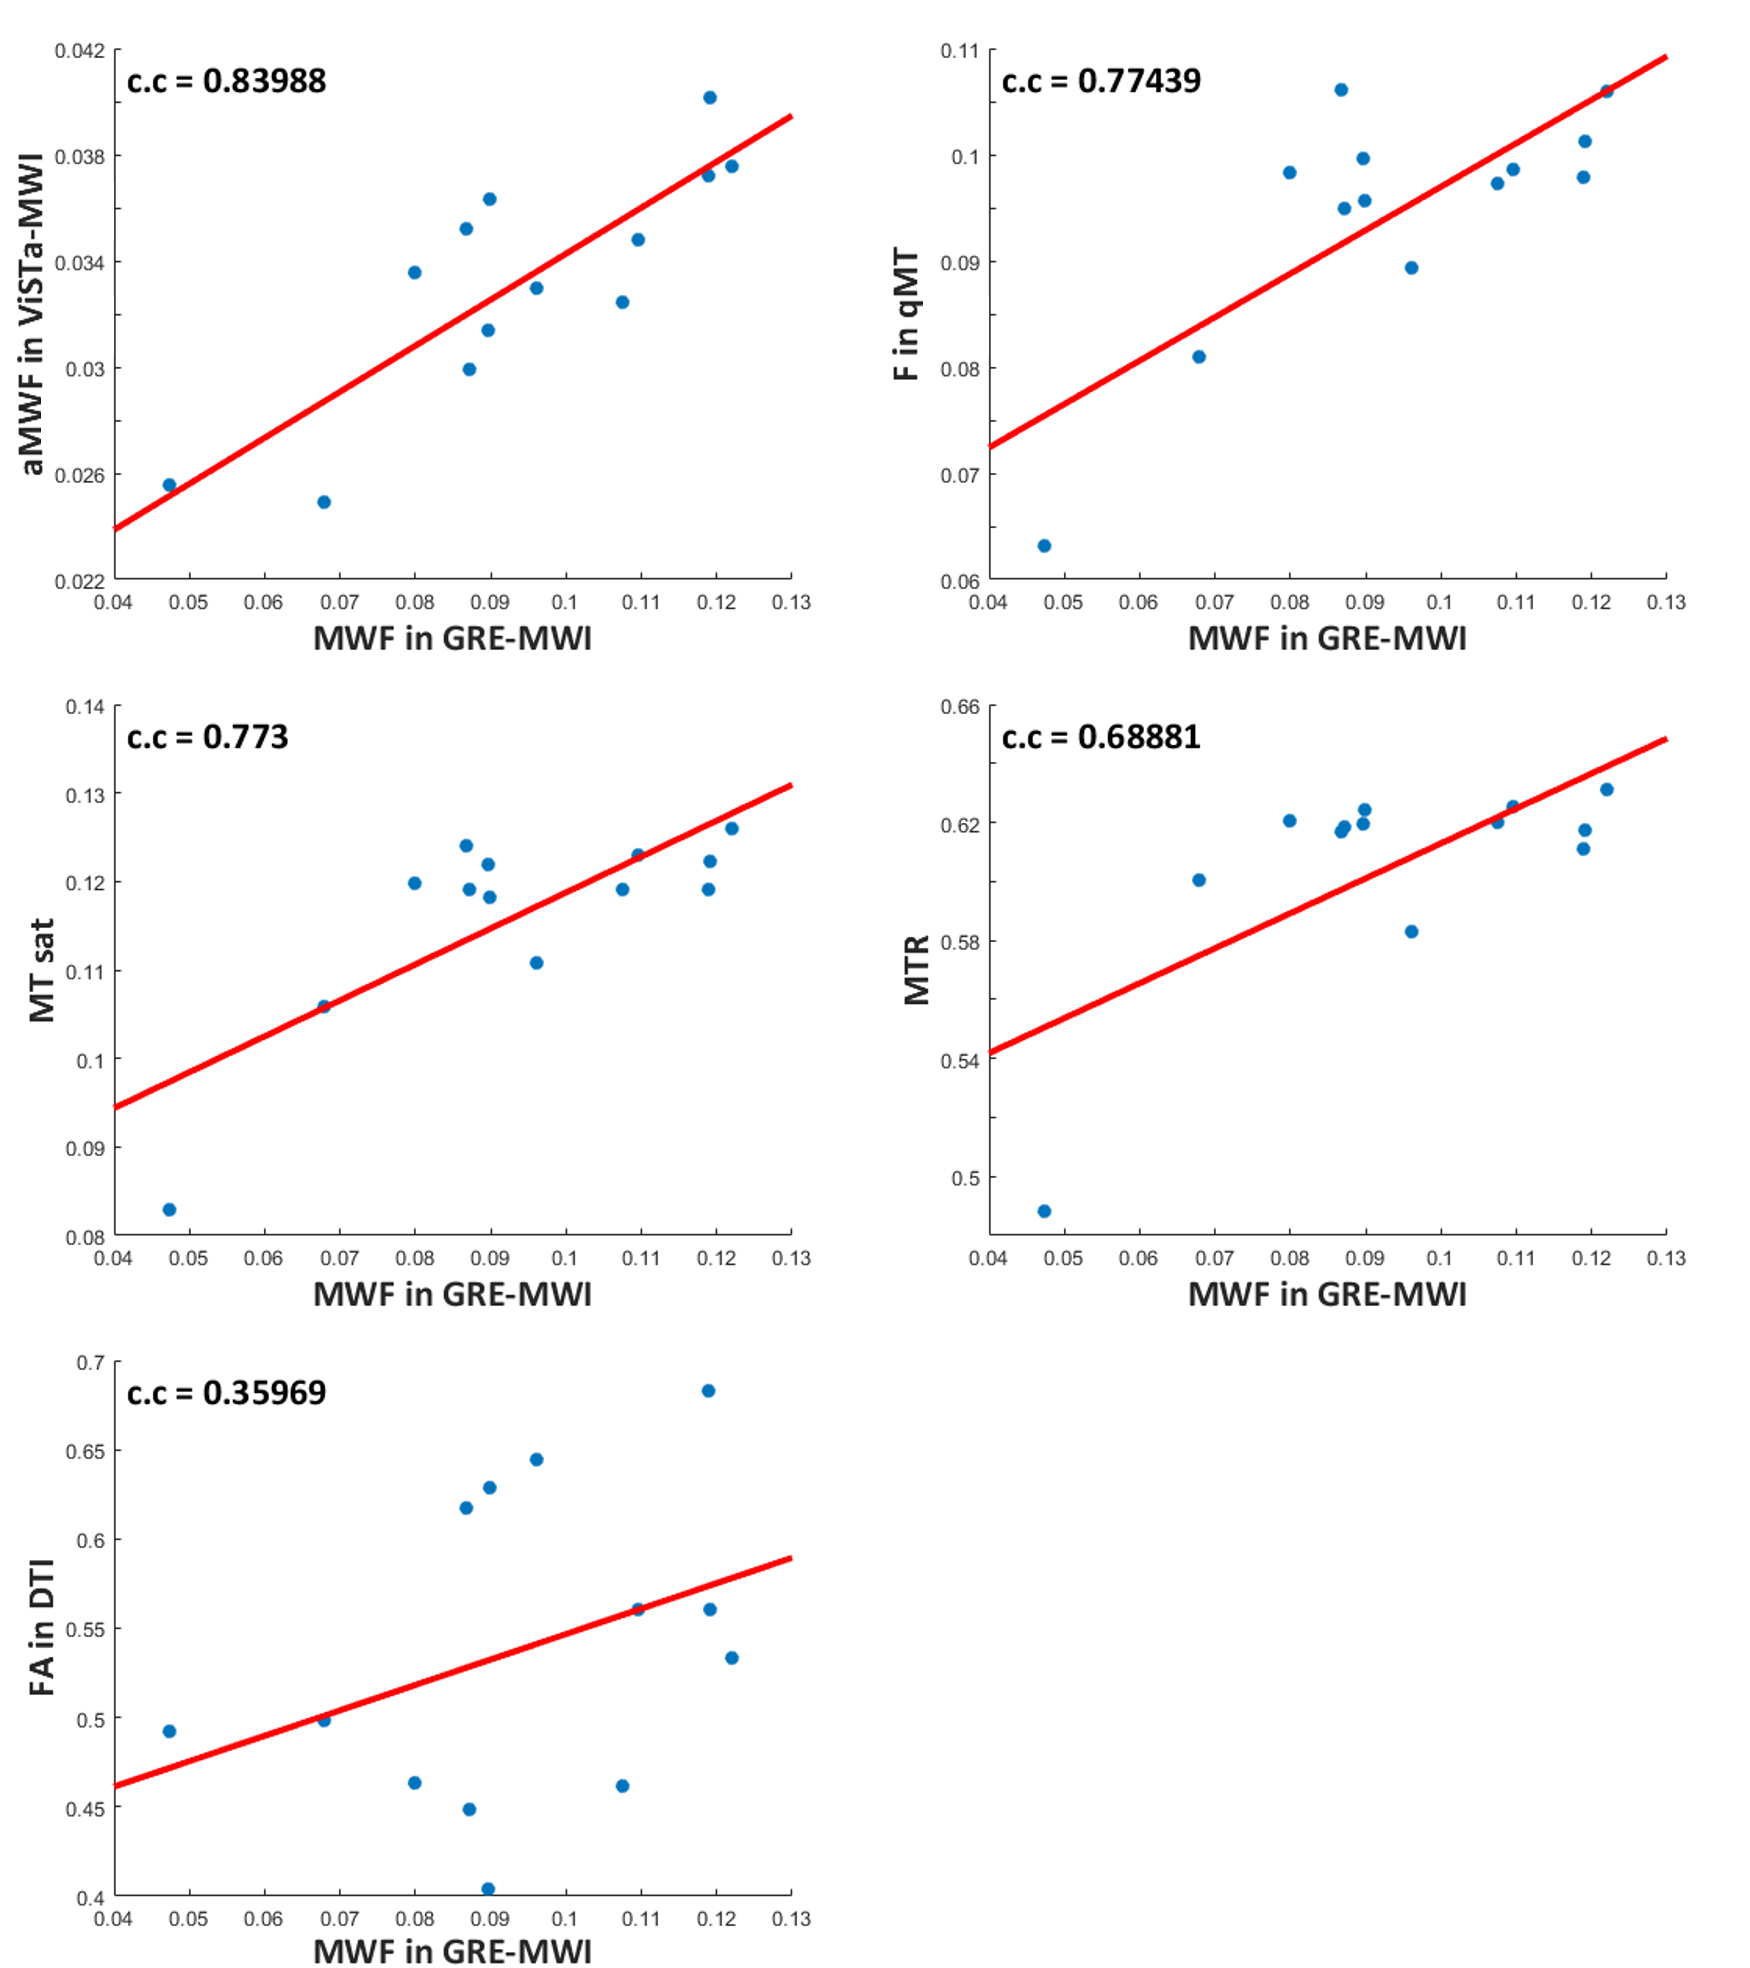
Figure 1 shows the images of five slices from each method and the mask. Overall, the parametric maps show certain levels of similarity across the methods, which can be confirmed in the correlation results (Table 1). When GRE-MWI was compared with the other methods, ViSTa-MWI shows the highest similarity and correlation coefficient (= 0.52) while FA and MTR show the lowest correlations (0.28 and 0.18 respectively). The three MT-related contrasts, F in qMT, MT_sat, MTR, show high correlations among themselves (0.63 to 0.87) but reveals relatively low correlations with GRE-MWI (0.18 to 0.34). In Figure 1, optic radiation (red arrow) demonstrates high concentration of myelin in GRE-MWI and ViSTa-MWI whereas the other contrasts show relatively low myelin concentration. The similar pattern is shown in superior longitudinal fasciculus (yellow arrow). In crossing fiber regions (green arrow), FA shows very low signal intensity while the other images reveal moderate signal intensity. Table 2 summarizes the mean values of the 13 major fiber bundles. When these values are plotted with respect to those from the GRE-MWI results (Figure 2), a very strong correlation (>0.83) is observed with ViSTa-MWI. The MT-related parameters also report high correlations (0.69 to 0.77) but most measurement points are grouped in a narrow range (e.g. 0.11 to 0.13 in MT_sat), suggesting relatively low sensitivity to myelin concentration variations. The FA result shows a poor correlation (0.36).Discussion and Conclusions
In this study, six different myelin-related imaging methods were measured to explore the spatial distribution of myelin and the correlations among the methods. GRE-MWI and ViSTa-MWI showed a high correlation, suggesting that they may share the same signal origins. The MT-related parameters have lower correlations with a few areas (e.g. optic radiation and superior longitudinal fasciculus) of dissimilarity. Further research is expected to understand the origins of the difference.Acknowledgements
This work was supported by the National Research Foundation of Korea (NRF) Grant funded by the Korean Government (MSIP) (No. NRF-2015R1A5A7037676) and by the Brain Korea 21 Plus Project in 2016.
References
1. Mackay, Alex, et al. "In vivo visualization of myelin water in brain by magnetic resonance." Magnetic Resonance in Medicine 31.6 (1994): 673-677.
2. Eng, John, Toni L. Ceckler, and Robert S. Balaban. "Quantitative 1H magnetization transfer imaging in vivo." Magnetic Resonance in Medicine 17.2 (1991): 304-314.
3. Basser, Peter J., James Mattiello, and Denis LeBihan. "Estimation of the effective self-diffusion tensor from the NMR spin echo." Journal of Magnetic Resonance, Series B 103.3 (1994): 247-254.
4. Du, Yiping P., et al. "Fast multislice mapping of the myelin water fraction using multicompartment analysis of T 2* decay at 3T: a preliminary postmortem study." Magnetic Resonance in Medicine 58.5 (2007): 865-870.
5. Oh, Se-Hong, et al. "Direct visualization of short transverse relaxation time component (ViSTa)." NeuroImage 83 (2013): 485-492.
6. Henkelman, R. Mark, et al. "Quantitative interpretation of magnetization transfer." Magnetic Resonance in Medicine 29.6 (1993): 759-766.
7. Helms, Gunther, et al. "High-resolution maps of magnetization transfer with inherent correction for RF inhomogeneity and T1 relaxation obtained from 3D FLASH MRI." Magnetic Resonance in Medicine 60.6 (2008): 1396-1407.
8. Bellani, Marcella, et al. "DTI and Myelin Plasticity in Bipolar Disorder: Integrating Neuroimaging and Neuropathological Findings." Frontiers in Psychiatry 7 (2016).
9. Nam, Yoonho, et al. "Improved estimation of myelin water fraction using complex model fitting." NeuroImage 116 (2015): 214-221.
10. Cabana, Jean-François, et al. "Quantitative magnetization transfer imaging made easy with qMTLab: Software for data simulation, analysis, and visualization." Concepts in Magnetic Resonance Part A (2016).
11. Woolrich, Mark W., et al. "Bayesian analysis of neuroimaging data in FSL." Neuroimage 45.1 (2009): S173-S186.
12. Avants, Brian B., Nick Tustison, and Gang Song. "Advanced normalization tools (ANTS)." Insight J 2 (2009): 1-35.
Figures